Abstract
Background
All-trans-retinoic acid (ATRA) is a differentiating agent used in the treatment of acute-promyelocytic-leukemia (APL) and it is under-exploited in other malignancies despite its low systemic toxicity. A rational/personalized use of ATRA requires the development of predictive tools allowing identification of sensitive cancer types and responsive individuals.
Materials and methods
RNA-sequencing data for 10 080 patients and 33 different tumor types were derived from the TCGA and Leucegene datasets and completely re-processed. The study was carried out using machine learning methods and network analysis.
Results
We profiled a large panel of breast-cancer cell-lines for in vitro sensitivity to ATRA and exploited the associated basal gene-expression data to initially generate a model predicting ATRA-sensitivity in this disease. Starting from these results and using a network-guided approach, we developed a generalized model (ATRA-21) whose validity extends to tumor types other than breast cancer. ATRA-21 predictions correlate with experimentally determined sensitivity in a large panel of cell-lines representative of numerous tumor types. In patients, ATRA-21 correctly identifies APL as the most sensitive acute-myelogenous-leukemia subtype and indicates that uveal-melanoma and low-grade glioma are top-ranking diseases as for average predicted responsiveness to ATRA. There is a consistent number of tumor types for which higher ATRA-21 predictions are associated with better outcomes.
Conclusions
In summary, we generated a tumor-type independent ATRA-sensitivity predictor which consists of a restricted number of genes and has the potential to be applied in the clinics. Identification of the tumor types that are likely to be generally sensitive to the action of ATRA paves the way to the design of clinical studies in the context of these diseases. In addition, ATRA-21 may represent an important diagnostic tool for the selection of individual patients who may benefit from ATRA-based therapeutic strategies also in tumors characterized by lower average sensitivity.
Keywords: machine-learning, network analysis, pharmacogenomics, retinoic acid, translational research, precision medicine
Introduction
All-trans-retinoic acid (ATRA) [1] is used in the treatment of acute-promyelocytic-leukemia (APL) [2]. ATRA is a non-conventional anti-tumor agent endowed with cyto-differentiating activity [3]. The unusual mechanism of action, the clinical results obtained in APL and numerous pre-clinical data in various types of neoplastic diseases have raised interest in ATRA for the treatment of other tumors. In a previous study, we demonstrated that luminal and ER+ breast cancer cell-lines are generally characterized by sensitivity to the anti-proliferative action of ATRA [4], while triple-negative cell-lines tend to be resistant to the retinoid. Nevertheless, it must be stressed that there are several exceptions in both categories [5]. A rational use of ATRA in oncology requires the identification of the individual patients who may benefit from therapeutic strategies based on the retinoid. The present work reports on the identification of a gene-expression model originally developed to predict the in vitro anti-proliferative action of ATRA in breast cancer cell-lines. The model generated via a machine-learning approach has been further refined and proved to be of potential use in predicting ATRA-sensitivity in a tumor-type independent manner.
Materials and methods
ATRA-sensitivity scores and gene-expression analysis
Breast cancer cell-lines (N = 48) were exposed to vehicle (DMSO) or five logarithmically increasing concentrations of ATRA (0.001–10.0 μM) for 9 days. At the end of the treatment, cell growth was determined with the sulforhodamine assay [4]. Each experimental point consisted of six cell-culture replicates and each experiment included an internal positive control represented by a full-dose–response curve of the highly sensitive SKBR3 cell line. For each cell line at least two independent experiments were carried out. ATRA-scores were determined as detailed in supplementary File S1 and Figure S1, available at Annals of Oncology online. ATRA-score = log2 transformation of the product of AUC×Amax, rescaled in a range between 0 and 1. ‘0’ and ‘1’ indicate total resistance and maximal sensitivity, respectively, to ATRA.
Gene-expression data for the cell-lines and tumor samples were obtained from Cancer Cell-line Encyclopedia [6], The Cancer Genome Atlas (TCGA; http://cancergenome.nih.gov) and Leucegene (http://leucegene.ca/leucegene/resources.php) databases. RNA-Seq data processing/quantification, fusion-transcripts detection and gene-expression to phenotype associations were carried out as described in supplementary File S1, available at Annals of Oncology online.
ATRA-139 model generation
We trained several machine learning algorithms using gene-expression data of 30 breast cancer cell-lines and evaluated their performance on an independent test-set consisting of a further 18 cell-lines. The composition of the respective subsets is provided in supplementary File S2, available at Annals of Oncology online: Table S1. The best performing algorithm is a penalized ridge linear regression model (ATRA-139) which was trained on a subset of pre-selected genes. A detailed description of the feature selection strategy used for developing ATRA-139 and a comparison of all tested machine learning algorithms (supplementary File S2: Table S2, available at Annals of Oncology online) are provided in supplementary File S1, available at Annals of Oncology online.
Generation of co-expression networks and ATRA-21 model development
Co-expression networks for 24 different cancer types were generated using the ARACNE algorithm [7] implemented in the Cytoscape Network Inference Toolbox. We determined a consensus network that is conserved across tumor types and used it to perform additional feature selection on the original ATRA-139 model. Through this procedure we could restrict the predictive model to 21 genes (ATRA-21). The entire-workflow leading to ATRA-21 model development and its comparison to randomly generated models are detailed in supplementary File S1, available at Annals of Oncology online.
Results
ATRA-responsiveness of breast cancer cell-lines and development of a predictive gene-expression model
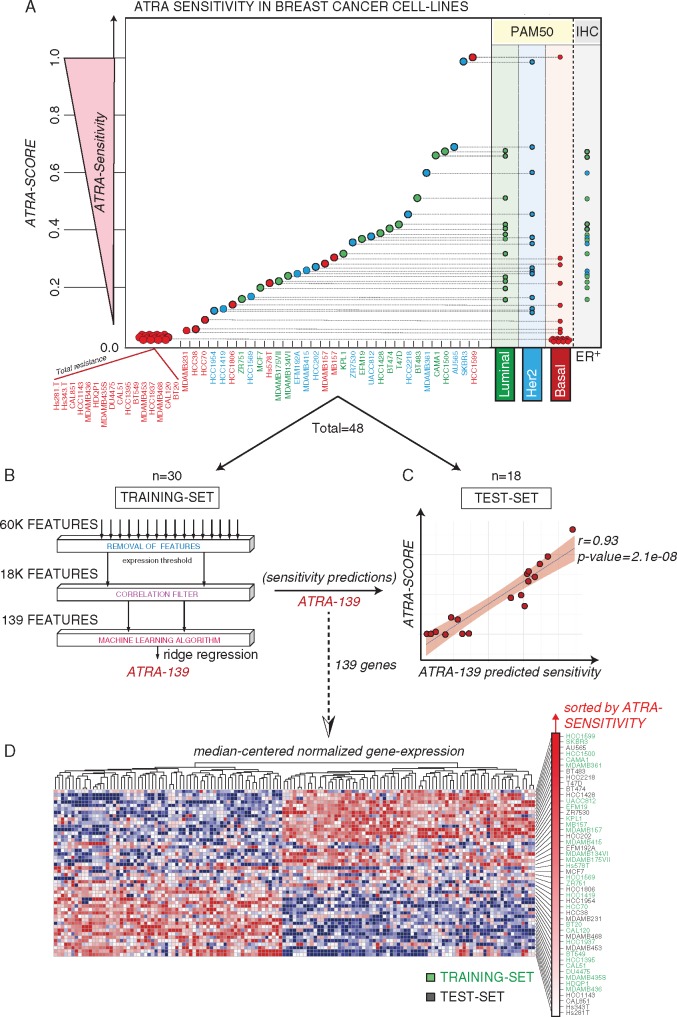
We defined the profile of ATRA-sensitivity in 48 breast cancer cell-lines representing the heterogeneity of the disease. The drug response of each cell-line (Figure 1A and supplementary File S2: Table S1, available at Annals of Oncology online) was quantified by computation of a sensitivity score (ATRA-score, supplementary Figure S1, available at Annals of Oncology online). In general, luminal, ER+ and HER2+ cells are characterized by high ATRA-scores (high sensitivity).
Figure 1.
ATRA sensitivity profiles in breast cancer cell-lines and ATRA-139 model. (A) The indicated breast cancer cell-lines were treated for 9 days with increasing concentrations of ATRA and the corresponding ATRA-sensitivity scores (ATRA-Scores) were calculated. The PAM50 classification and ER-positivity of the cell-lines are indicated on the right. (B) The workflow adopted in the selection of the features used for the training of the ridge regression model is shown. Total = 48 cell-lines; Training-set = 30 cell-lines; (C) The scatter plot shows the performance of the ATRA-139 model in predicting ATRA-sensitivity in the test set. Test-set = 18 cell-lines. (D) The heatmap illustrates the expression levels of the ATRA-139 genes in the panel of 48 breast cancer cell-lines. Genes are clustered according to the Euclidean distance, while the cell-lines are ranked on the basis of the ATRA-scores. The training set (green) and test set (black) cell-lines are indicated on the right.
To develop a tool capable of predicting ATRA-sensitivity, we trained machine learning models by linking basal gene-expression to the ATRA-score in the cell-lines that were split into a training- (n = 30) and a test-set (n = 18). Different models were trained and tested for predictive performance (supplementary File S2: Table S2, available at Annals of Oncology online). The best performing model was developed by pre-selecting features highly correlated to the ATRA-score, using a 10-times repeated Leave Half Out (LHO) cross-validation procedure (Figure 1B) and discarding non-significantly correlated genes (average Spearman’s rho significance >0.05). The resulting 139 genes were used to train a ridge regression model (ATRA-139) (supplementary File S2: Table S3, available at Annals of Oncology online). ATRA-139 predicts responsiveness of cross-validated samples and maintains performance in the test-set (r = 0.93) (Figure 1C), indicating no overfit of the training data. Expression levels of the corresponding features across the cell-lines are shown in Figure 1D.
ATRA-139 sensitivity predictions and co-expression modules in mammary tumors
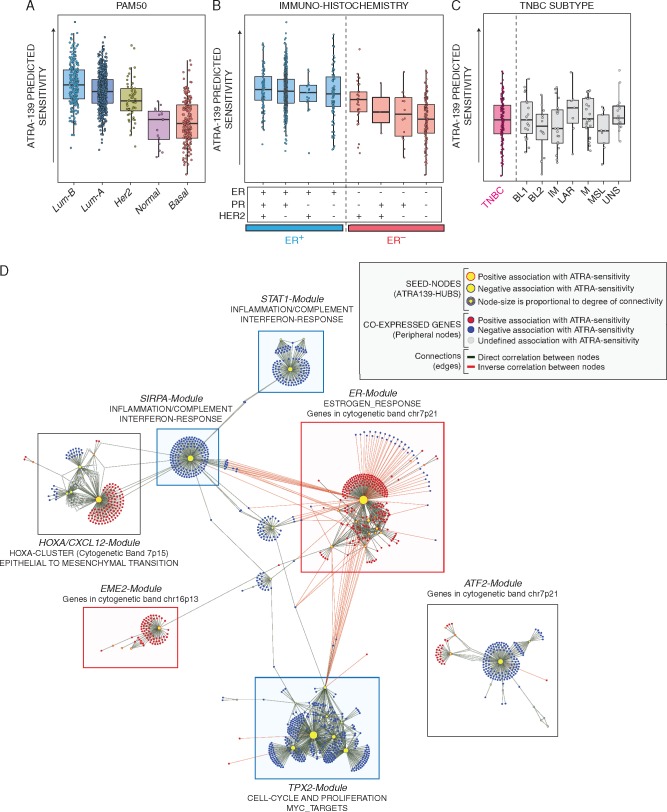
We used ATRA-139 to predict ATRA-sensitivity in primary breast cancers (TCGA, The Cancer Genome Atlas) and stratified the predictions according to different classifications (Figure 2A–C). In general, the predictions based on ATRA-139 are consistent with the results obtained in our panel of cell-lines, as they support the idea that luminality and ER-positivity are major determinants of ATRA sensitivity in breast cancer.
Figure 2.
ATRA-139 sensitivity predictions and co-expression network in primary mammary tumors. The panels illustrate ATRA-139 sensitivity predictions in breast cancers grouped according to PAM50 (A), the immunohistochemically-determined ER, progesterone PR and HER2 status (B) and triple-negative breast cancers (ER-/PR-/HER2-) following grouping according to the transcriptomic profile (BL1, basal-like 1; BL2, basal-like 2; IM, immunomodulatory; LAR, luminal androgen receptor; M, mesenchymal; ML, mesenchymal-like; UNS, unspecified) (C). (D) The panel illustrates the co-expression network generated from primary breast cancer patients by applying the ARACNE algorithm to gene expression data. ATRA-139 genes were used as seed nodes (hubs) in the network-generation process. Clusters of co-expressed genes significantly enriched for either known biological pathways or genomic regions are annotated and highlighted by colored boxes (Predicted association to ATRA sensitivity: red, positive; blue, negative; grey, mixed). Further details are included in the provided legend (top right).
We applied the ARACNE algorithm to define the co-expression network of the TCGA breast cancer cases. We found several co-expressed genes positively or negatively associated with the features of ATRA-139, which were used as seed nodes (hubs) in the network generation step. We identified seven major modules showing a strong association with specific biological pathways (Figure 2D and supplementary File S2: Table S4, available at Annals of Oncology online).
The largest module (TPX2-Module) is enriched in genes involved in cell cycle and proliferation pathways. The second-largest module (ER-Module) is centered on ER and includes RARα. The presence of a module consisting of genes directly associated with ATRA-sensitivity and involved in ER-regulated processes is consistent with the experimental results obtained in our panel of breast cancer cell-lines. Three other identified modules are: HOXA/CXCL12-Module, which is enriched in Epithelial-to-Mesenchymal-Transition (EMT) genes; STAT1-Module and SIRPA-Module that are enriched for genes involved in interferon-/immune-responses. The last two identified modules (EME2-Module and ATF2-Module) do not show strong associations with any biological pathway. Following stratification of mammary tumors according to PAM-50, we evaluated differences in the expression levels of the genes belonging to all modules (supplementary Figure S2, available at Annals of Oncology online).
ATRA-139 correctly predicts retinoid responsiveness of APL
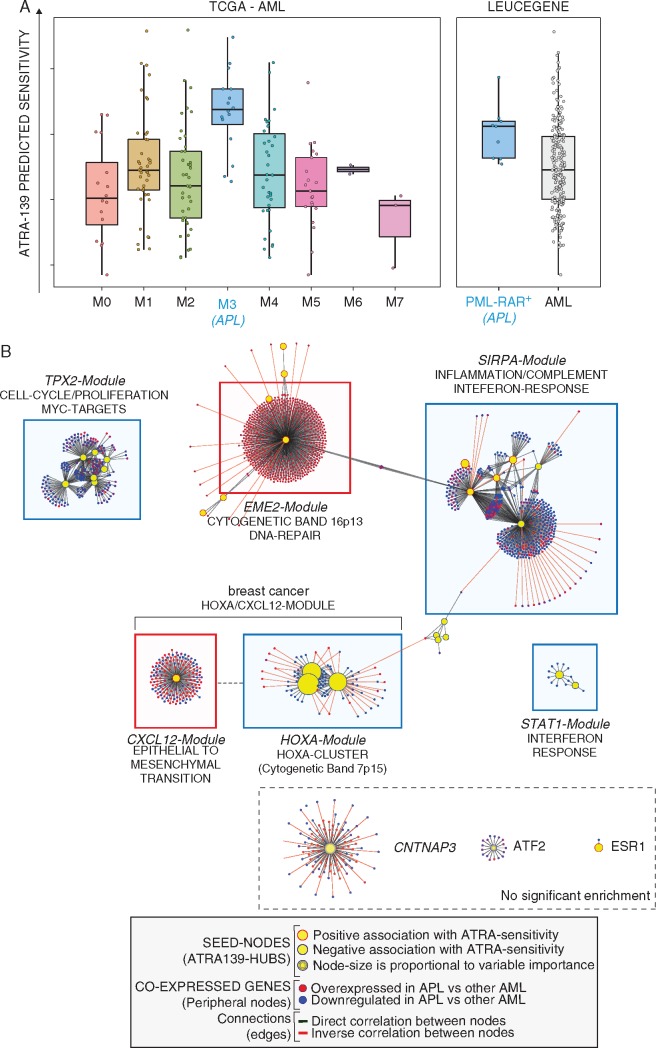
The only neoplastic disease that is known to be highly sensitive to ATRA is APL, a subtype of acute-myeloid-leukemia (AML). Thus, we turned to the 178 AML samples of the TCGA dataset. Indeed, ATRA-139 correctly predicts APL (FAB:M3) as the AML subgroup characterized by the highest average sensitivity to the retinoid (Figure 3A, left). These results were confirmed in the Leucegene dataset, where ATRA-139 identifies PML-RAR+ AML as the most ATRA-sensitive subtype (Figure 3A, right).
Figure 3.
ATRA-139 sensitivity predictions and co-expression network in AML patients. (A) Left: the panel illustrates ATRA-139 sensitivity predictions in the TCGA AML patients grouped according to the FAB-subtype. The M3-subtype (acute promyelocytic leukemia, APL) is highlighted in blue. All APL cases are characterized by expression of the PML-RAR gene. Right: sensitivity predictions in the Leucegene AML cases grouped according to the presence (PML-RAR+) absence (AML) of the PML-RAR gene fusion are shown. (B) The panel illustrates the co-expression network in AML. The identified network was obtained by applying the ARACNE algorithm to gene expression data and ATRA-139 genes were used as seed nodes (hubs) in the generation process. Modules of co-expressed genes significantly enriched for either known biological pathways or genomic regions are annotated and highlighted by colored boxes (predicted association to ATRA sensitivity: red, positive; blue, negative). Modules showing no enrichment are indicated by a dashed box (bottom right). Node colors indicate the expression ratio in APL relative to other AML subtypes (red, up-regulated; blue, down-regulated) and edge-colors indicate the correlation between adjacent genes (correlation: green, positive; red, negative). Further annotations are included in the provided legend (bottom).
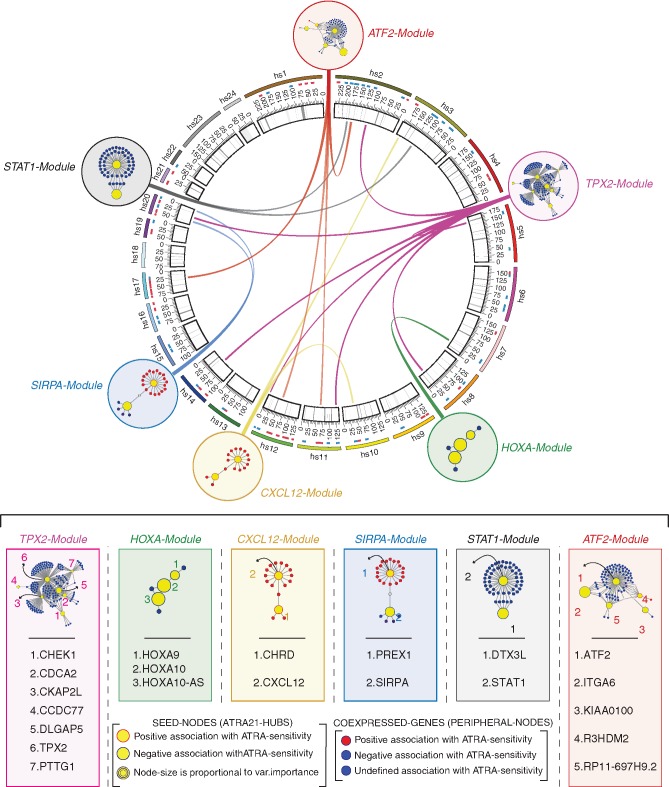
We derived a co-expression network also in this type of leukemia using the same approach described for breast cancer. Noticeably, most of the ATRA-139 genes are organized in modules characterized by the same hub composition observed in mammary tumors. In addition, although the co-expressed genes in AML and breast cancer are not necessarily the same, six of the modules identified in AML are enriched for the same biological pathways (Figure 3B and supplementary File S2: Table S5, available at Annals of Oncology online). Not surprisingly, the only module which is not conserved in AML is the ER-Module. Overall, our data support the idea that the majority of the modules defined by ATRA-139 regulate processes of general relevance for different types of tumors. Thus, at least some of the ATRA-139 features may be predictive of ATRA sensitivity in a tumor-type independent fashion. To identify these features, we defined a consensus network among different cancers. First, we generated 24 tumor-type specific co-expression networks (supplementary Figure S3 and File S2: Table S6, available at Annals of Oncology online). Subsequently, we considered only the edges present in more than one-third of the networks, identifying six modules whose constituents are co-expressed in a tumor-type independent manner (Figure 4). Except for the ER- and EME2-Modules, all the other modules are analogous to those identified in breast cancer and AML. Of the initial ATRA-139 genes, 21 are maintained in this consensus network (supplementary File S2: Table S7, available at Annals of Oncology online). Using the refined subset of 21 genes, we trained a new ridge regression model (ATRA-21) on the 48 breast cancer cell-lines with ATRA-score set as the response variable (supplementary File S2: Table S7, available at Annals of Oncology online).
Figure 4.
Consensus modules, ATRA-21 predictive model genes and genomic localization. The circos plot (top) illustrates the genomic position of the ATRA-21 genes belonging to the 6 identified consensus co-expression modules. ATRA-21 genes are indicated by yellow circles surrounded by: red, predicted positive association with ATRA-sensitivity; blue, predicted negative association with ATRA-sensitivity. The six identified modules (ATF2-, TPX2-, HOXA-, CXCL12, SIRPA- and STAT-Modules) were obtained by preserving the edges conserved in >1/3 of the 24 tumor-specific co-expression networks. Co-expressed genes other than ATRA-21 hubs are marked with colors to indicate the predicted association with ATRA-sensitivity (red, positive; blue, negative). Annotations of ATRA-21 genes and further details are included in the provided legend (bottom center).
ATRA-21 correctly predicts in vitro sensitivity in a broad panel of tumor cell-lines of different origin
To further evaluate whether ATRA-21 predictions are exportable to other tumor types, we considered a large number of cell-lines, representative of different tumors, which were profiled for in vitro ATRA-sensitivity [Genomic-of-Drug-Sensitivity-in-Cancer (GDSC) project]. The experimental conditions that we employed to measure ATRA-sensitivity in breast cancer cell-lines are different from those used by the GDSC. In particular, the treatments in GDSC were limited to 3 days, while they extended to 9 days in our conditions. GDSC results may underestimate real ATRA-sensitivity, as our experiments demonstrate that several cell-lines respond only after prolonged treatments. We assessed the comparability between our predictions and the GDSC experimental data in breast cancer cell-lines (supplementary Figure S4 and File S2: Table S8, available at Annals of Oncology online). The two parameters are significantly correlated. The correlation becomes even more evident when analysis excludes low-responding cells which may include potential false negatives (<20% difference in the number of cells between controls and samples treated with the highest ATRA concentration).
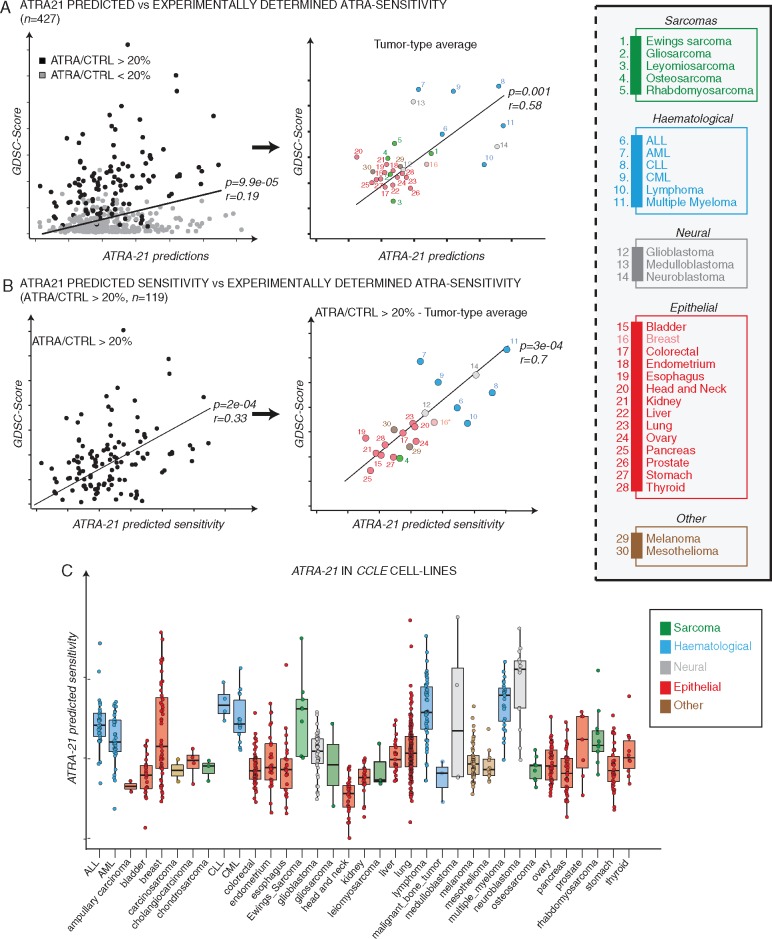
Having set the conditions of comparability, we extended the analysis to all the 427 cell-lines representative of different tumor types (Figure 5A, left). We observed a significant correlation between ATRA-21 predictions and the experimentally determined ATRA sensitivity values (GDSC-scores). This correlation is maintained if cell lines are grouped according to the tumor type (Figure 5A, right). Taking into consideration the cell-lines characterized by the above mentioned 20% minimal response threshold, a higher correlation between the ATRA-21 predictions and experimentally determined ATRA-sensitivity is obtained (Figure 5B, left). Grouping of the cell-lines for the tumor type, results in an even higher correlation value (Pearson’s r = 0.70, P = 0.0003; Figure 5B, right). The significance of these results was further supported with randomly generated models (supplementary File S1 and Figure S5, available at Annals of Oncology online). Taken together, the data demonstrate that the predicting validity of ATRA-21 is not limited to breast cancer and extends to all other tumor cell-lines. The ATRA-sensitivity predictions for the entire panel of 935 cell-lines present in the CCLE database are presented in Figure 5C, after grouping for the tumor type. Neuroblastoma and different hematological cell-lines are predicted to be particularly responsive to ATRA.
Figure 5.
ATRA-21 sensitivity predictions across cancer cell-lines. (A) The scatter-plots show the correlation between experimentally determined ATRA-sensitivity (GDSC-score) and ATRA-21 predictions for 427 cancer cell-lines belonging to different tumor types. Left: Cell-lines showing at least 20% difference in the number of cells between controls and samples treated with the highest ATRA concentration are marked in black, the remainder cell-lines are marked in gray. Right: the scatterplot shows the correlation between ATRA-21 sensitivity predictions and the experimentally determined ATRA-sensitivity values in 427 cancer cell-lines grouped according to the tumor type. (B) The scatter-plots show the correlation between ATRA-21 predictions and experimentally determined ATRA-sensitivity (GDSC-Score) in cell-lines (N = 119) showing a > 20% decrease in cell counts (maximal ATRA concentration—vehicle treated control). Left: individual cell-lines; right: cell-lines grouped according to the tumor type. (C) The box-plots illustrate ATRA-21 sensitivity predictions in cancer cell-lines grouped according to the tumor type.
Predictions of ATRA sensitivity in the TCGA tumor collection
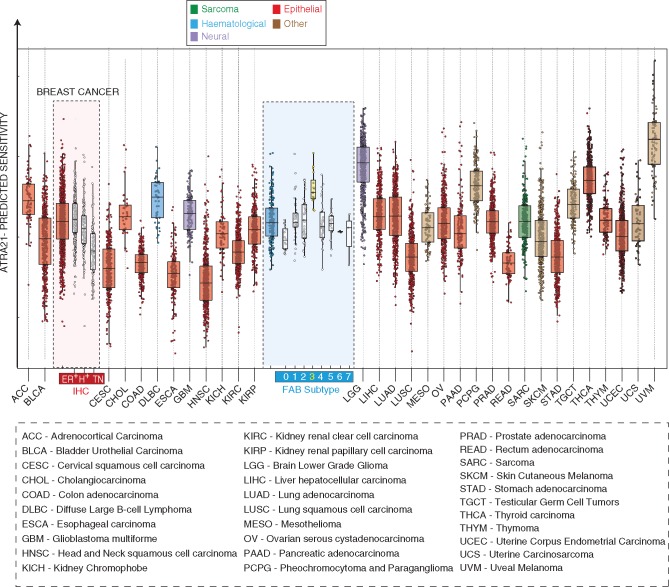
ATRA-21 was used to predict ATRA-sensitivity in the 9,850 TCGA samples, representing 33 different tumor types. Relative to ATRA-139, ATRA-21 better predicts the higher sensitivity of APL among all other AML subtypes (Figure 6 and supplementary File S2: Table S9, available at Annals of Oncology online). The result is confirmed in the Leucegene dataset (supplementary Figure S6, available at Annals of Oncology online). Thus, reduction from 139 to 21 genes improves the ability of the model to correctly assess ATRA-sensitivity across AMLs. Noticeably, ATRA-21 still predicts high ATRA sensitivity in ER+ breast cancer, despite the absence of 13/14 ATRA-139 ER-related genes. On the basis of our data (Figure 6), it is interesting to notice that, on average, uveal melanoma, lower grade glioma and thyroid carcinoma are predicted to be even more sensitive to ATRA than APL, although further evidence is necessary to support this contention.
Figure 6.
ATRA-21 sensitivity predictions across tumor types. The box plots illustrate the distribution of ATRA-21 sensitivity predictions after grouping of the tumor types (TCGA database). In the case of breast cancer and acute myeloid leukemias, cases are stratified according to immuno-histochemical subtype and FAB classification, respectively. ER+, estrogen-receptor-positive; H+, HER2-positive; TN, triple-negative; 0–7, FAB-subtypes M0 to M7.
Correlations between ATRA-sensitivity predictions and clinical outcomes
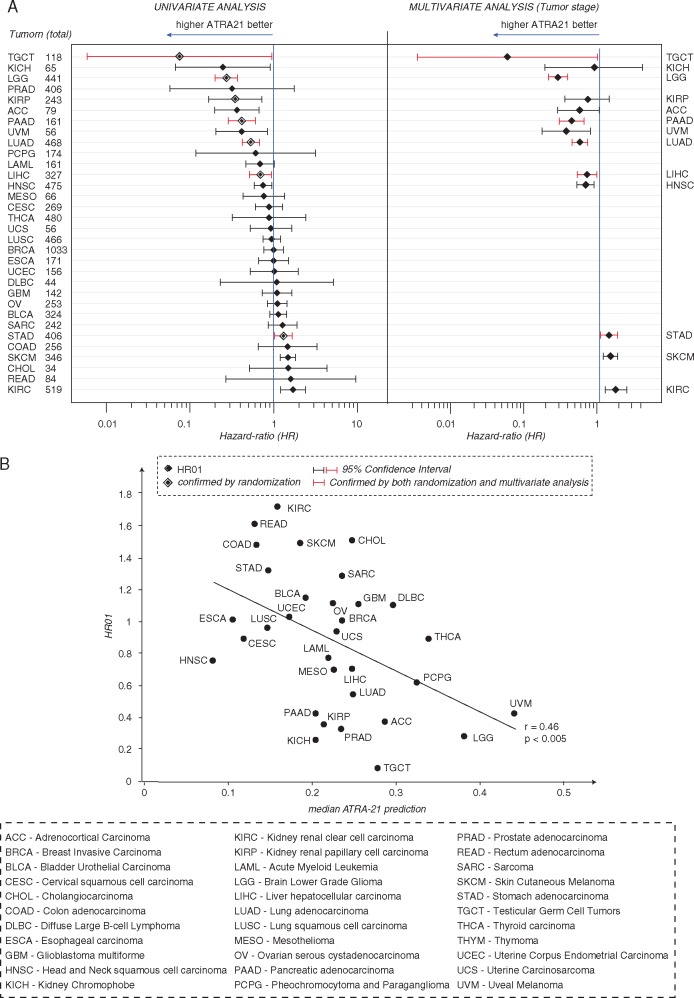
We tested the association between ATRA-21 predictions and overall survival in the different TCGA tumor types using Cox-Proportional-Hazard analysis (Figure 7A, left). As this analysis may be affected by various confounding factors, we further tested statistical significance in two ways. First, we compared ATRA-21 with 100 models, generated with 21 randomly selected genes. Second, we carried out multivariate analysis for tumor stage, which is a potent prognostic factor (Figure 7A, right). Among the 13 tumors with a significant association after univariate analysis, 7 were confirmed by randomization, 10 were confirmed by multivariate analysis and 6 by both types of analysis (Figure 7A, red). The majority of these last tumors (5/6) show negative Hazard ratios. Moreover, we observed a significant inverse correlation between Hazard ratios and median ATRA-21 scores in the different tumor types (Figure 7B).
Figure 7.
Associations of ATRA-21 predictions with overall survival. (A) The Forest Plot shows the results of Cox proportional Hazard regression analysis (Left: univariate-analysis; right = multivariate analysis for tumor stage). Diamonds indicate the hazard-ratios associated with 0.1 unit increases in the ATRA-21 value for the different tumor types in the TCGA database. The 95% interval of confidence is represented by the horizontal bars. The vertical bar indicates no association. Larger diamonds indicate significant associations after randomization test. The tumor types marked in red are those for which significant association between ATRA-21 and overall survival is confirmed by randomization test and multivariate analysis. (B) The Scatter plot illustrates the correlation (r = Pearson’s correlation coefficient) between Hazard ratios and median ATRA-21 predictions in different tumor types. The asterisks indicate the tumor types showing significant associations after the randomization test. APL samples are not included in this analysis, since ATRA is used in the treatment of the disease.
Discussion
A rational use of ATRA in oncology calls for the identification of the types of neoplasia which are most responsive to the anti-tumor activity of this natural retinoid. In view of precision medicine approaches to treatment, it is also important to predict and confirm ATRA responses in single patients independently of the tumor type.
In the present study, we developed a gene-expression model, consisting of 21 genes, which is associated with and predicts ATRA-sensitivity in a tumor-type independent fashion (ATRA-21). ATRA-21 predicts sensitivity in APL patients. Moreover, ATRA-21 predictions are highly correlated with experimentally determined ATRA-sensitivity in the large panel of GDSC cell-lines from 37 different tumors. The results obtained in the cell-lines prompted us to apply ATRA-21 to all the tumor types present in the TCGA database. Uveal melanoma is the neoplasia with the highest predicted sensitivity, followed by low grade glioma, thyroid cancer, paraganglioma/pheochromocytoma, diffuse large B-cell lymphoma and adrenocortical cancer. The metastatic form of uveal melanoma is very aggressive and lacks therapeutic options [8], which suggests that ATRA-based protocols should be tested in this tumor context. Paragangliomas/pheochromocytomas are rare neuroendocrine tumors, which are deemed to be responsive to the differentiating action of ATRA [9]. Diffuse large B-cell lymphoma is the most frequent form of non-Hodgkin Lymphoma and there is evidence that derived cell-lines are responsive to the apoptotic action of ATRA [10, 11], confirming our predictions. As for adrenocortical cancer, there is recent evidence, consistent with our data, which indicates that the ATRA analogue, 9-cis-retinoic acid, exerts anti-tumor effects in xenografts of this tumor type [12, 13]. The results described above provide insights into the types of tumors which are likely to represent targets for the study of ATRA-based therapeutic strategies. However, it must be noticed that there is a significant dispersion of the predictions within each type of tumor. Thus, even tumor types characterized by low-predicted average sensitivity to ATRA include a proportion of cases which may be sensitive to the retinoid. This has far-reaching implications in the context of personalized treatments, as it suggests that ATRA-21 should be implemented as a diagnostic tool for the selection of cancer patients who may benefit from ATRA-based therapeutic strategies. Development of a clinically useful diagnostic tool requires further studies aimed at the optimization of the measures in terms of standardization and application in the clinical setting. In this context, it is worth mentioning that ATRA-21, which was developed from RNA-Seq derived gene-expression data, can be applied to microarray data as well. In fact, comparison between predictions obtained by applying ATRA-21 to RNA-Seq and microarray data available for 519 breast cancer patients (TCGA) demonstrates a highly significant correlation (supplementary Figure S7, available at Annals of Oncology online).
The associations between ATRA-21 predictions and survival of tumor patients determined in our study are also very intriguing. In fact, there is a consistent number of tumor types for which higher ATRA-21 predictions are associated with better outcomes, independent of tumor stage. If we assume that the endogenous circulating levels of ATRA (10−9–10−8 M), which fall in the range of in vitro active concentrations, have an inhibitory effect on the growth/progression of ATRA-sensitive tumors, then the observation supports the idea that ATRA-21 is positively correlated with sensitivity to the retinoid. This may further sustain the validity of our model. It is also interesting that ATRA-21 may not only represent a useful diagnostic tool in view of personalized treatments but it may also be a prognostic factor for some tumors. ATRA-21 prognostic relevance may be associated with the anti-tumor properties of endogenous ATRA.
The integrated and innovative approach pursued in this study led to the development of ATRA-21, a model predicting retinoid sensitivity across tumor types. ATRA-21 consists of a restricted number of genes, which has the potential to be applied in the clinics for the selection of patients affected by different tumor types who may benefit from therapeutic regimens based on the retinoid. Identification of the tumor types that are likely to be generally sensitive to the action of ATRA paves the way to the design of specific pre-clinical and clinical studies. We propose that the global approach used in this study can be applied to known or potential therapeutic agents other than ATRA.
Supplementary Material
Acknowledgements
The results described in the study are partly based upon data generated by The Cancer Genome Atlas managed by the NCI and NHGRI. TCGA data access was approved by NIH for project #9522: ‘Retinoid-based anti-tumor strategies’. We would like to thank Dr Luca Porcu and Dr Paolo Ubezio for helpful discussions.
Funding
Grants from the Associazione Italiana per la Ricerca contro il Cancro (AIRC; Grant No. 17058) and the Fondazione Italo Monzino to Enrico Garattini were fundamental for the completion of this work.
Disclosure
The authors have declared no conflicts of interest.
References
- 1. Garattini E, Bolis M, Garattini SK. et al. Retinoids and breast cancer: from basic studies to the clinic and back again. Cancer Treat Rev 2014; 40: 739–749. [DOI] [PubMed] [Google Scholar]
- 2. Lo-Coco F, Avvisati G, Vignetti M. et al. Retinoic acid and arsenic trioxide for acute promyelocytic leukemia. N Engl J Med 2013; 369: 111–121. [DOI] [PubMed] [Google Scholar]
- 3. Garattini E, Gianni M, Terao M.. Cytodifferentiation by retinoids, a novel therapeutic option in oncology: rational combinations with other therapeutic agents. Vitam Horm 2007; 75: 301–354. [DOI] [PubMed] [Google Scholar]
- 4. Centritto F, Paroni G, Bolis M. et al. Cellular and molecular determinants of all-trans retinoic acid sensitivity in breast cancer: Luminal phenotype and RARalpha expression. EMBO Mol Med 2015; 7: 950–972. [DOI] [PMC free article] [PubMed] [Google Scholar]
- 5. Paroni G, Fratelli M, Gardini G. et al. Synergistic antitumor activity of lapatinib and retinoids on a novel subtype of breast cancer with coamplification of ERBB2 and RARA. Oncogene 2012; 31: 3431–3443. [DOI] [PubMed] [Google Scholar]
- 6. Barretina J, Caponigro G, Stransky N. et al. The cancer cell line encyclopedia enables predictive modelling of anticancer drug sensitivity. Nature 2012; 483: 603–607. [DOI] [PMC free article] [PubMed] [Google Scholar]
- 7. Margolin AA, Nemenman I, Basso K. et al. ARACNE: an algorithm for the reconstruction of gene regulatory networks in a mammalian cellular context. BMC Bioinformatics 2006; 7(Suppl 1): S7.. [DOI] [PMC free article] [PubMed] [Google Scholar]
- 8. Chattopadhyay C, Kim DW, Gombos DS. et al. Uveal melanoma: From diagnosis to treatment and the science in between. Cancer 2016; 122: 2299–2312. [DOI] [PMC free article] [PubMed] [Google Scholar]
- 9. Katagiri Y, Takeda K, Yu ZX. et al. Modulation of retinoid signalling through NGF-induced nuclear export of NGFI-B. Nat Cell Biol 2000; 2: 435–440. [DOI] [PubMed] [Google Scholar]
- 10. Niitsu N, Higashihara M, Honma Y.. Human B-cell lymphoma cell lines are highly sensitive to apoptosis induced by all-trans retinoic acid and interferon-gamma. Leuk Res 2002; 26: 745–755. [DOI] [PubMed] [Google Scholar]
- 11. Barna G, Sebestyen A, Weischede S. et al. Different ways to induce apoptosis by fenretinide and all-trans-retinoic acid in human B lymphoma cells. Anticancer Res 2005; 25: 4179–4185. [PubMed] [Google Scholar]
- 12. Liu-Chittenden Y, Patel D, Gaskins K. et al. Serum RARRES2 is a prognostic marker in patients with adrenocortical carcinoma. J Clin Endocrinol Metab 2016; jc20161781.. [DOI] [PMC free article] [PubMed] [Google Scholar]
- 13. Nagy Z, Baghy K, Hunyadi-Gulyas E. et al. Evaluation of 9-cis retinoic acid and mitotane as antitumoral agents in an adrenocortical xenograft model. Am J Cancer Res 2015; 5: 3645–3658. [PMC free article] [PubMed] [Google Scholar]
Associated Data
This section collects any data citations, data availability statements, or supplementary materials included in this article.


