

Abstract
Background
8q24.21 is a frequently amplified genomic region in colorectal cancer (CRC). This region is often referred to as a ‘gene desert’ due to lack of any important protein-coding genes, highlighting the potential role of noncoding RNAs, including long noncoding RNAs (lncRNAs) located around the proto-oncogene MYC. In this study, we have firstly evaluated the clinical significance of altered expression of lncRNAs mapped to this genomic locus in CRC.
Patients and methods
A total of 300 tissues, including 280 CRC and 20 adjacent normal mucosa specimens were evaluated for the expression of 12 lncRNAs using qRT-PCR assays. We analyzed the associations between lncRNA expression and various clinicopathological features, as well as with recurrence free survival (RFS) and overall survival (OS) in two independent cohorts.
Results
The expression of CCAT1, CCAT1-L, CCAT2, PVT1, and CASC19 were elevated in cancer tissues (P = 0.039, <0.001, 0.018, <0.001, 0.002, respectively). Among these, high expression of CCAT1 and CCAT2 was significantly associated with poor RFS (P = 0.049 and 0.022, respectively) and OS (P = 0.028 and 0.015, respectively). These results were validated in an independent patient cohort, in which combined expression of CCAT1 and CCAT2 expression was significantly associated with a poor RFS (HR:2.60, 95% confidence interval [CI]: 1.04–6.06, P = 0.042) and a poor OS (HR:8.38, 95%CI: 2.68–37.0, P < 0.001). We established a RFS prediction model which revealed that combined expression of CCAT1, CCAT2, and carcinoembryonic antigen was a significant determinant for efficiently predicting RFS in stage II (P = 0.034) and stage III (P = 0.001) CRC patients.
Conclusions
Several lncRNAs located in 8q24.21 locus are highly over-expressed in CRC. High expression of CCAT1 and CCAT2 significantly associates with poor RFS and OS. The expression of these two lncRNAs independently, or in combination, serves as important prognostic biomarkers in CRC.
Keywords: CCAT1, CCAT2, long noncoding RNA, MYC, 8q24, 8q24.21
Introduction
Colorectal cancer (CRC) is one of the most frequently diagnosed malignancies and a leading cause of cancer-related deaths worldwide [1]. High degree of mortality associated with CRC is largely due to late disease detection and lack of availability of adequate prognostic biomarkers, including the currently used tumor-node-metastasis (TNM) classification system from the American Joint Committee on Cancer for predicting tumor prognosis and recurrence. This highlights the need to develop robust prognostic biomarkers for CRC, and the expectations are that such biomarkers must offer a superior prognostic clinical usefulness compared with existing TNM staging classification. In addition, such biomarkers must perform independent of the existing classification criteria, and possess adequate prognostic significance for specific subgroups defined by TNM staging [2].
The chromosome 8q24.21 locus is one of the most highly and frequently amplified genomic region in CRC patients, and chromosomal gains at 8q23-24 have frequently been observed in CRC cell lines, primary tumors, as well as CRC metastases. More specifically, the single nucleotide polymorphism (SNP) rs6983267 at this locus has been shown to confer increased risk for CRC susceptibility [3–6]. Furthermore, the 8q24.21 locus also harbors the MYC proto-oncogene; however, other than MYC, there are few protein-coding genes in this region—hence often referred to as a ‘gene desert’ [7]. To gain further insights into the etiology of cancer, until recently, the research focus has been preferentially on the protein-coding genes, which were thought to play a key role in cancer progression. However, the recognition of non-protein coding genes, or noncoding RNAs (ncRNAs), which make up more than 95% of the human genome, have revolutionized our understanding, because these ncRNAs play in virtually all diseases including cancer [8].
Among the family of ncRNAs, much attention has been focused on the biological and clinical significance of small noncoding RNAs such as microRNAs (miRNAs), as well as long noncoding RNAs (lncRNAs) [9]. Previous studies have provided evidence that specific lncRNAs demonstrate altered expression in various cancers, including CRC [10]. Since previous studies have failed to identify any specific risk-susceptibility protein-coding genes in the ‘gene desert’ on 8q24, it is plausible that this region may in fact be a ‘ncRNA oasis’. If true, this would provide additional support for the functional and potential clinical significance for amplification of this region in CRC.
In view of this important gap in knowledge, we undertook the present study to characterize the expression alterations of lncRNAs, specifically mapped to the 8q24.21 locus, to identify whether any of these may have prognostic significance in CRC patients. In this first report of its kind, while systematically interrogating the clinical significance of lncRNAs associated with the 8q24.21 locus, we identified that high expression of colon cancer associated transcript 1 (CCAT1) and CCAT2 are associated with tumor recurrence and poor survival, and furthermore combination of these markers efficiently predicted tumor recurrence compared with the existing clinicopathological factors. We conclude that CCAT1 and CCAT2 are very attractive and potential prognostic biomarkers in CRC.
Materials and methods
Patients and sample collection
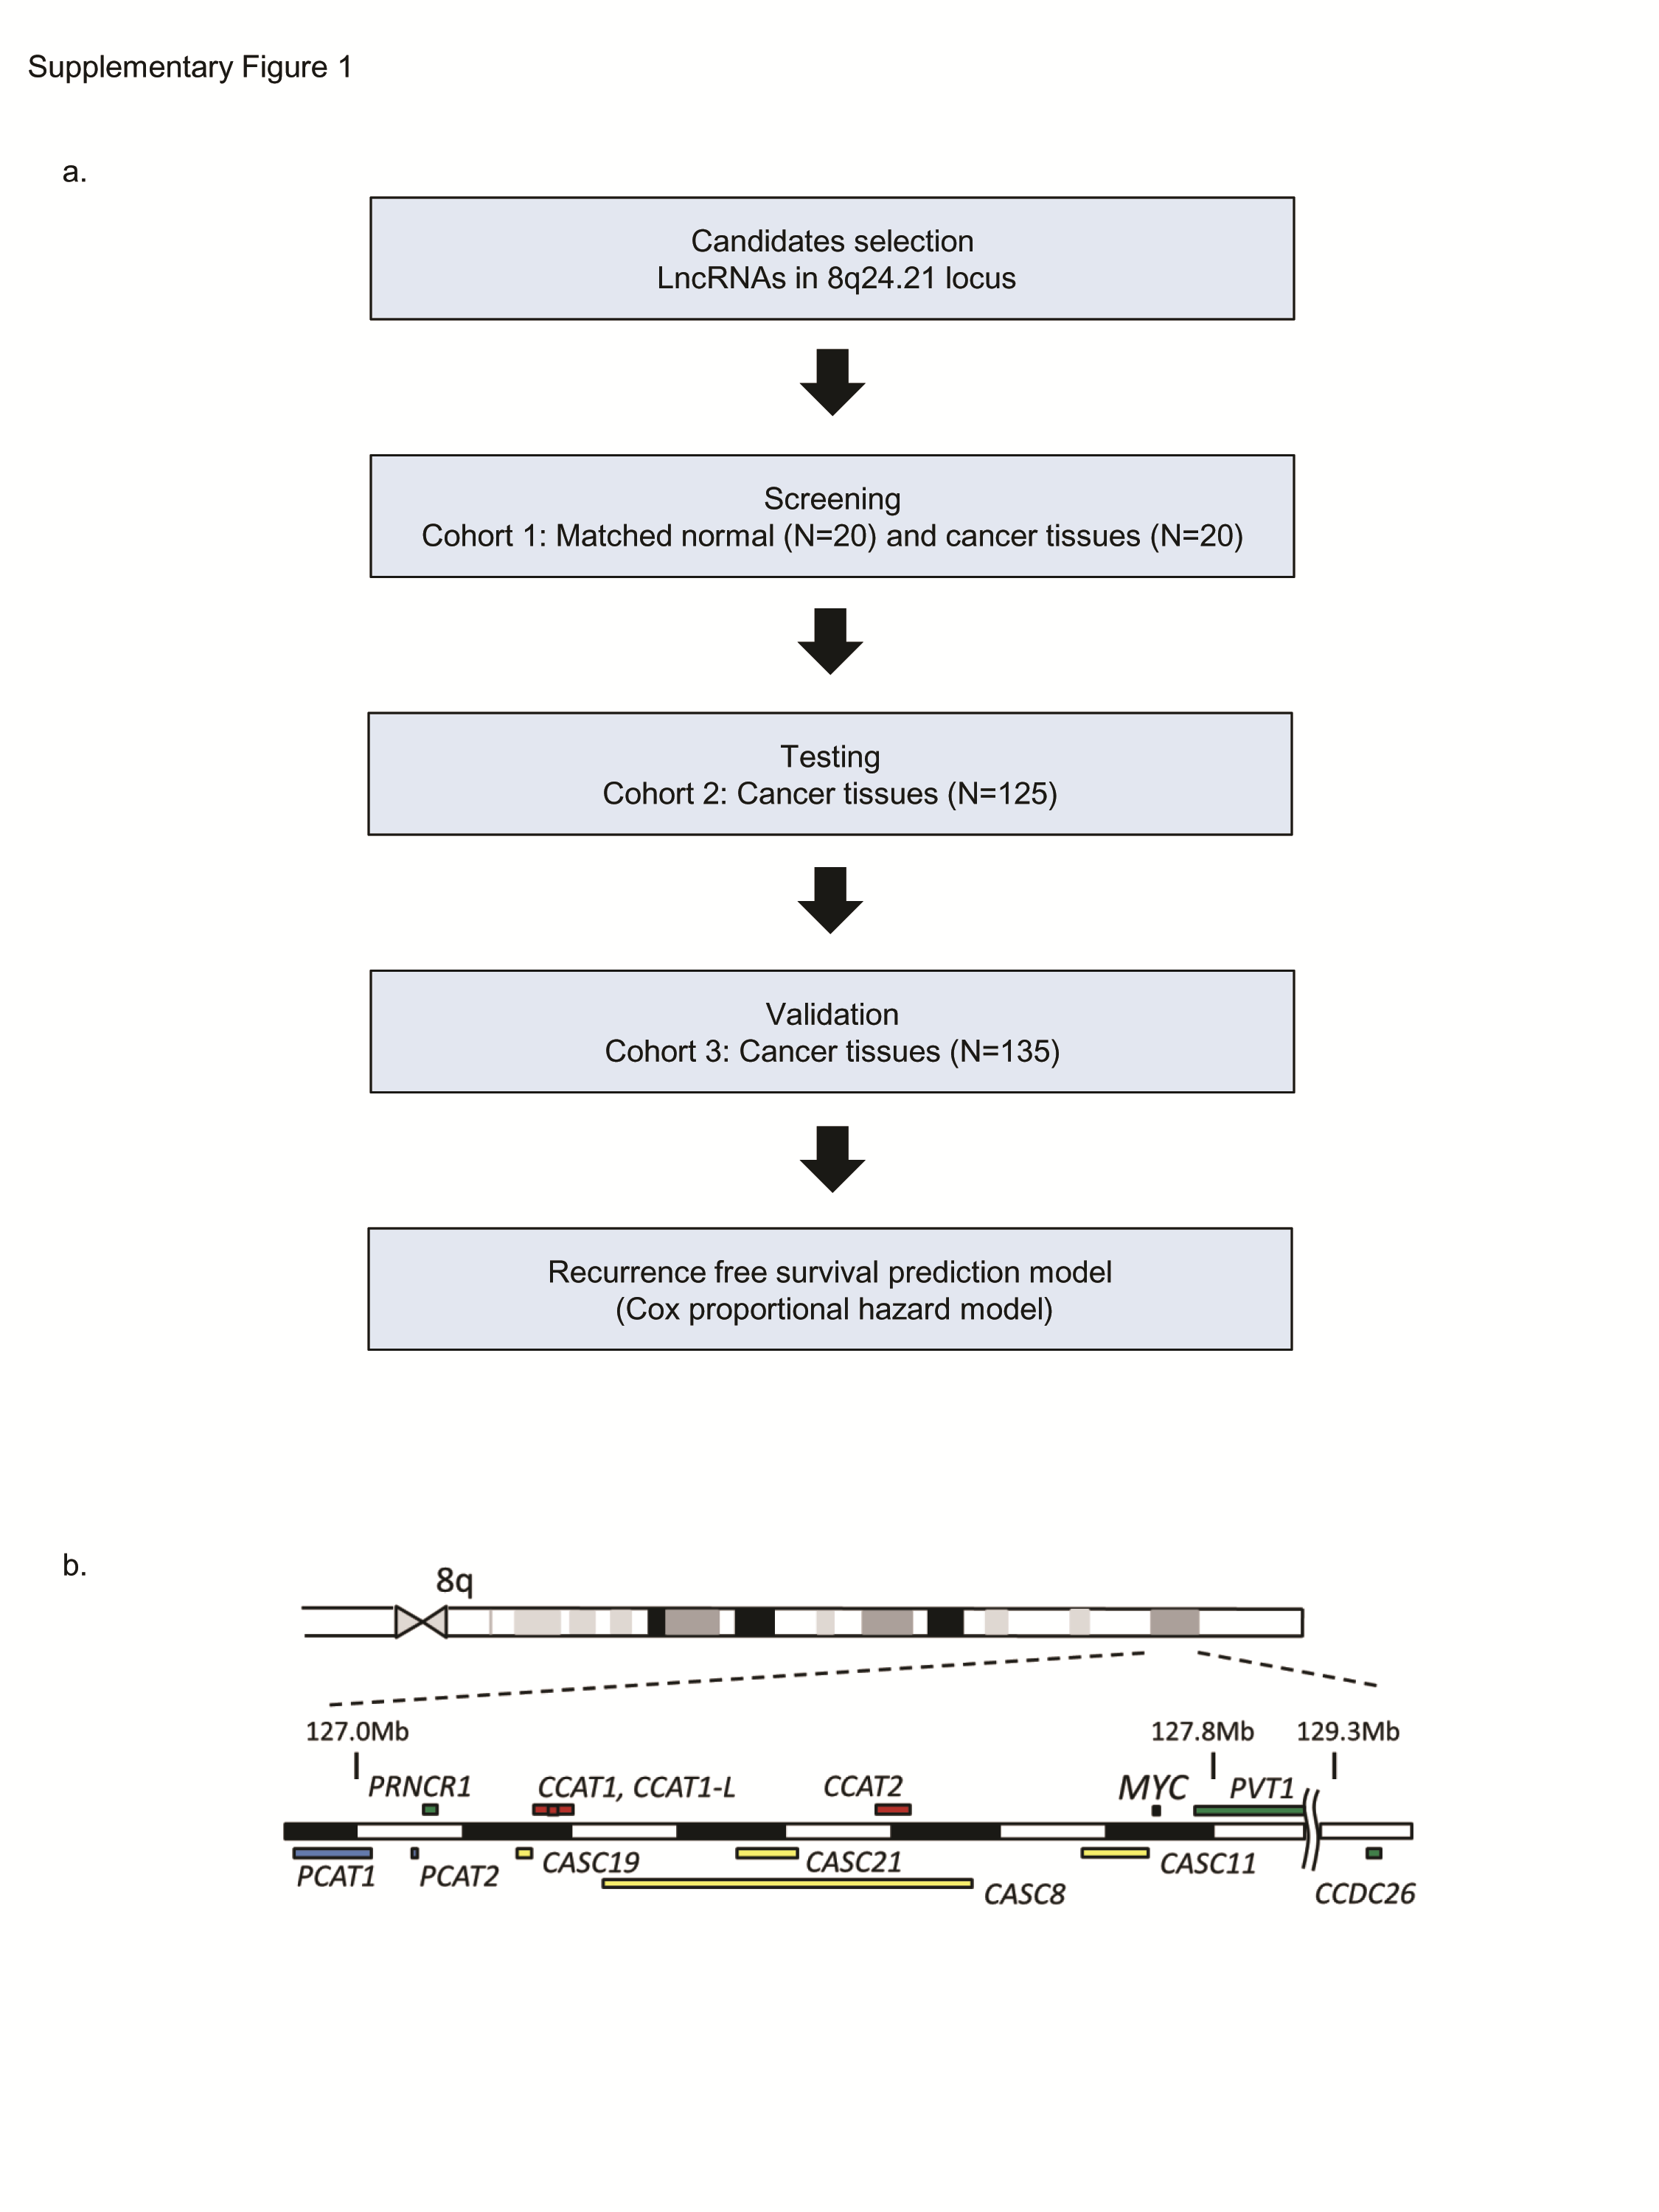
This study included analysis of a total of 300 fresh frozen tissue specimens, which encompassed 280 samples of primary colorectal adenocarcinoma and 20 matched corresponding normal mucosa tissues, collected from three institutes (Cohort 1; Mie University, Cohort 2; National Cancer Center Hospital, and Cohort 3; Tokyo Medical and Dental University). Patients who underwent resection of their primary tumor and were histologically confirmed to have a stage 0–IV CRC were included in this study. Details of the clinicopathological features of the patients involved in this study are shown in supplementary Table S1, available at Annals of Oncology online, and the flow chart of the present study is shown in supplementary Figure S1A, available at Annals of Oncology online.
Expression of lncRNAs using real-time quantitative reverse transcriptase polymerase chain reaction
Quantitative reverse transcriptase polymerase chain reaction (qRT-PCR) was carried out using SYBR Green (Thermo Fisher Scientific, Waltham, MA). Details are provided in supplementary Material and Methods, available at Annals of Oncology online, and the sequences of the primers used in this study are listed in supplementary Table S2, available at Annals of Oncology online.
Statistical analysis
Receiver operating characteristic (ROC) curves with Youden’s Index was established to determine optimal cut-off values for each lncRNA as it related to recurrence-free survival (RFS) and overall survival (OS). In multivariate analyses, a Cox proportional hazard model was used to identify clinical factors with a statistically significant influence on survival. Differences with a P value of <0.05 were considered statistically significant. We followed the criteria of Reporting recommendations for tumor MARKer prognostic studies (REMARK) [11]. Details are shown in supplementary Materials and Methods, available at Annals of Oncology online.
Results
The screening phase identified upregulation of specific lncRNAs in colorectal cancer
Twelve lncRNAs mapped to the 8q24.21 locus, which possess a HUGO Gene Nomenclature Committee (HGNC) symbol, and have previously been suggested to associate with cancer progression, were selected as candidates for initial screening (supplementary Figure S1B, available at Annals of Oncology online). We compared the expression level of each of the twelve lncRNAs in a Cohort 1, comprising of 20 matched CRCs and normal mucosa (supplementary Figure S2, available at Annals of Oncology online) [12–14]. Five of the twelve screened lncRNAs; CCAT1, CCAT1-L, CCAT2, pvt1 oncogene (PVT1), and cancer susceptibility candidate 19 (CASC19), were significantly up-regulated in cancer versus normal tissues (P = 0.037, <0.001, 0.017, <0.001, 0.002, respectively). The prostate cancer associated transcript 1 (PCAT1) was at or below the limit of detection in most patients, and no significant differences were observed for the other six lncRNAs. Based on these results, we selected the five significantly up-regulated lncRNAs (CCAT1, CCAT1-L, CCAT2, PVT1, and CASC19) for further evaluation.
The testing phase revealed that high expression of CCAT1, and CCAT2 was associated with poor recurrence free survival and overall survival in CRC patients
Next, during the testing phase, we examined the expression of CCAT1, CCAT1-L, CCAT2, PVT1, and CASC19 in 125 CRC tissue specimens from Cohort 2. CCAT1-L and CASC19 expression was undetectable in two patients and PVT1 in three cases. The expression levels of these five lncRNAs were analyzed in the context of various clinicopathological characteristics and prognosis of the patients. The detailed associations between clinicopathological characteristics and expression of each lncRNA are shown in supplementary Table S3, available at Annals of Oncology online.
We thereafter evaluated the prognostic significance of each lncRNA using the Kaplan–Meier analysis. High levels of CCAT1 and CCAT2 expression were significantly associated with poor RFS (P = 0.049 and 0.022, respectively), and poor OS (P = 0.028 and 0.015, respectively) (Figure 1A and B). Besides, high levels of CCAT1-L expression was significantly associated with poor RFS (P = 0.048). However, expression alterations in PVT1 and CASC19 did not demonstrate a significant association with tumor recurrence (P = 0.178 and 0.087, respectively) and patient survival (P = 0.113 and 0.290, respectively), as shown in supplementary Figure S3, available at Annals of Oncology online. Accordingly, CCAT1 and CCAT2 were selected as candidate lncRNAs for further validation and evaluation of their prognostic potential in another independent patient cohort.
Figure 1.

The testing and validation phase of this study. (A) CCAT1 expression and association with recurrence free survival (RFS) and overall survival (OS) in cohort 2. High CCAT1 expression was associated with poor RFS and poor OS (P = 0.049 and 0.028, respectively). (B) CCAT2 expression and association with RFS and OS in cohort 2. High CCAT2 expression was associated with poor RFS and poor OS (P = 0.022 and 0.015, respectively). (C) CCAT1 expression and association with RFS and OS in cohort 3. High CCAT1 expression was significantly associated with RFS and OS (P < 0.001 and 0.011, respectively). (D) CCAT2 expression and association with RFS and OS in cohort 3. High CCAT2 expression was significantly associated with RFS and OS (P = 0.010 and 0.025, respectively).
Prognostic significance of CCAT1 and CCAT2 lncRNAs was validated in an independent cohort of CRC patients
To further confirm and validate the prognostic significance of the two candidate lncRNAs, we analyzed another, large, independent cohort of 135 CRC tissues (Cohort 3). The high and low categorical expression cut-off thresholds were determined using Youden’s index. The associations between each lncRNA expression and clinicopathological features are shown in supplementary Table S4, available at Annals of Oncology online. RFS data was not available for one patient with stage III CRC and excluded from RFS analysis.
Next, we evaluated the association between expression of both lncRNAs with RFS and OS. Consistent with the findings in Cohort 2, high levels of CCAT1 and CCAT2 expression were significantly associated with poor RFS (P < 0.001 and 0.010, respectively) as well as poor OS (P = 0.011 and 0.025, respectively) as shown in Figure 1C and D.
CCAT1 and CCAT2 expression was an independent predictor of poor RFS and OS in CRC patients
We next carried out univariate and multivariate analyses using the Cox proportional hazard model in the validation cohort. The univariate analysis revealed that high CCAT1 expression (HR:3.88, 95%CI: 1.67–8.39, P = 0.003), and high CCAT2 expression (HR:2.55, 95%CI: 1.19–5.31, P = 0.017) were significantly associated with poor RFS, and OS as well (CCAT1 expression: HR: 4.06, 95%CI: 1.47–16.8, P = 0.004, CCAT2 expression: HR: 2.04, 95%CI: 1.05–3.84, P = 0.036, supplementary Table S5, available at Annals of Oncology online).
Interestingly, multivariate analysis revealed that the expression levels of CCAT1 (HR: 2.52, 95%CI: 1.07–5.56, P = 0.036) and CCAT2 (HR: 2.39, 95%CI: 1.10–5.08, P = 0.029) were independent factors for predicting poor RFS and poor OS (CCAT1: HR: 5.90, 95% CI: 2.09–24.7, P < 0.001 and CCAT2: HR: 2.40, 95% CI: 1.22–4.59, P = 0.011; Table 1). Taken together, we successfully validated the prognostic significance of both CCAT1 and CCAT2 expression as important prognostic biomarkers in multiple cohorts of CRC patients.
Table 1.
Multivariate analyses of RFS and OS using Cox proportional hazard model
| CCAT1 |
CCAT2 |
CCAT1 + CCAT2 |
|||||||
|---|---|---|---|---|---|---|---|---|---|
| Variables | HR | 95%CI | P-value | HR | 95%CI | P-value | HR | 95%CI | P-value |
| Multivariate analysis for RFS | |||||||||
| Age | 2.28 | 1.05–4.85 | 0.039 | 2.23 | 1.01–4.74 | 0.046 | 2.20 | 1.00–4.69 | 0.050 |
| ≥75/<75 (Years) | |||||||||
| Lymph node metastasis | 2.30 | 1.09–4.89 | 0.029 | 2.80 | 1.31–5.98 | 0.008 | 2.86 | 1.28–6.64 | 0.011 |
| Positive/Negative | |||||||||
| Preoperative serum CEA | 2.49 | 1.17–5.35 | 0.017 | 2.60 | 1.23–5.59 | 0.013 | 2.67 | 1.24–5.85 | 0.013 |
| ≥5/<5 (ng/ml) | |||||||||
| lncRNA expression | 2.52 | 1.07–5.56 | 0.036 | 2.39 | 1.10–5.08 | 0.029 | 2.60 | 1.04–6.06 | 0.042 |
| High/Low | |||||||||
| Multivariate analysis for OS | |||||||||
| Vascular invasion | 3.73 | 0.75–67.7 | 0.124 | 3.84 | 0.76–69.9 | 0.116 | 3.97 | 0.78–72.5 | 0.107 |
| Positive/Negative | |||||||||
| Lymph Node Metastasis | 0.65 | 0.25–2.22 | 0.447 | 0.66 | 0.25–2.26 | 0.469 | 0.60 | 0.22–2.06 | 0.375 |
| Positive/Negative | |||||||||
| Stage | 9.07 | 2.31–31.2 | 0.003 | 7.86 | 2.01–26.8 | 0.005 | 9.94 | 2.52–34.5 | 0.002 |
| III–IV/I–II | |||||||||
| Pre-operative serum CEA | 2.26 | 1.15–4.73 | 0.017 | 2.25 | 1.14–4.71 | 0.019 | 2.27 | 1.15–4.77 | 0.017 |
| ≥ 5/< 5 (ng/ml) | |||||||||
| LncRNA expression | 5.90 | 2.09–24.7 | <0.001 | 2.40 | 1.22–4.59 | 0.011 | 8.38 | 2.68–37.0 | <0.001 |
| High/Low | |||||||||
RFS, recurrence free survival; OS, overall survival; HR, hazard ratio; CI, confidence interval; CEA, carcinoembryonic antigen.
CCAT2 expression significantly correlated with microsatellite status in colorectal cancer
Microsatellite status was available for 72 stage II and III CRCs from cohort 3 (MSS: 68 and MSI: 4). CCAT2 expression was significantly higher in MSS CRCs, compared with MSI patients, although no statistically significant differences were observed in CCAT1 expression (P = 0.007 and 0.228, respectively; supplementary Figure S4, available at Annals of Oncology online).
CCAT1 and CCAT2 expression significantly correlated with MYC expression in colorectal cancer
Since there have been suggestions that lncRNAs mapped to the 8q24.21 locus may be associated with MYC, we evaluated the relationship between expression of CCAT1 and CCAT2 with MYC. We evaluated MYC expression by qRT-PCR in the Cohort 3. Both CCAT1 and CCAT2 expression were significantly correlated with MYC expression (r = 0.66, P < 0.001 and r = 0.74, P < 0.001, respectively; supplementary Figure S5, available at Annals of Oncology online), further supporting the functional and clinical relevance of our findings in colorectal cancer.
Combined expression of CCAT1 and CCAT2 was a superior predictor for RFS and OS in CRC patients
Due to correlative functional nature of CCAT1 and CCAT2, we were curious to examine associations for their combinatorial expression in predicting RFS and OS. In this regard, we categorized all patients into three groups; (i) with elevated expression of both CCAT1 and CCAT2, (ii) with elevated expression of either CCAT1 or CCAT2, and (iii) with low expression of both CCAT1 and CCAT2. By performing such analysis, we discovered that the patients that co-expressed high levels of CCAT1 and CCAT2 correlated with poorer RFS compared with other groups (P = 0.049 both high versus either high, P < 0.001 both high versus both low, respectively; Figure 2A). In the case of OS, the three groups were more spread out, such that both high versus either high (P = 0.038) and both high versus both low (P = 0.002) were significantly different from one another, and demonstrated that patients with high levels of both CCAT1 and CCAT2 had the worst OS. Furthermore, multivariate analysis by combining expression levels of both CCAT1 and CCAT2 revealed that the group of patients with high co-expression of CCAT1 and CCAT2 had higher hazard ratios for RFS (HR: 2.60, 95%CI: 1.04–6.06, P = 0.042) and also for OS (HR: 8.38, 95%CI: 2.68–37.0, P < 0.001) compared with the both low expression group (Table 1).
Figure 2.

Combination of CCAT1, CCAT2 expression and association with RFS, OS. (A) Survival curves plotting co-expression of CCAT1 and CCAT2 lncRNAs versus recurrence free survival (RFS) and overall survival (OS) in 135 patients with colorectal cancer. Patients whose tumors expressed high levels of both CCAT1 and CCAT2 had poorer RFS compared with those who express high levels of either CCAT1 or CCAT2 (P = 0.049) and those who express low levels of CCAT1 and CCAT2 lncRNAs (P < 0.001). OS showed the same trends, with patients expressing low levels of CCAT1 and CCAT2 having a better OS than those expression high levels of CCAT1 or CCAT2 (P = 0.038) and those with high levels of expression of both lncRNAs (P = 0.002). (B) Receiver operating characteristic analysis comparing the accuracy of predicting recurrence in 5 years for patients with stage I–III CRC. Expression of CCAT1, CCAT2, and several clinicopathological factors, and combination model of CCAT1, CCAT2, and CEA expression were investigated. Combination model showed the highest area under the curve (AUC) of 0.793. (C) The association of RFS with combination model of CCAT1, CCAT2, and CEA expression in tumor tissues from stage II and stage III colorectal cancer patients. High levels of combination model showed poorer RFS than those with low expression in both stage II and stage III patients (P = 0.034 and 0.001, respectively).
An RFS prediction model highlighted the prognostic potential of CCAT1 and CCAT2 in colorectal cancer
We constructed an RFS prediction model with various combinations of parameters including serum carcinoembryonic antigen (CEA) and the expression levels of CCAT1 and CCAT2 using the Cox proportional hazard model, in which the area under the curves (AUCs) for each variable were compared by constructing ROCs for 5 years’ recurrence in stage I–III CRC patients (Figure 2B). The combination of CCAT1, CCAT2, and CEA expression yielded the greatest AUC of 0.793 (95%CI: 0.687–0.876). Thereafter, we evaluated the RFS using this model in stage II and stage III CRC patients separately. This model efficiently distinguished RFS in both stage II and stage III CRC patients (P = 0.034 and 0.001, respectively, Figure 2C).
Discussion
In the present study, we for the first time have carried out a comprehensive investigation on the clinical significance of lncRNAs mapped to the 8q.24.21 locus ‘gene desert’, in CRC. We found that five of the 12 lncRNAs in this locus were upregulated in CRC, and among them, high expression of CCAT1 and CCAT2 significantly associated with poor RFS and OS in CRC patients, in two independent cohorts. A recent study revealed that the MYC enhancer region physically interacted with the CCAT1 promoter region and thereby regulated its expression [15]. In addition, Xiang et al. using chromosome conformation capture (3C) assays showed that CCAT1-L locus, which is the long-isoform of CCAT1 and overlaps with CCAT1, physically interacts with the rs6983267 SNP region and the MYC promoter region [13]. Furthermore, previous reports have shown that CCAT2, which is transcribed from one of the best-characterized enhancers of MYC, MYC-335 and encompasses the well-recognized rs6983267 SNP, regulated MYC expression by enhancing WNT activity through augmenting the TCF7L2 transcriptional activity [12, 16, 17]. Interestingly, mice lacking MYC-335 demonstrated resistance to the formation of intestinal tumors normally resulting as a consequence of the APCmin mutation [16]. These basic evidences are in support with our current findings for the correlative analyses of CCAT1 and CCAT2 expression with MYC in CRC tissues. In fact, our study herein, provides first clinical validation to the series of previously published basic functional studies suggesting that CCAT1 and CCAT2 play an essential role in CRC progression, which may in part be mediated through their interactions with MYC [18]. Other than interaction with MYC, McCeland et al. demonstrated that CCAT1 can be a target of bromodomain and extraterminal (BET) inhibitor, and considering that CCAT1 is highly associated with tumor recurrence, targeting this lncRNA by BET inhibitor may be a promising strategy to overcome tumor recurrence [19]. While, we evaluated the association between microsatellite status and CCAT1 and CCAT2 expression, in line with previous reports, CCAT2 expression was higher in MSS CRCs [12]. It is known that the prognosis of MSS CRCs is poorer; hence our results imply that CCAT2 might be a potential therapeutic target especially for patients with MSS CRC.
Following a potentially curative surgery, approximately 30% of CRC patients will often eventually develop metastases, in spite of adjuvant therapies [20]. Although adjuvant chemotherapy provides significant survival benefit in stage III patients, its clinical significance in stage II CRCs remains controversial. Recently, it was suggested that a subset of stage II CRC patients may benefit from adjuvant chemotherapy, but a priori identification of such patients remains a clinical challenge [21]. In this regard, in our present study, we have established an RFS prediction model by utilizing the expression levels of CCAT1 and CCAT2 with serum CEA. We demonstrated that this model predicted RFS not only in stage III CRC patients, but in stage II CRC patients as well. Hence, the prognostic biomarkers identified in our study, and our novel RFS prediction model may serve as an actionable approach for clinical decision-making for adjuvant therapy in stage II CRC patients.
We acknowledge that one of the limitations of our study is that it was retrospective in nature, and future large scale prospective studies may be needed to confirm our results. Nonetheless, the fact that we analyzed, multiple independent cohorts of patient tumor samples strengthens the validity of our findings.
In conclusion, several lncRNAs located in 8q24.21 are highly expressed in CRC and may be associated with carcinogenesis or tumor progression. Among these over-expressed lncRNAs, we identified that CCAT1 and CCAT2 are associated with tumor recurrence and poor prognoses, and evaluating the expression of these two lncRNAs may provide useful, actionable, biomarkers for predicting tumor recurrence or prognosis in CRC patients.
Funding
The present work was supported by the grants R01 CA72851, CA181572, CA184792, and CA202797 from the National Cancer Institute, National Institute of Health, a grant (RP140784) from the Cancer Prevention Research Institute of Texas (CPRIT), pilot grants from the Baylor Sammons Cancer Center and Foundation, as well as funds from the Baylor Research Institute.
Disclosure
The authors have declared no conflicts of interest.
Supplementary Material
References
- 1. Siegel RL, Miller KD, Jemal A.. Cancer statistics, 2016.a Cancer J Clin 2016; 66: 7–30. [DOI] [PubMed] [Google Scholar]
- 2. Duffy MJ. Carcinoembryonic antigen as a marker for colorectal cancer: is it clinically useful? Clin Chem 2001; 47: 624–630. [PubMed] [Google Scholar]
- 3. Aragane H, Sakakura C, Nakanishi M. et al. Chromosomal aberrations in colorectal cancers and liver metastases analyzed by comparative genomic hybridization. Int J Cancer 2001; 94: 623–629. [DOI] [PubMed] [Google Scholar]
- 4. Ghadimi BM, Grade M, Liersch T. et al. Gain of chromosome 8q23-24 is a predictive marker for lymph node positivity in colorectal cancer. Clin Cancer Res 2003; 9: 1808–1814. [PubMed] [Google Scholar]
- 5. Douglas EJ, Fiegler H, Rowan A. et al. Array comparative genomic hybridization analysis of colorectal cancer cell lines and primary carcinomas. Cancer Res 2004; 64: 4817–4825. [DOI] [PubMed] [Google Scholar]
- 6. Pomerantz MM, Ahmadiyeh N, Jia L. et al. The 8q24 cancer risk variant rs6983267 shows long-range interaction with MYC in colorectal cancer. Nat Genet 2009; 41: 882–884. [DOI] [PMC free article] [PubMed] [Google Scholar]
- 7. Grisanzio C, Freedman ML.. Chromosome 8q24-associated cancers and MYC. Genes Cancer 2010; 1: 555–559. [DOI] [PMC free article] [PubMed] [Google Scholar]
- 8. Ling H, Vincent K, Pichler M. et al. Junk DNA and the long non-coding RNA twist in cancer genetics. Oncogene 2015; 34: 5003–5011. [DOI] [PMC free article] [PubMed] [Google Scholar]
- 9. Lujambio A, Lowe SW.. The microcosmos of cancer. Nature 2012; 482: 347–355. [DOI] [PMC free article] [PubMed] [Google Scholar]
- 10. Gibb EA, Brown CJ, Lam WL.. The functional role of long non-coding RNA in human carcinomas. Mol Cancer 2011; 10: 38.. [DOI] [PMC free article] [PubMed] [Google Scholar]
- 11. McShane LM, Altman DG, Sauerbrei W. et al. REporting recommendations for tumor MARKer prognostic studies (REMARK). Nat Clin Prac Oncol 2005; 2: 416–422. [PubMed] [Google Scholar]
- 12. Ling H, Spizzo R, Atlasi Y. et al. CCAT2, a novel noncoding RNA mapping to 8q24, underlies metastatic progression and chromosomal instability in colon cancer. Genome Res 2013; 23: 1446–1461. [DOI] [PMC free article] [PubMed] [Google Scholar]
- 13. Xiang JF, Yin QF, Chen T. et al. Human colorectal cancer-specific CCAT1-L lncRNA regulates long-range chromatin interactions at the MYC locus. Cell Res 2014; 24: 513–531. [DOI] [PMC free article] [PubMed] [Google Scholar]
- 14. Takahashi Y, Sawada G, Kurashige J. et al. Amplification of PVT-1 is involved in poor prognosis via apoptosis inhibition in colorectal cancers. Br J Cancer 2014; 110: 164–171. [DOI] [PMC free article] [PubMed] [Google Scholar]
- 15. Kim T, Cui R, Jeon YJ. et al. Long-range interaction and correlation between MYC enhancer and oncogenic long noncoding RNA CARLo-5. Proc Natl Acad Sci USA 2014; 111: 4173–4178. [DOI] [PMC free article] [PubMed] [Google Scholar]
- 16. Sur IK, Hallikas O, Vaharautio A. et al. Mice lacking a Myc enhancer that includes human SNP rs6983267 are resistant to intestinal tumors. Science 2012; 338: 1360–1363. [DOI] [PubMed] [Google Scholar]
- 17. Tuupanen S, Yan J, Turunen M. et al. Characterization of the colorectal cancer-associated enhancer MYC-335 at 8q24: the role of rs67491583. Cancer Genet 2012; 205: 25–33. [DOI] [PMC free article] [PubMed] [Google Scholar]
- 18. Takatsuno Y, Mimori K, Yamamoto K. et al. The rs6983267 SNP is associated with MYC transcription efficiency, which promotes progression and worsens prognosis of colorectal cancer. Ann Surg Oncol 2013; 20: 1395–1402. [DOI] [PubMed] [Google Scholar]
- 19. McCleland ML, Mesh K, Lorenzana E. et al. CCAT1 is an enhancer-templated RNA that predicts BET sensitivity in colorectal cancer. J Clin Invest 2016; 126: 639–652. [DOI] [PMC free article] [PubMed] [Google Scholar]
- 20. Haller DG. An overview of adjuvant therapy for colorectal cancer. Eur J Cancer 1995; 31A: 1255–1263. [DOI] [PubMed] [Google Scholar]
- 21. O'Connor ES, Greenblatt DY, LoConte NK. et al. Adjuvant chemotherapy for stage II colon cancer with poor prognostic features. J Clin Oncol 2011; 29: 3381–3388. [DOI] [PMC free article] [PubMed] [Google Scholar]
Associated Data
This section collects any data citations, data availability statements, or supplementary materials included in this article.