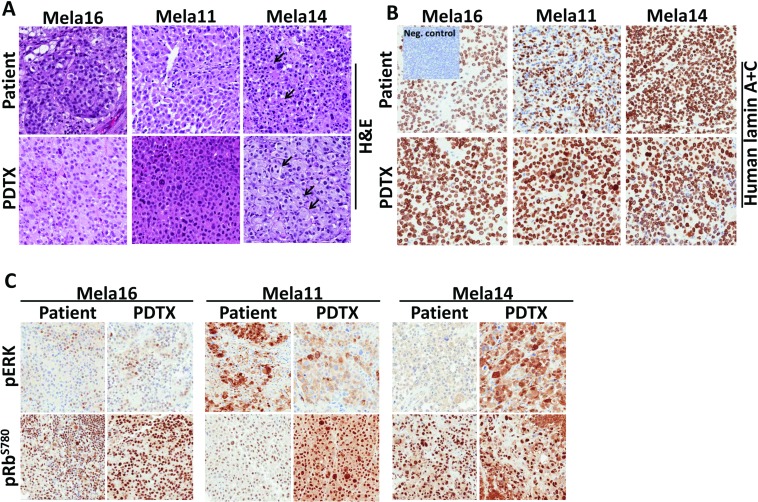
Figure 2. Phenotypic and genetic comparison showed PDTX matched parental patient tumor tissue.
(A)TMAs were constructed to compare and analyze similarities between patient and matched PDTX tumor tissues for tumor architecture via H&E stain, (B) human specificity via lamin A+C stain (non-stained cells shown in the patient Mela11 model are non-neoplastic lymphocytes), and (C) oncogenic proteins. a, Magnifications for all TMA images are 20×.

