

Abstract
In Part I of this paper, we detected elements blocked by ribs during simulated and in vivo transcostal liver scans, and we turned those elements OFF to compensate for the loss in visibility of liver vasculature. Here, we apply blocked-element detection and adaptive compensation to large synthetic-aperture (SA) data collected through rib samples ex vivo, in order to reduce near-field clutter and to recover lateral resolution. To construct large synthetic transmit and receive apertures, we collected the individual-channel signals from a fully sampled matrix array at multiple and known array locations across the tissue samples. The blocked elements in SAs were detected using the method presented in Part I and retroactively turned OFF, while the subapertures covering intercostal spaces were either compounded, or coherently summed using uniform and adaptive element-weighting schemes. Turning OFF the blocked elements reduced the reverberation clutter by 5 dB on average. Adaptive weighing of the nonblocked elements to rescale the attenuated spatial frequencies reduced sidelobe levels by up to 5 dB for the transcostal acquisitions, and demonstrated a potential to restore lateral resolution to the nonblocked levels. In addition, the arrival-time surfaces were reconstructed to estimate the aberration from intercostal spaces and to offer further means to compensate for the loss of focus quality in transthoracic imaging.
Index Terms: Blocked element compensation, ribs, large apertures, 2-D arrays, k-space, clutter, phase aberration
I. Introduction
The use of large apertures in medical ultrasound has the potential to improve image resolution and visibility of anechoic and hypoechoic targets at larger depths. However, when imaging through the ribs, or other highly reflective and/or attenuating structures, blocked elements and inhomogeneities can reduce the benefits of increased aperture size. Large apertures are more susceptible to partial blockage by such structures, and wavefront distortions and reverberation induced by intercostal soft tissues can make it difficult to preserve signal coherence across large array surfaces. Both mechanisms degrade the quality of transthoracic scans and diminish diagnostic benefits of increased aperture size.
In a companion paper, we described simulation and in vivo studies in which we imaged liver vasculature transcostally using a clinical 2-D array. We demonstrated a method to detect elements blocked by ribs, and we turned the blocked elements OFF to compensate for the resulting loss of vessel contrast and contrast to noise ratio (CNR). Here, we apply blocked-element detection to large synthetic-aperture (SA) data acquired through rib samples ex vivo, and we evaluate adaptive beam-forming methods aimed at recovering the loss of image quality.
Several methods have been proposed for alleviating beam degradation during high-intensity, focused ultrasound (HIFU) treatment through the ribs [1]–[6]. In the time-reversal mirror approach (or equivalently, the phase-conjugation method if a continuous wave is transmitted instead of pulsed beams) [1], [3], [4], signals from a point source located at the focus are recorded, time-reversed, and reemitted on each element. Alternatively, elements located in the geometric shadow of ribs are turned OFF while the remaining transmit (Tx) elements are uniformly weighted; this is referred to as a geometric approach [2], [4]. The time-reversal/phase-conjugation method accounts for diffraction effects and distributed tissue inhomogeneities, making it more effective than the geometric approach at reducing sidelobe levels (SLLs) at the focal plane and energy deposited on ribs. However, it requires the physical presence of a point source at the focus, or modeling wave propagation from a point source using CT or MRI data [1], [7], [8].
In an ex vivo experiment, Aubry et al. [1] applied the time-reversal mirror to focus a Tx beam behind a sample of porcine ribs. The correction resulted in a 5-dB decrease in sidelobes, while the ratio between the energy delivered at the target location to the total emitted energy increased six times. As a part of the same study, the geometric approach was simulated with qualitatively similar results, except the energy-increase at the target location was 13% lower than for the time-reversal mirror. Bobkova et al. [4] compared geometric and time-reversal-based compensation methods directly in simulation, for an idealized spherical radiator.1 Both approaches yielded approximately a twofold increase in intensity at the focus (compared with no compensation), while the time-reversal resulted in slightly less energy deposited on the ribs than the geometric approach (1% versus 7.5% of the total output power).
To improve the efficacy of a transcostal HIFU treatment, Ballard et al. [5] implemented adaptive focusing on a dual-mode (imaging plus therapy) array. Complex weights for the array elements were computed by solving a constrained optimization problem where the goal was to maximize the intensity at the target location and minimize the intensity across the ribs. Images obtained with the array were used to infer locations of the ribs and the target. Over six ex vivo acquisitions, the adaptive focusing scheme increased echogenicity (i.e., integrated backscatter value) of target relative to the echogenicity of rib by 7–20 dB, while the corresponding increase in temperature was by a factor ranging from 1.7 to 6.7.
An adaptive beamforming method for improving the quality of transthoracic images was developed by Li et al. [9]. They used the information from multiple receive beams and the total least-squares method to estimate and suppress the undesired sidelobe contributions in the presence of blocked elements. The approach by Li et al. [9] was effective in improving phantom images of point targets and distributed targets but the additional complexity of bimodal targets prevented its in vivo implementation.
In Part I of this paper, we presented a method to detect blocked elements and measured the resultant image degradation in in vivo studies. In the following, we apply the blocked-element detection and adaptive compensation to large SAs while imaging point targets through canine thoracic specimens with ribs ex vivo. Specifically, large synthetic Tx and receive (Rx) apertures spanning across multiple ribs are created by collecting the channel data from a fully sampled clinical matrix array at multiple, known array locations. To improve image quality, blocked elements are detected and retroactively turned OFF, while the apertures covering intercostal spaces are either compounded, or coherently summed using uniform and adaptive channel-weighting schemes. Clutter levels and point-spread functions (PSFs) are measured to evaluate the compensation methods, and to assess the effect of aperture size on image quality. As a tissue control, some of the beamforming schemes are also applied to SA data collected through a section of canine abdomen, in the absence of acoustic obstacles but with other sources of clutter. The arrival-time surfaces are reconstructed for all acquisitions to estimate the tissue-induced aberration, and to offer further means to compensate for the loss of focus quality in transthoracic imaging.
II. Methods
A. Large Coherent 2-D Aperture Acquisitions
Large coherent 2-D aperture data sets were created by collecting full synthetic data from a Siemens 4z1c matrix array (Siemens Medical Solutions USA, Inc.) at multiple and known array positions. This fully sampled 2-D array, which has also been used to collect the in vivo liver data in Part I, has a 1.92-by-1.44 cm aperture footprint, and its elements are grouped in square subapertures that are beamformed to result in 192 system channels. With the full synthetic sequence, signals were collected for each Tx/receive pair of channels. The array was connected to a modified Siemens Acuson SC2000 scanner (Siemens Medical Solutions USA, Inc., Mountain View, CA, USA) that has a 64:1 parallel-receive capability, which was used to increase acquisition rate of channel signals as described in [10].
The 4z1c array was positioned using a high-precision motorized translation stage setup that provided four degrees of freedom. Specifically, the setup consisted of three linear translation stages arranged orthogonally to one another (2 x Newport UTM100, 1 x Newport ILS100, Newport Corporation, Santa Clara, CA, USA), and of a rotation stage (Newport URS50) that allowed the transducer to be rotated around its elevation axis. The accuracy of the linear translation stages was better than 5 μm and their unidirectional repeatability was better than 1.5 μm. The rotation stage had a specified accuracy of 0.03° and a unidirectional repeatability of 0.002°, and provided a range of motion of 180°. By adjusting the angle of rotation around its elevation axis, the transducer could be mechanically steered to image the same region of interest from different lateral locations. The translation stage assembly was fixed on top of a 21″ × 10″ × 8″ acrylic water tank.
The full-SA data were collected at five lateral transducer positions spaced half-of-the-transducer length apart. At each position, the transducer was mechanically steered toward the region of interest. This ensured that Tx beams fired from individual elements at different array positions achieved maximum overlap necessary to synthesize high resolution images. Synthetic Tx/Rx data from different array positions were summed to increase the lateral extent of a 4z1c aperture (1.92 × 1.44 cm) and generate a large virtual aperture (5.76 × 1.44 cm). Throughout this paper, apertures spanning the physical transducer surface at each of the five locations are referred to as physical apertures. An aperture spanning all five overlapping transducer positions is referred to as a large SA. The geometry of the setup employed to collect large SA data is shown in schematics in Fig. 1.
Fig. 1.

Schematics of the setup used to acquire large SA data. Dashed lines indicate the look-direction for each of the five transducer positions. All look directions intersect at the point-target location, which is denoted with a red circle. Adjacent apertures overlap by half-of-the-aperture length, and the resulting SA is three times longer than an individual 4z1c aperture. Red and blue are used to distinguish between the adjacent apertures.
B. Ex Vivo Experiments
Using sequences and setup described in Section II-A, channel signals from the large coherent 2-D aperture were acquired from a custom-designed point-target phantom. The phantom consisted of a sapphire sphere 0.2 mm in diameter and suspended in a slab of gelatin. The phantom was imaged through freshly excised sections of canine chest wall and through a section of canine abdomen. For each acquisition, the tissue samples were placed directly underneath the array. The phantom and tissue were immersed in a tank filled with a 10:1 mixture of water and n-propanol that had a speed of sound of approximately 1540 m/s. 170 g of salt was added to 19 L of mixture to make it osmotically neutral and preserve the internal tissue structure. The exact amounts of water, alcohol, and salt used in the mixture were based on the models presented in [11]–[13]. For the transcostal acquisitions, the rib samples were oriented with respect to the direction of transducer translation so that the resulting large SAs-spanned multiple ribs. After each tissue acquisition, a control data set was acquired by imaging the phantom through a water–alcohol path only. All data were acquired using a Tx frequency of 2.5 MHz. A photo of the imaging setup taken during a transcostal acquisition is shown in Fig. 2.
Fig. 2.

Photograph of the experimental setup taken during a transcostal acquisition. The 4z1c array is fixed in a transducer holder and its position is controlled via translation stages (not captured in the photo). A section of canine chest wall containing skin, fat, ribs, and connective tissue is placed directly underneath the array. The point-target phantom is fixed to the bottom of the tank using rubber suction cups.
C. Blocked-Element Detection and Compensation
To detect blocked elements during the transcostal acquisitions, the method presented in Part I of this paper was extended to large-aperture data sets collected on the point targets. Specifically, the radio-frequency (RF) signals from large SAs were summed coherently across Tx channels to create focused Tx beams. The magnitude and the nearest-neighbor normalized cross correlation were then computed across the resulting synthetic receive apertures. A kernel of 1.2 mm (two wavelengths) was used to compute the nearest-neighbor normalized cross correlation. The two quantities were averaged over 3-mm depth around the axial location of the point target, and also between the overlapping parts of individual physical apertures. A relatively short axial averaging range (compared with the in vivo acquisitions in Part I) was sufficient to yield clean estimates of magnitude and cross correlation of point-target signals. A moving-average window, three-by-three channels in size, was applied to the resulting quantities across the large SAs to further reduce the noise. Channels with an average magnitude of −9 dB or less (with respect to the maximum channel amplitude on the synthetic receive aperture) were classified as blocked.
To assess the impact of aperture size and blocked-element compensation methods on image quality, B-mode images of point targets were beamformed using either all or a subset of channels from the large SA data sets. Specifically, for the transcostal acquisitions, the images were beamformed in four ways as follows:
by coherent summation of all channels (referred to as the full-SA method);
by applying uniform weighting and coherent summation to the nonblocked channels only (SA with basic compensation);
by applying adaptive weighting, phase-aberration correction, and coherent summation to the nonblocked Tx/Rx channel pairs (i.e., SA with adaptive compensation);
by compounding (i.e., summing the envelope-detected signals) of the nonblocked intercostal subapertures.
In particular, for the adaptive blocked-element compensation, phase-aberration correction was applied along with rescaling of the available Tx/Rx channel pairs to recover the attenuated spatial frequencies. The phase aberration correction method is described in Section II-D, while the adaptive reweighting scheme is presented in greater detail in Section II-E.
The PSFs created from the abdominal acquisition were used to assess the performance of the beamforming methods under aberrated, but unblocked imaging conditions. Due to the lack of blocked elements, only beamforming methods 1 and 4 were applied to the channel data. In 4, the subapertures used for compounding had shape of the intercostal subapertures with the adjacent blocked elements included from the first transcostal acquisition. For each tissue image, a matching control image was also created using the same subsets of channels from the corresponding water-path acquisitions. Image quality was characterized by full-width at half-maximum (FWHM) and SLLs of the PSFs, and by average clutter levels in the near field.
D. Arrival-Time Estimates
The large SA data sets collected on point targets through the ribs and abdomen were also used to estimate the shape and magnitude of the respective tissue-induced aberrations. The arrival-time profiles were estimated from the channel data using a least-squares method.
In the first step, focal delays were applied to the individual-channel signals to correct for geometric path-length differences in the direction of the point target. Each signal associated with a pair of Tx and receive channels could then be modeled as a delayed version of the transmitted waveform ψ, and corrupted with some additive noise
| (1) |
In (1), the signal stx,rx is in its time-continuous form, δtx,rx is a tissue-induced delay associated with the pair of Tx and receive channels, and εchan accounts for random-noise due to channel electronics and reverberation.
To find delays δtx,rx, the discrete channel signals were cross-correlated with an estimate of the transmitted waveform ψ̂ that was obtained by beamforming the point target from the control experiment. The channel signals stx,rx were temporally weighted by a decaying exponential centered around the estimated point-target depth in order to prevent peak-hoping and to improve the accuracy of arrival-time estimates. The time constant was chosen to be half of the period at center Tx frequency, or 200 ns. Based on the previous measurements [14], [15], tissue-induced aberrations rarely reach values higher than 200 ns.
A three-by-three-channel moving-average window was also applied across the synthetic Tx aperture to reduce the channel noise and improve cross-correlation estimates. For each signal, the delay δtx,rx was then estimated as the time-lag corresponding to the maximum cross-correlation value.
The measured signal delays can be expressed in terms of individual delays on Tx and receive channels
| (2) |
In (2), Δttx and Δtrx are the tissue-induced delays on associated Tx and Rx channels that need to be estimated, and εd is a random delay error caused by noise in the cross-correlation estimate. The equations for all Tx/Rx channel pairs can be written in the matrix form as
| (3) |
where each row of model matrix M encodes a Tx/Rx channel pair, N is the number of Tx (or Rx2) channels in the array, vectors d and ε contain all measured signal delays and associated errors, respectively, and vector Δt contains tissue-induced delays for each channel. The vector Δt was estimated via the least-squares solution
| (4) |
The (3) and (4) were applied at each of the five physical-aperture positions using the same reference waveform ψ̂. For the transcostal acquisition, blocked channels were excluded from the arrival-time estimates. Arrival time estimates were also obtained for wavefronts propagating through a water/alcohol path only. These control estimates were subtracted from the tissue estimates to obtain true aberrator profiles.
E. Adaptive Reweighting of K-Space
To adaptively compensate for the blocked channels, the remaining Tx/Rx channel pairs were weighted to recover attenuated k-space frequencies (in the focal plane) and reduce associated sidelobes in the PSF. The weights were determined following the convolution model of k-space outlined by Walker and Trahey [16]: the spatial-frequency response of an imaging system to a point target located at the focus or in far field can be modeled as convolution of the system’s Tx and Rx aperture functions.
In particular, if the transducer elements are assumed to be infinitesimal, for a single pair of Tx and Rx channels, the corresponding aperture functions and the resulting k-space response of the system can be written as
| (5a) |
| (5b) |
| (5c) |
| (5d) |
where x1 denotes a coordinate in the aperture plane, and x1,tx and x1,rx are particular locations of the Tx and Rx channels in the aperture, respectively. W is the weighting constant that accounts for the sensitivity of the channels and target reflectivity, kx is the spatial frequency of interest in the focal plane (or in the far-field), and * is the convolution operator.
The k-space response of a multichannel system can be described as a sum of responses from the individual Tx/Rx channel pairs
| (6) |
where Stx,rx is rewritten as a function of sum of positions of Tx and Rx channels in the aperture, l, and kx = −l fc/2zf where fc is the center Tx frequency and zf is the focal depth. If the weighting constant W is assumed to be the same across the aperture, then the total system response Stotal(kx ) is proportional to the number of available Tx/Rx channel pairs at frequency kx . In a case of a missing (blocked) Tx/Rx channel pair, the lack of its k-space response can be compensated by rescaling the remaining channel-pair responses (at that frequency). In particular, the rescaling factor at the spatial frequency kx is computed as
| (7) |
where Savailable(kx ) and Stotal(kx ) are the k-space responses of the apertures with and without blocked channels, respectively.
To determine the individual-channel-pair weights specific to the data-acquisition setup described in Section II-A, the k-space response of the large SA was reconstructed from the individual physical apertures by utilizing the shifting property of convolution [17]. First, blocked channels were detected following the procedure outlined in Section II-C. The blocked-channel maps for the individual apertures, which were created from the positions of blocked channels in the large SA, were then autoconvolved and their respective k-space responses were shifted according to
| (8) |
As stated in Section II-A, the shift amount Δx1 in (8) was incremented by half-of-the-transducer length. The shifted k-space responses of the individual apertures were summed together to synthesize a large-aperture k-space response. The rescaling factor was determined at each spatial frequency of this response via (7), and was used to weight the RF signals of the corresponding Tx/Rx channel pairs. To ensure that the rescaled channel pairs were added in-phase and could recover attenuated frequencies, the arrival-time profiles estimated in Section II-D for the transcostal acquisition were applied to the nonblocked channels prior to summation.
III. Results
A. Aperture-Domain Signals
Fig. 3 shows channel amplitude and the nearest-neighbor-normalized cross correlation for sample point-target acquisitions through the excised sections of canine ribs, abdomen, and for a control (point target) acquisition through a water path. Channel amplitude is displayed on the decibel scale with the dynamic range adjusted to indicate the presence of blocked elements. Cross correlation is displayed using a linear color-map with the dynamic range from 0 to 1.
Fig. 3.

Amplitude (top row) and the nearest-neighbor normalized cross correlation (bottom row) of the channel signals received across large synthetic 2-D apertures during (a) ex vivo transcostal acquisition, (b) abdominal acquisition, and (c) control acquisition. For all acquisitions, the channel amplitude is displayed on the decibel scale from −11 to 0, while cross correlation is displayed using a linear color-map with the dynamic range from 0 to 1. For the transcostal acquisition, regions of low values are attributed to ribs blocking those parts of the aperture. The shape of the blocked regions matches between the amplitude and cross-correlation images. For the control acquisition, amplitude and cross correlation display high values throughout the extent of the aperture, indicating that echoes have been received on all channels without significant obstruction. For the abdominal acquisition, there is a slight loss of channel amplitude/cross correlation on the left side of the SA, potentially caused by a piece of connective tissue or tissue with high attenuation.
Two dark regions span the elevation dimension in the amplitude and cross-correlation images created from the transcostal acquisition; they are attributed to two ribs blocking corresponding parts of the SA. The shape of the blocked regions is closely matched between the two images. Signal amplitude in the blocked regions is on average 8-dB lower than the amplitude recorded on the remainder of the virtual array. Overall, the amplitude and cross-correlation images created from the control and abdominal acquisitions display a significantly higher degree of uniformity than their transcostal counterparts. The lack of low values throughout the extent of the apertures implies that, in both the cases, echoes have been received on all channels without significant obstruction. Only a slight decrease in amplitude/cross correlation, possibly due to a piece of connective tissue or tissue with high attenuation, can be observed on the left side of SA for the abdominal data set.
The binary aperture map created by thresholding the channel amplitudes for the transcostal acquisition in Fig. 3 is shown in Fig. 4(a). Channels with an average amplitude of −9 dB or less (with respect to the maximum channel amplitude on the synthetic 2-D aperture) are classified as blocked and are indicated in black. The chosen amplitude cutoff confines the blocked channels to two regions that are observed in the corresponding amplitude and cross-correlation images (Fig. 3) and which, combined, occupy about a third of the total SA.
Fig. 4.

(a) Binary aperture map obtained by thresholding the channel amplitudes for the transcostal acquisition in Fig. 3. (b) Representation of the binary map in k-space. (c) K-space response of the binary map after rescaling of the available Tx/Rx channel pairs to approximate the desired k-space response. (d) The desired k-space response, created in the absence of blocked channels. In the binary aperture map, black is used to indicate positions of blocked channels. In (b) through (d), the spatial frequencies along x- and y-axes are expressed as shift indices associated with the auto-convolution of the 2-D apertures. At some spatial frequencies in (b), all corresponding Tx/Rx channel pairs are blocked, leaving holes in k-space after rescaling. All k-space images are normalized by the maximum of the desired response in (d), and are displayed on a linear scale from 0 to 1.
The binary aperture map in Fig. 4(a) was used to create the uncompensated and compensated k-space responses in Fig. 4(b) and (c), respectively. The k-space response of the equivalent SA without blocked channels is shown in Fig. 4(d). In all spectra, the spatial-frequency axes are expressed in terms of shift indices associated with autoconvolution of the large 2-D aperture. All images are normalized by the maximum of the desired response in Fig. 4(d), and are displayed using a linear color-map from 0 to 1. The elevation k-space response in Fig. 4(d) equals to the elevation response of a single 4z1c transducer, which is a triangle function. Assuming a linear system, the desired k-space response in the lateral dimensions is a sum of k-space responses of shifted, individual 4z1c transducers, and therefore has the shape of a trapezoid. In Fig. 4(b), due to the presence of blocked channels, large regions of k-space experience significant attenuation compared with the desired spectrum. The k-space response in Fig. 4(c) is obtained after rescaling of the available Tx/Rx channel pairs in Fig. 4(b) in order to approximate the desired response in Fig. 4(d). Due to the extended regions of blockage, at some spatial frequencies, there are no available redundant Tx/Rx channel pairs, and the holes in k-space remain.
B. Arrival-Time Profiles
Examples of arrival-time estimates for the wavefronts originating from a point target and propagating through the excised sections of ribs, abdomen, and water-path only are shown in Fig. 5. The estimates are obtained across large SAs and from the same acquisitions used to create the images of channel data and the B-mode images in Sections III-A and III-C, respectively. For each acquisition, the synthetic receive aperture is composed of five overlapping physical-aperture positions and it spans 48 channels in the lateral dimension and 12 channels in the elevation dimension. The color of the arrival-time surface is mapped to the surface height with low negative values colored in dark blue and high positive values colored in bright red.
Fig. 5.

Two-dimensional arrival-time profiles from a point target estimated with large SAs during a transcostal acquisition (top), an abdominal acquisition (middle), and a control acquisition (bottom). For all acquisitions, the SA is composed of five overlapping physical-aperture positions, and it spans 57 mm in lateral and 14 mm in elevation dimension. Color of the arrival-time surfaces corresponds to the surface height with low negative values colored in dark blue and high positive values colored in bright red. The colorbar in the bottom plot shows the dynamic range used for all surfaces. x- and y-axes are in units of aperture channel numbers, while z-axis is expressed in seconds. For the transcostal acquisition, blocked channels (as indicated in the binary map in Fig. 4) are excluded from the arrival-time estimates resulting in surface discontinuities. Arrival-time estimates on the remaining channels indicate that aberrations due to the intercostal spaces are dominated by low spatial-frequency components and are more severe than aberrations induced by the abdominal wall. For all acquisitions, there is strong agreement between the arrival-time estimates from the overlapping individual-aperture positions.
For the transcostal acquisition [Fig. 5 (top)], the blocked channels are omitted from the arrival-time profile following the binary map in Fig. 4(a). The arrival-time surface over the intercostal spaces indicates a high-magnitude, low-frequency aberrator. The estimated aberrator for the abdominal wall [Fig. 5 (middle)] is of lower magnitude than its intercostal counterpart, except for the peak-estimate on the left side of synthetic array. Wavefront distortions due to propagation through the water path are minimal as seen in the control profile [Fig. 5 (bottom)]. The root-mean-square (rms) values of displayed arrival-time profiles are computed to be 58 ns for the transcostal acquisition, 24.8 ns for the abdominal acquisition, and 10.8 ns for the control acquisition at the Tx frequency of 2.5 MHz. For all acquisitions, there is a strong agreement between the arrival-time estimates from the overlapping aperture positions.
C. Compensated B-Mode Images
Examples of B-mode images of point targets reconstructed from the large SA data are shown together with the corresponding plots of near-field clutter magnitude in Figs. 6 through 11. The images and plots are created from the same transcostal and abdominal acquisitions as the images of channel amplitude and cross correlation in Fig. 3. All B-mode images are reconstructed in the plane of transducer motion, along the lateral dimension at zero elevation coordinate (i.e., middle lateral slices), and are displayed with 50-dB dynamic range. In general, the elevation dimension of a matrix array allows for control of slice thickness, and the blocked-element compensation along the elevation dimension can have a significant impact on 2-D B-mode image quality. For the presented transcostal acquisitions, the elevation dimension of the synthetic array is parallel to ribs, so the blocked-element compensation is not expected to significantly affect the PSFs in this dimension.
Fig. 6.

B-mode images of point targets created with and without different blocked-element compensation schemes applied to the channel data from the transcostal (top) and control acquisitions (bottom). To beamform compensated images, the blocked channels are selectively turned OFF in both Tx and Rx apertures following the maps in Fig. 4. For the control acquisition, point-target images are beamformed using the same methods and subsets of channels as for the transcostal acquisition. The PSFs created from the transcostal acquisition show higher sidelobes and are wider than their control counterparts. For the transcostal acquisition, turning OFF the blocked channels does not significantly alter the shape of the SA PSF. For both data sets, adaptive blocked-element compensation significantly reduces sidelobes induced by aperture sparsity. Compounding also reduces sidelobes but at the expense of increased main lobe width for both acquisitions. All images are displayed with 50-dB dynamic range.
Fig. 11.
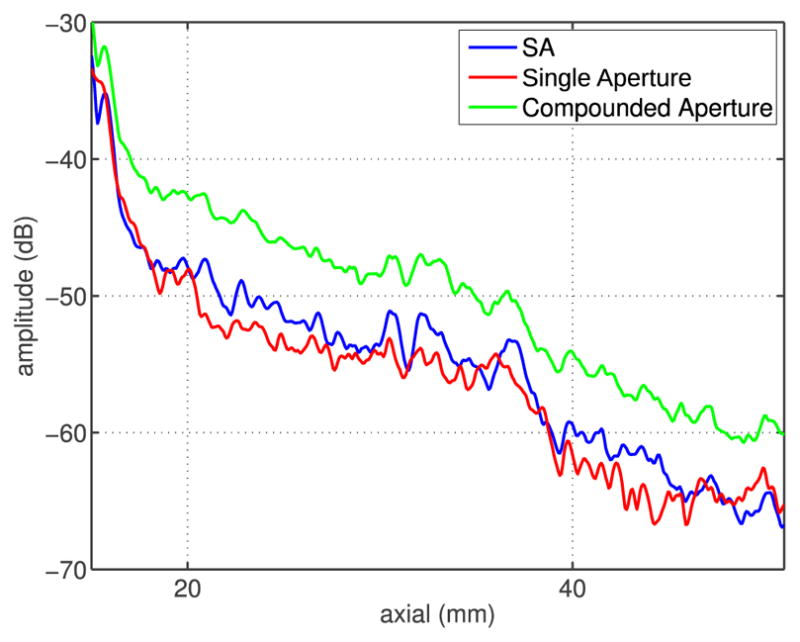
Average clutter magnitude measured as a function of imaging depth for the ex vivo abdominal acquisition. The compounded image yields the highest level of clutter. Relative clutter levels measured in the full syntethic aperture image are almost the same as those in the middle-aperture image. For all beamforming methods, the clutter magnitude is monotonically decreasing and does not exceed −30 dB.
Point-target images created from the transcostal acquisition and its corresponding control are presented in Fig. 6. From left to right, the images from the transcostal acquisition are created as outlined in Section II-C. For all compensation methods, the blocked channels are identified and turned OFF following the maps in Fig. 4(a). For the adaptive compensation method, phase-aberration correction is implemented using the arrival-time profile in Fig. 5 (top). The control images (in Fig. 6) are beamformed using the same methods and subsets of channels as their corresponding transcostal images, but from the SA data acquired through a water-path only. Because the large aperture was synthesized from five partially overlapping individual apertures (rather than using a single, fully sampled array of equivalent size), the lateral k-space response of the imaging system has the shape of a trapezoid and the SLLs for the control acquisition are expected at about −16 dB. To facilitate comparison of the PSFs across beamforming methods and aperture sizes, the corresponding beamplots at the point-target depth are presented in Fig. 7. The values of the FWHM and SLL are reported for all PSFs in Table I.
Fig. 7.

Beamplots created from the 2-D PSFs in Fig. 6, for the transcostal acquisition (left) and for the corresponding control acquisition (right). For the transcostal acquisition, the SA beamplots created with and without blocked channels look almost identical if uniform weighting is applied. Sidelobes of these beamplots are higher than −6 dB and their effective width is comparable to the width of the corresponding single-aperture and compounded beamplots. For the control acquisition, turning OFF channels without compensation raises sidelobes to −6.3 dB. For both data sets, adaptive compensation effectively reduces SLLs caused by aperture sparsity.
TABLE I.
Assessment of PSFs Across Beamforming Schemes and Aperture Sizes, for the Large SA Data Collected Through the Samples of Ribs, Abdomen, and in Their Corresponding Control Acquisitions (Denoted With t, a, and c, Respectively). For Each Acquisition, the PSFs Are Created via the SA Method, via SA With the Blocked Channels Turned off (SA With Basic Compensation or SABC), via Adaptively Weighing the Nonblocked Tx/Rx Channel Pairs (SA With Adaptive Compensation or SAAC), From the Middle Part of the Large Synthetic Array (Abbreviated as Single), and by Compounding (Abbreviated as Comp)
| Acquisition number | FWHM(mm) | SLL (dB) | ||||||||
|---|---|---|---|---|---|---|---|---|---|---|
|
|
||||||||||
| SA | SABC | SAAC | Single | Comp | SA | SABC | SAAC | Single | Comp | |
| t1 | 4.41 | 4.32 | 0.71 | 5.65 | 4.66 | −2.50 | −2.50 | −7.00 | −15.80 | −18.30 |
| c1a | 0.71 | 0.71 | 0.69 | 2.79 | 2.71 | −17.60 | −6.30 | −18.90 | −27.00 | −30.40 |
| t2 | 3.25 | 3.16 | 1.82 | 4.71 | 2.8 | −1.90 | −1.90 | −5.00 | −16.80 | −21.70 |
| c2a,b | 0.57 | 1.07 | 0.58 | 1.76 | 1.92 | −15.60 | −6.60 | −12.00 | −38.00 | −41.00 |
| a1 | 0.67 | \ | \ | 1.81 | 1.65 | −21.00 | \ | \ | −20.00 | −16.60 |
| c3b | 0.54 | \ | \ | 1.80 | 1.40 | −15.60 | \ | \ | −20.00 | −17.30 |
For the control acquisitions c1 and c2, point targets are not imaged at the same depth due to different geometries of the tissue samples in the corresponding transcostal acquisitions (t1 and t2). For each pair of tissue/control acquisitions, imaging depth is the same.
The PSFs under c2 and c3 acquisitions are reconstructed from the same control data but using different subsets of channels. For SABC, SAAC, and compounded PSFs from the c2 acquisition channels are selectively turned off to create subapertures that match the intercostal spaces of the corresponding transcostal (t2) acquisition. Since the abdominal (a1) acquisition does not suffer from blocked channels, no channels are turned off for the control PSFs under c3 acquisition.
The PSFs created from the transcostal acquisition show significantly higher SLLs and larger effective FWHM than their control counterparts. In particular, for the transcostal full-SA PSF, SLL increases by 15.1 dB and FWHM increases by a factor of 6.2 compared with the control PSF. Such a large increase in the effective width of the full-SA PSF is due to high sidelobes in the transcostal image. As indicated in the corresponding beamplot (Fig. 7), SLL is higher than −6 dB, which causes the effective width of the function to significantly exceed the width of its main lobe. When the uniform channel-weighting is applied to the transcostal data, the SA images created with and without blocked channels look almost identical [Fig. 6 (top row) and Fig. 7 (left)]. When the same channels are turned OFF for the control acquisition, SLL rises by 11.3 dB [Fig. 7 (right)], which indicates that aperture sparsity is the main mechanism of the PSF degradation in the presence of blocked elements. For both data sets, the adaptive compensation (i.e., phase-aberration correction in combination with k-space rescaling) significantly reduces SLL induced by aperture sparsity, from −6.3 to −18.9 dB for the control acquisition, and from −2.5 to −7 dB for the transcostal acquisition.
For the transcostal acquisition, the PSFs created from the second intercostal subaperture and from the SAs with uniform weights applied have similar effective FWHM, meaning that without adaptive compensation, the −6-dB lateral resolution does not improve with aperture growth across the ribs. For the control acquisition, the full SA PSF is 3.8 times narrower than the middle subaperture PSF.
Point-target images reconstructed from the SA acquisition through the sample of abdominal wall and from the matching control acquisition are shown in Fig. 8. For both acquisitions, the images are reconstructed from left to right, by summing all channel signals coherently (SA image), by summing signals from the middle part of the SA only (single-aperture image), and by compounding. The shape of subapertures used to create the single-aperture and compounded images matches the intercostal spaces, plus the adjacent blocked channels, from the first transcostal acquisition. This allows for a direct comparison between the point-target images generated from the abdominal and transcostal acquisitions. The corresponding beamplots are shown in Fig. 9.
Fig. 8.

Point-target images created using different subsets of channels from a large SA data set collected through the abdominal wall ex vivo (top) and from the data collected in the corresponding control acquisition (bottom). The images reconstructed from the abdominal acquisition display slightly higher SLLs than the corresponding control images. For both acquisitions, the middle (sub)aperture and compounded images show increased main lobe width compared with the full-SA images. All images are displayed with 50-dB dynamic range.
Fig. 9.

Beamplots created from the 2-D PSFs in Fig. 8, for the abdominal acquisition (left) and for its corresponding control acquisition (right). While beamplots created from the abdominal acquisition appear asymmetric and distorted compared with their control counterparts, the main lobe width and the SLLs do not change significantly between the two acquisitions. For both acquisitions, the compounded and single-aperture beamplots have similar main lobe width; the beamwidth is the smallest for the SA plots.
The PSFs created from the abdominal acquisition show small changes compared with their matching control images; SLL changes are within 5 dB while the main lobe width increases at most by a factor of 1.2. For both acquisitions, the main lobe is the narrowest in the SA image while the single-aperture and compounded images display a similar main lobe width. The main lobe width from the single-aperture image decreases by a factor of 3.4 for the control acquisition and by a factor of 2.7 for the abdominal acquisition when the SA is used.
The FWHM and SLL of the PSFs in Figs. 6 and 8 are reported in Table I, along with the PSFs created from the second transcostal acquisition and its corresponding control. Due to different tissue-sample geometries, the point targets were not imaged at the same depth, so the reported FWHM values cannot be compared directly across the tissue acquisitions. Nevertheless, a strong agreement can be observed between the two transcostal acquisitions regarding the trends across the beamforming methods. All transcostal PSFs, except for the SA PSF created with adaptive compensation, are significantly wider than their control counterparts. Furthermore, the noncompensated PSFs are almost of the same width as the PSFs formed using basic blocked-element compensation, while the adaptive compensation decreases the effective PSF-width closer to the nonblocked levels. The PSFs created from the abdominal acquisition are only slightly wider than the corresponding control PSFs, and show significantly lower SLL compared with their transcostal counterparts.
The average magnitude of clutter caused by propagation through the samples of chest wall and abdomen is plotted as a function of depth in Figs. 10 and 11, respectively. The clutter levels are measured from the same acquisitions used to create the PSFs in Figs. 6 (top row) and 8 (top row), except the measurements are taken over the range of depths between the tissue sample and the point target, where the wavefront propagates through the water/alcohol mixture only. The signal magnitude over this region is averaged along the lateral dimension. All plots are normalized by the maxima of the corresponding PSFs and are displayed on the decibel scale.
Fig. 10.

Average magnitude of image clutter measured as a function of depth for the transcostal acquisition and compensation methods used to create the PSFs in Figs. 6 and 7. In all plots, clutter magnitude decreases with depth. Turning blocked channels OFF suppresses clutter, with coherent summation of the remaining channels yielding less clutter than compounding of the intercostal subapertures. Basic and adaptive compensation schemes result in similar levels of clutter.
In all the cases, clutter levels decrease with depth. For the transcostal acquisition (Fig. 10), the average clutter magnitude in the uncompensated image decreases from −17 dB at 25-mm depth to −35 dB at 70-mm depth. When the blocked elements are turned OFF and the remaining elements are coherently summed (i.e., the basic compensation and adaptive compensation methods), clutter is reduced by about 5 dB compared with the uncompensated image, at all depths. When the blocked elements are turned OFF and the (nonblocked) intercostal sub-apertures are compounded, clutter level decreases by 3 dB on average (relative to the uncompensated image). For the ex vivo abdominal acquisition (Fig. 11), the clutter levels are generally low, not exceeding −40 dB at 20-mm depth and monotonically decreasing. Similar to the transcostal acquisition, clutter magnitude is higher in the compounded image (by about 5 dB) than in the SA image created from the same-size subapertures. The SA and single-aperture images display similar levels of clutter suggesting that clutter magnitude remain constant for the growing aperture in transabdominal imaging.
IV. Discussion
A. Blocked-Element Detection in Large Coherent Apertures
The PSFs and the arrival-time profiles demonstrate that large Tx and receive apertures have been successfully synthesized from the individual transducer apertures at different lateral positions. The full-SA PSFs created from the control acquisitions are symmetric and display reduced main lobe width when compared with their individual-aperture counterparts (Figs. 7 and 9). In addition, for all acquisitions, there is a strong agreement between the arrival-time estimates obtained from the overlapping parts of individual apertures (Fig. 5). Both observations confirm correct spatial registration of the individual transducer apertures and adequate geometric delays applied to all channel signals.
The blocked-element detection algorithm introduced in Part I of this paper has been successfully applied to large SAs used to image through rib samples ex vivo. The large-aperture binary map in Fig. 4(a), which was created by thresholding the element-amplitude image for the transcostal acquisition in Fig. 3, conveys the extent of the regions blocked by bone. On the other hand, the channel amplitude and cross-correlation images created from the abdominal and control acquisitions display relative uniformity in the absence of acoustic obstacles (Fig. 3); thresholding them did not discriminate any blocked-signal features on the 2-D aperture.
The intercostal spacing and the size of canine ribs estimated from the blocked-element maps are similar to sonographic measurements of the human rib cage reported in the literature. In a study on 466 patients, Kim et al. [18] measured the intercostal spaces and the rib width at six different locations along the rib cage. The average intercostal spacing varied from 14.5 to 19.7 mm depending on the location, while the average width of the corresponding ribs varied from 13.2 to 15.2 mm. The estimates of intercostal spacing and rib width from Fig. 4(a) range between 15 and 20 mm, and between 8.4 and 12 mm, respectively. A 3-by-3 moving-average window used to reduce noise in the blocked-element maps also blurs boundaries of the blocked regions leading to a small uncertainty in the above-mentioned estimates. Depending on the choice of the amplitude cutoff value, width of the blocked regions can vary by a few elements (or 1–2 mm). This is expected to have only a marginal effect on the performance of the proposed compensation methods.
B. Image Degradation Due to Blocked Elements
Comparing clutter levels and the PSFs across different tissue acquisitions (and their respective controls) indicates that ultrasound propagation through the chest wall causes more image degradation than propagation through the abdomen. When no compensation is applied, reverberation clutter due to chest wall is measured to be approximately −20 dB at 2 cm away from the tissue, and is 20–30 dB higher, depending on the depth, than its abdominal counterpart (Figs. 10 and 11). Furthermore, comparing the uncompensated transcostal PSFs to the full SA PSFs from the matching control acquisitions, SLL increases by as much as 15.1 dB, putting it above −6 dB for both transcostal acquisitions (Fig. 7 and Table I). As a result, the effective FWHM of the uncompensated transcostal PSFs is about six times larger than their main lobe width, and than the FWHM of the above-mentioned control PSFs. In contrast, wave propagation through the abdomen causes sidelobes (of the full SA PSF) to increase by 5.4 dB and the FWHM to increase by a factor of 1.2 (Fig. 9 and Table I).
Sparsity of the aperture due to blocked elements is estimated as a dominant source of high SLL for the transcostal acquisitions. To isolate the degradation of focus due to aperture sparsity from the effects of phase aberration, reverberation, and other sources of acoustic noise, the blocked-element map in Fig. 4(a) was used to turn OFF channels in the corresponding control acquisition. The resulting increase in SLL is 11.3 dB, which makes up majority of the total increase in SLL measured for the transcostal acquisition (15.1 dB) (Figs. 6 and 7 and Table I). For the imaged rib configuration (and the resulting distribution of blocked elements), the appearance of two side-lobes of such high magnitude is consistent with the simulation and ex vivo results presented in [19] and [4]. In particular, according to simulations results in [19], when an aperture captures multiple ribs and width of a rib and the intercostal space are almost identical, three maxima are observed in the beampattern, one at the focus and one at each side. The side peaks are estimated at −4 dB.
For large arrays that employ conventional beamforming, aperture sparsity due to periodic rib structure can forfeit expected improvements in resolution. A single-intercostal-subaperture PSF shows 13-dB higher SLL and 1.3 and 1.45 times higher FWHM for the first and second transcostal acquisitions, respectively, compared with full SA PSF (Fig. 7 and Table I). In contrast, for the abdominal acquisition, in the absence of blocked elements, the decrease in FWHM is comparable to the increase in overall aperture size, while SLL does not change significantly in the process. Comparing the PSF reconstructed from the center third of the (synthetic) array to the full SA PSF, FWHM decreases by a factor of 2.7, while SLL stays close to −20 dB (Fig. 9 and Table I).
C. Impact of Phase Aberration
While phase aberration due to intercostal spaces is not the main contributor to the loss of focus quality in transthoracic ultrasound, our results in Fig. 5 indicate that it is significantly stronger than phase aberration caused by the abdominal layers. The rms values of arrival-time profiles in Fig. 5 are 58 ns for the transcostal acquisition and 24.8 ns for the abdominal acquisition. The rms arrival-time value obtained for the transcostal acquisition is much larger than the average rms value of 21.3 ns reported by Hinkelman et al. [14]. In addition to using different types of tissue for the ex vivo measurements (canine versus human chest-wall samples), the discrepancy in the results can be explained by the choice of tissue regions over which the arrival-time profiles are reconstructed in each study. The arrival-time estimates in Fig. 5 are particularly large near the blocked channels reaching extrema of ±100 ns, which can be attributed to cartilage and connective tissue surrounding the bone. In [14], the receive apertures are windowed specifically to omit areas over bone and costal cartilage, and to isolate distortions introduced by soft-tissue inhomogeneities. As most of the arrival-time measurements are made closer to the centers of intercostal spaces, the average rms value of the profile is lower.
D. Efficacy of Compensation Methods
We have demonstrated that the adaptive blocked-element compensation (i.e., phase-aberration correction in combination with k-space rescaling) has a potential to reduce near-field clutter and restore point-resolution of large apertures in the presence of blocked elements. Turning OFF blocked channels in Tx and receive apertures reduces clutter noise in transthoracic images by as much as 5 dB, when the (nonblocked) intercostal subapertures are coherently summed (Fig. 10). This is supported by the in vivo results from Part I of this paper. As shown in Figs. 9 and 10 and Table I, turning OFF blocked elements in the receive apertures during the transcostal liver scans reduces clutter inside of liver vessels, and improves vessel contrast and CNR by 19.2% and 10% on average, respectively. Furthermore, in the presence of aperture sparsity, adaptive weighing of the nonblocked channels rescales the attenuated k-space frequencies and reduces SLL by 4.5 and 3.1 dB for the first and second transcostal acquisition, respectively, and by 12.6 and 5.4 dB for their matching control acquisitions (Fig. 6 and Table I). For the first transcostal acquisition, decreasing the SLL below −6 dB (to −7 dB in this case) restores the effective width of the PSF to the FWHM of its main lobe, which implies a sixfold improvement in lateral resolution (Table I).
The performance of the adaptive compensation method is analyzed for a particular set of imaging conditions (such as orientation of the ribs, type of imaging target, and so on), but the results can be extended to alternative imaging scenarios. In particular, while the above-mentioned results were obtained for a point target, the adaptive weighting scheme is expected to recover system response when the signals originate from diffuse scatterers as well. Because the k-space weights are computed from the binary blocked-element maps, they are robust to local variations of the signal. The results of Part I show that blocked elements can be detected using signals from diffuse targets if the channel amplitude and nearest-neighbor cross correlation are averaged through depth (over multiple speckle realizations). Furthermore, the average amplitude of diffuse targets in k-space is the same as that of point target [16]. While rescaling of the nonblocked Tx/Rx channel pairs would change amplitude of speckle at a particular location, it is expected to recover the average system response measured over many speckle realizations. The phase of the k-space spectrum of diffuse scatterers is random and would remain intact in the process [16]. As a result, the first and second-order speckle statistics of the compensated image should be the same as in the image formed using an unobstructed aperture.
Furthermore, for the presented transcostal acquisition, the ribs are aligned in the elevation dimension of the array, so the blocked-element compensation does not significantly affect the PSF in this dimension. For a diagonal orientation of ribs (with respect to lateral and elevation dimensions of the array), high SLL are expected along both lateral and elevation dimensions of the PSF. If the blocked area of aperture is not too large so that there are remaining (nonblocked) Tx/Rx channel pairs at all spatial frequencies, the adaptive compensation will significantly reduce these sidelobes. In particular, from the transcostal acquisitions presented herein, it appears that if the total blocked area is not larger than a third of the aperture, the signal could be recovered at most spatial frequencies (Fig. 4). By reducing sidelobes that are initially higher than −6 dB, the adaptive compensation also has a potential to reduce the effective FWHM in both dimensions of the PSF, thus improving lateral resolution and decreasing slice thickness of transcostal 2-D scans.
Our initial results for the adaptive blocked-element compensation are promising, but to apply the proposed technique in vivo, the following challenges would likely have to be addressed. First, the k-space compensation is sensitive to the presence of acoustic noise, as indicated in Fig. 6. Because of tissue-induced noise on the non-blocked elements, sidelobe reduction via k-space rescaling is not as effective for the ex vivo transcostal acquisitions as it is for the matching controls. High levels of in vivo clutter are likely to introduce even stronger random variations in the amplitude spectrum [16], [20], making it more challenging to approximate its desired shape and reduce sidelobes. Second, in vivo phase-aberration correction, which is a part of adaptive compensation, would likely have to be performed on diffuse targets and in the presence of clutter. The arrival time maps in Fig. 5 are obtained using echoes from the point target, which show high coherence across the aperture. Speckle targets exhibit partial coherence and can be significantly corrupted in the presence of clutter, making it more difficult to estimate tissue-induced delays.
Other compensation methods presented in this paper yield partial improvements of image quality. When the blocked channels are turned OFF and the nonblocked channels are uniformly weighted (i.e., the basic compensation), the near-field clutter is reduced, but the PSFs remain virtually unchanged. This can be attributed to lower signal amplitude on the blocked channels (compared with the rest of the aperture); while turning OFF those channels will reduce the noise level, it will not significantly impact the shape of higher amplitude main lobe and sidelobes. Compounding the intercostal subapertures results in partial reduction of clutter; measured decrease in average clutter level for the transcostal acquisition in Fig. 10 is about 3 dB. However, speckle/noise texture in the compounded images appears smoother than in the matching SA images. In addition, compounding the associated PSFs reduces sidelobes significantly, and only at the slight expense of the effective FWHM. Comparing the compounded PSFs to their uncompensated counterparts, SLL decreases by no less than 16 dB while the effective FWHM increases at most by a factor of 1.4 (Table I).
The observed changes in the clutter levels and of the PSF due to compounding of the intercostal subapertures are supported by the findings in the literature. While compounding is not expected to improve the resolution significantly beyond that of the individual (subaperture) images, it is expected to increase the speckle SNR; compounding N independent speckle realizations increases the speckle SNR by a factor of [21]. In a similar manner, the clutter magnitude is expected to be higher in a compounded image than in the SA image beamformed from the same subapertures. This is due to the fact that the incoherent summation of ultrasound signals is always larger than their coherent summation, except for the case of a point target at the focus, when all the individual-channel signals are in-phase and the two quantities are equal.
V. Conclusion
The blocked-element detection and compensation methods described in Part I were successfully realized on large coherent 2-D apertures while imaging through the excised sections of canine chest wall. We also demonstrated an adaptive blocked-element compensation technique that has a potential to reduce reverberation clutter and restore resolution of large arrays in transcostal imaging.
The elements blocked by ribs were detected by thresholding the average amplitudes of their signals. Synthetic Tx and receive data was then used to implement different compensation schemes offline, and to estimate the individual sources of image degradation in transthoracic ultrasound. As a reference, some of the beamforming schemes were also applied to SA data collected through a section of canine abdomen, in the absence of acoustic obstacles. Ultrasound propagation through the chest wall results in higher clutter levels and increased loss of focus quality compared with propagation through the abdomen. Phase aberration due to intercostal spaces and a periodic distribution of blocked elements (i.e., aperture sparsity) both degrade the transcostal PSF, but the latter is the main cause of excessively high SLL and can diminish the expected improvements in resolution with large apertures.
As a part of compensation, turning OFF the blocked elements reduces image clutter as predicted by the in vivo results in Part I of this paper. Adaptive weighing of the nonblocked elements to rescale the attenuated spatial frequencies reduces SLL, and has a potential to restore the resolution to the nonblocked levels. The adaptive compensation method is sensitive to the presence of acoustic noise and should be used in combination with the phase-aberration correction (and/or other noise-reduction techniques) to ensure efficient sidelobe reduction.
Acknowledgments
This work was supported by the National Institute of Biomedical Imaging and Bioengineering under Grant R37-HL096023 and Grant R01-EB017711.
The authors would like to thank the Ultrasound Division, Siemens Medical Solutions USA, Inc., for their in-kind and technical support. The authors would also like to thank T. Lian for programming the translation stages and for helping with the ex vivo data acquisitions.
Biographies

Marko Jakovljevic received the B.S. degree from The University of Texas at Austin, Austin, TX, USA, in 2009, and the Ph.D. degree from Duke University, Durham, NC, USA, in 2015, under the supervision of Dr. Trahey.
He is currently a Post-Doctoral Fellow with the Department of Radiology, Stanford School of Medicine, Stanford, CA, USA. His current research interests include coherence imaging, synthetic aperture beamforming, and signal processing in general.
Nick Bottenus received the B.S.E. degree in biomedical engineering and electrical and computer engineering from Duke University, Durham, NC, USA, in 2011, where he is currently pursuing the Ph.D. degree in biomedical engineering.
His current research interests include coherence-based imaging and synthetic aperture beamforming methods.
Mr. Bottenus is a member of the Society of Duke Fellows.

Lily Kuo was born in Chicago, IL, USA, in 1988. She received the B.S. degree in biomedical engineering from Washington University in St. Louis, St. Louis, MO, USA, in 2011, and the M.S. degree in biomedical engineering from Duke University, Durham, NC, USA, in 2013. She is currently pursuing the M.D. degree with the University of Texas Health Science Center School of Medicine, San Antonio, TX, USA.
She was a Scientific Researcher with the Department of Biomedical Imaging, Genentech, South San Francisco, CA, USA. Her current research interests include cardiac elasticity imaging, image-guided surgery, and cardiac and lung transplantation.

Shalki Kumar was born in Jabalpur, India, in 1989. She received the B.Tech. degree in biomedical engineering from the Vellore Institute of Technology, Vellore, India, in 2011, and the M.S. degree in biomedical engineering from Duke University, Durham, NC, USA, in 2013.
She was with Dr. Olaf Von Ramm’s Ultrasound Lab, Duke University. She was a full-time Research Associate with Dr. Gregg Trahey’s Lab. She is currently in pharmaceutical industry as a Validation Engineer.
Jeremy J. Dahl (M’11) was born in Ontonagon, MI, USA, in 1976. He received the B.S. degree in electrical engineering from the University of Cincinnati, Cincinnati, OH, USA, in 1999, and the Ph.D. degree in biomedical engineering from Duke University, Durham, NC, USA, in 2004.
He is currently an Assistant Professor with the Department of Radiology, School of Medicine, Stanford University, Stanford, CA, USA. His current research interests include adaptive beamforming, noise in ultrasonic imaging, and radiation force imaging methods.
Gregg E. Trahey (S’83–M’85) received the B.G.S. and M.S. degrees from the University of Michigan, Ann Arbor, MI, USA, in 1975 and 1979, respectively, and the Ph.D. degree in biomedical engineering from Duke University, Durham, NC, USA, in 1985.
He was with the Peace Corps from 1975 to 1978. He was a Project Engineer with the Emergency Care Research Institute, Plymouth Meeting, PA, USA, from 1980 to 1982. He is currently a Professor with the Department of Biomedical Engineering, Duke University, and holds a secondary appointment with the Department of Radiology, Duke University Medical Center, Durham, NC. His current research interests include adaptive phase correction, radiation force imaging methods, and 2-D flow imaging in medical ultrasound.
Footnotes
An idealized acoustic radiator is a transducer for which the excitation is continuously variable over its surface.
During the full-SA acquisition on the SC2000 clinical scanner, signals were received for 180 channels, while all 192 channels were used to transmit, one at the time. For the given imaging configuration, the last 12 channels were omitted on receive as they would have to be collected using additional transmits, which would have exceeded the limits of internal memory size of the SC2000.
Contributor Information
Marko Jakovljevic, Department of Biomedical Engineering, Duke University, Durham, NC 27708 USA. He is now with the Department of Radiology, Stanford School of Medicine, Stanford, CA 94305 USA.
Nick Bottenus, Department of Biomedical Engineering, Duke University, Durham, NC 27708 USA.
Lily Kuo, Department of Biomedical Engineering, Duke University, Durham, NC 27708 USA. She is now with the University of Texas School of Medicine, San Antonio, TX 78229 USA.
Shalki Kumar, Department of Biomedical Engineering, Duke University, Durham, NC 27708 USA.
Jeremy J. Dahl, Department of Radiology, School of Medicine, Stanford University, Stanford, CA 94305 USA.
Gregg E. Trahey, Department of Biomedical Engineering, Duke University, Durham, NC 27708 USA, and also with the Department of Radiology, Duke University Medical Center, Durham, NC 27708 USA.
References
- 1.Aubry JF, Pernot M, Marquet F, Tanter M, Fink M. Transcostal high-intensity-focused ultrasound: Ex vivo adaptive focusing feasibility study. Phys Med Biol. 2008;53(11):2937–2951. doi: 10.1088/0031-9155/53/11/012. [DOI] [PMC free article] [PubMed] [Google Scholar]
- 2.Civale J, Clarke R, Rivens I, ter Haar G. The use of a segmented transducer for rib sparing in HIFU treatments. Ultrasound Med Biol. 2006;32(11):1753–1761. doi: 10.1016/j.ultrasmedbio.2006.06.005. [DOI] [PubMed] [Google Scholar]
- 3.Cochard E, Prada C, Aubry JF, Fink M. Ultrasonic focusing through the ribs using the DORT method. Med Phys. 2009;36(8):3495–3503. doi: 10.1118/1.3159755. [DOI] [PubMed] [Google Scholar]
- 4.Bobkova S, Gavrilov L, Khokhlova V, Shaw A, Hand J. Focusing of high-intensity ultrasound through the rib cage using a therapeutic random phased array. Ultrasound Med Biol. 2010;36(6):888–906. doi: 10.1016/j.ultrasmedbio.2010.03.007. [DOI] [PMC free article] [PubMed] [Google Scholar]
- 5.Ballard JR, Casper AJ, Wan Y, Ebbini ES. Adaptive transthoracic refocusing of dual-mode ultrasound arrays. IEEE Trans Biomed Eng. 2010 Jan;57(1):93–102. doi: 10.1109/TBME.2009.2028150. [DOI] [PMC free article] [PubMed] [Google Scholar]
- 6.Botros YY, Ebbini ES, Volakis JL. Two-step hybrid virtual array ray (VAR) technique for focusing through the rib cage. IEEE Trans Ultrason, Ferroelect, Freq Control. 1998 Jul;45(4):989–1000. doi: 10.1109/58.710577. [DOI] [PubMed] [Google Scholar]
- 7.Pernot M, Aubry J-F, Tanter M, Thomas J-L, Fink M. Experimental validation of 3D finite differences simulations of ultrasonic wave propagation through the skull. Proc IEEE Ultrason Symp. 2001 Oct;2:1547–1550. [Google Scholar]
- 8.Aubry JF, Tanter M, Pernot M, Thomas JL, Fink M. Experimental demonstration of noninvasive transskull adaptive focusing based on prior computed tomography scans. J Acoust Soc Amer. 2003;113(1):84–93. doi: 10.1121/1.1529663. [DOI] [PubMed] [Google Scholar]
- 9.Li PC, Flax SW, Ebbini ES, O’Donnell M. Blocked element compensation in phased array imaging. IEEE Trans Ultrason, Ferroelect, Freq Control. 1993 Jul;40(4):283–292. doi: 10.1109/58.251276. [DOI] [PubMed] [Google Scholar]
- 10.Jakovljevic M, Byram B, Hyun D, Dahl J, Trahey G. Short-lag spatial coherence imaging on matrix arrays, part II: Phantom and in vivo experiments. IEEE Trans Ultrason, Ferroelect, Freq Control. 2014 Jul;61(7):1113–1122. doi: 10.1109/TUFFC.2014.3011. [DOI] [PMC free article] [PubMed] [Google Scholar]
- 11.Zell K, Sperl JI, Vogel MW, Niessner R, Haisch C. Acoustical properties of selected tissue phantom materials for ultrasound imaging. Phys Med Biol. 2007;52(20):475–484. doi: 10.1088/0031-9155/52/20/N02. [DOI] [PubMed] [Google Scholar]
- 12.Madsen EL, Zagzebski JA, Banjavic RA, Burlew MM. Phantom material and method. 4 277 367. US Patent. 1981 Jul 7;
- 13.Al-Nassar YN, Al-Jalal AM, Khan MA, Al-Kaabi SA. Functional dependence of ultrasonic speed in water on salinity and temperature. Nondestruct Test. 2006;11(6):1–5. [Google Scholar]
- 14.Hinkelman LM, Szabo TL, Waag RC. Measurements of ultrasonic pulse distortion produced by human chest wall. J Acoust Soc Amer. 1997;101(4):2365–2373. doi: 10.1121/1.418248. [DOI] [PubMed] [Google Scholar]
- 15.Liu DL, Waag RC. Time-shift compensation of ultrasonic pulse focus degradation using least-mean-square error estimates of arrival time. J Acoust Soc Amer. 1994;95(1):542–555. doi: 10.1121/1.408348. [DOI] [PubMed] [Google Scholar]
- 16.Walker WF, Trahey GE. The application of k-space in pulse echo ultrasound. IEEE Trans Ultrason, Ferroelect, Freq Control. 1998 May;45(3):541–558. doi: 10.1109/58.677599. [DOI] [PubMed] [Google Scholar]
- 17.Lathi BP. Linear Systems and Signals. Oxford, U.K: Oxford Univ. Press; 2009. [Google Scholar]
- 18.Kim YS, Park MJ, Rhim H, Lee MW, Lim HK. Sonographic analysis of the intercostal spaces for the application of high-intensity focused ultrasound therapy to the liver. Amer J Roentgenol. 2014;203(1):201–208. doi: 10.2214/AJR.13.11744. [DOI] [PubMed] [Google Scholar]
- 19.Khokhlova VA, Bobkova SM, Gavrilov LR. Focus splitting associated with propagation of focused ultrasound through the rib cage. Phys Acoust. 2010;56(5):622–632. doi: 10.1134/S106377101005012X. [DOI] [PMC free article] [PubMed] [Google Scholar]
- 20.Walker WF, Trahey GE. Speckle coherence and implications for adaptive imaging. J Acoust Soc Amer. 1997;101(4):1847–1858. doi: 10.1121/1.418235. [DOI] [PubMed] [Google Scholar]
- 21.Burckhardt CB. Speckle in ultrasound B-mode scans. IEEE Trans Sonics Ultrason. 1978 Jan;SU-25(1):1–6. [Google Scholar]