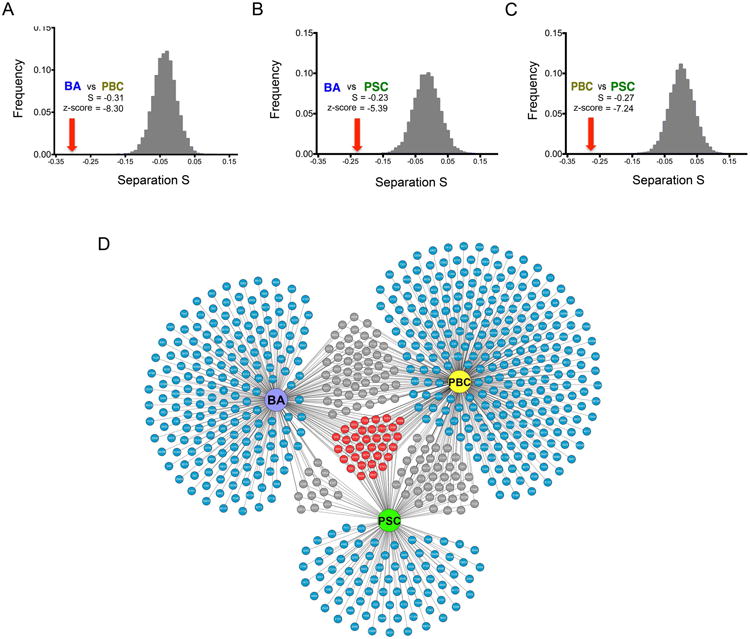
Figure 3. Gene-sharing and molecular overlap among BA, PBC and PSC.

(A-C) Distribution of the network-based separation S values obtained from 1,000 random permutations for the cholangiopathies pairs. Red arrow indicates the observed separation S value and the corresponding z-score. (D) Network of cholangiopathy-associated genes, where blue depict genes specific to individual diseases, grey for genes shared by two diseases, and red containing genes shared by the three diseases.
