Abstract
Objectives
The aim of this study was to identify apparent diffusion coefficient (ADC) values for typical haemangiomas in the spine and to compare them with active malignant focal deposits.
Methods
This was a retrospective single-institution study. Whole-body magnetic resonance imaging (MRI) scans of 106 successive patients with active multiple myeloma, metastatic prostate or breast cancer were analysed. ADC values of typical vertebral haemangiomas and malignant focal deposits were recorded.
Results
The ADC of haemangiomas (72 ROIs, median ADC 1,085×10-6mm2s-1, interquartile range 927–1,295×10-6mm2s-1) was significantly higher than the ADC of malignant focal deposits (97 ROIs, median ADC 682×10-6mm2s-1, interquartile range 583–781×10-6mm2s-1) with a p-value < 10-6. Receiver operating characteristic (ROC) analysis produced an area under the curve of 0.93. An ADC threshold of 872×10-6mm2s-1 separated haemangiomas from malignant focal deposits with a sensitivity of 84.7 % and specificity of 91.8 %.
Conclusions
ADC values of classical vertebral haemangiomas are significantly higher than malignant focal deposits. The high ADC of vertebral haemangiomas allows them to be distinguished visually and quantitatively from active sites of disease, which show restricted diffusion.
Key Points
• Whole-body diffusion-weighted MRI is becoming widely used in myeloma and bone metastases.
• ADC values of vertebral haemangiomas are significantly higher than malignant focal deposits.
• High ADCs of haemangiomas allows them to be distinguished from active disease.
Keywords: Diffusion magnetic resonance imaging, Whole body imaging, Bone neoplasms, Multiple myeloma, Haemangioma
Introduction
Vertebral haemangiomas are the most common benign vertebral neoplasm with a reported incidence of 10–26 % and are multiple in 7.2 % of normal subjects [1]. They are most commonly asymptomatic, although rarely (0.9–1.2 % [2]) lesions can cause symptoms through local mass effect, fracture or bleeding [3]. Histologically vertebral haemangiomas are composed of newly formed blood vessels usually with normal structure in the absence of arteriovenous shunts. Haemangiomas are not separated from surrounding bone by a capsule and the surrounding osseous lamellae usually shows secondary osteolysis and osteocondensation, and the bone marrow undergoes fibrous and/or adipose involution [2].
The variable composition of vertebral haemangiomas does lead to some variation in MRI appearances but vertebral haemangiomas usually display classical MRI appearances. On T2-weighted (T2w) images typical haemangiomas return high-signal intensity due to slow flow in vascular channels and oedema. Fat content results in high signal on T1-weighted (T1w) imaging. The presence of high signal on T1w or T2w images is related to the amount of adipocytes or vessels and interstitial oedema, respectively [4, 5]. Thickened trabeculae can sometimes be seen as linear low-signal intensity on all sequences [6]. As such, haemangiomas rarely present a diagnostic dilemma on routine MRI of the spine. However, applications for whole-body MRI are rapidly expanding and in particular whole-body MRI has become standard of care for myeloma and bone metastasis imaging in a growing number of institutions [7–9]. The complement of MR sequences used varies between institutions. For some applications such as screening for soft tissue malignancy in high-risk populations, whole-body MRI may consist of whole-body diffusion-weighted MRI without T1w and T2w imaging of the spine. In the absence of standard MRI sequences, vertebral haemangiomas may therefore be mistaken for sinister focal deposits.
Furthermore, healthcare systems with limited resource will struggle to maximise the potential of whole-body diffusion-weighted MRI. Automated segmentations made possible by machine learning technologies offer potential to not only speed up reporting times but also to transform whole-body qualitative data into quantitative datasets of disease burden and response to treatment [10]. Arguably the most exciting opportunities for such applications are in imaging bone disease but quantitative measures to enable exclusion of common vertebral haemangiomas from automated segmentations are not yet available.
In our institution whole-body diffusion-weighted MRI is standard of care for imaging patients with myeloma and is also frequently used to assess metastatic bone disease in patients with prostate or breast cancer. The potential mechanical complications in our patient population, which include vertebral fractures and spinal cord compression, necessitate inclusion of sagittal T1w and T2w MRI of the spine within the whole-body MRI protocol. This study therefore aims to identify apparent diffusion coefficient (ADC) values for typical haemangiomas in the spine and to compare them with malignant focal deposits.
Materials and methods
This was a retrospective single-institution study with local institutional review board approval.
Subjects
Whole-body MRI scans of 106 successive patients (57 prostate, 44 myeloma, five breast; 80 males, 26 females; median age 67 years, range 31–89 years) with active multiple myeloma and focal deposits (as per International Myeloma Working Group criteria [11]) or metastatic bone disease from prostate and breast cancer (confirmed on T1w and T2w MRI and sequential imaging) were included.
MRI technique
Using an Avanto 1.5 T system (Siemens, Erlangen, Germany) a whole-body study was achieved by the serial acquisition of contiguous body regions. All subjects were scanned supine with arms by their sides. Coil elements were positioned from skull vertex to knees. Sagittal T1w images (TR 590 ms, TE 11 ms, field of view (FOV) 400 mm, slice thickness 4 mm), and T2w images (TR 2,690 ms, TE 93 ms, FOV 400 mm, slice thickness 4 mm) were acquired, followed by axial diffusion-weighted sequences (single-shot double spin echo echo-planar technique with STIR fat suppression in free breathing). b-values of 50 and 900 s mm-2 were applied in three orthogonal directions and combined to provide isotropic trace images. Diffusion-weighted images were acquired in multiple contiguous stations of 50 slices per station (slice thickness 5 mm, no gap, FOV 430 mm, phase direction AP, parallel imaging (GRAPPA) factor 2, TR 14,800 ms, TE 66 ms, inversion time (TI) 180 ms, voxel size 2.9 mm × 2.9 mm × 5 mm, number of signal averages acquired 4, matrix 150×150, bandwidth 1,960 Hz per pixel). The scanner carrier frequency used for the most superior imaging station was applied for all other stations. The same shim gradient currents were applied for each station. Total acquisition time was 50 min.
Image analysis
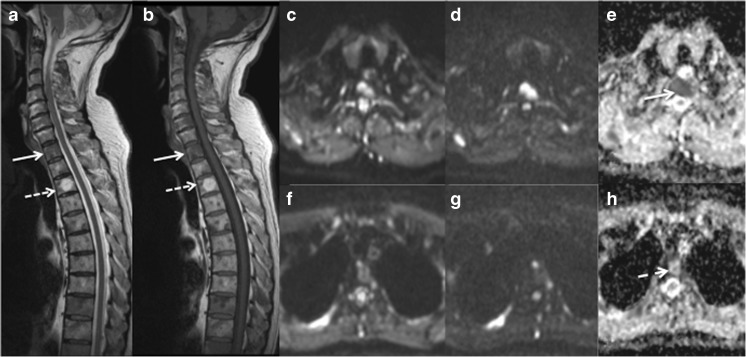
For each patient a maximum of three vertebral haemangiomas measuring a minimum diameter of 1 cm were identified as bright focal lesions on sagittal T1w and T2w imaging of the spine (Fig. 1). With the aid of the Picture Archiving and Communication System (PACS) localiser the corresponding lesion was identified on the axial ADC map, which was generated using a mono-exponential fit using the scanner’s proprietary software. A region of interest (ROI) was drawn around the haemangioma and the mean ADC calculated for all pixels within the ROI. For each patient a maximum of three malignant focal deposits measuring a minimum diameter of 1 cm were identified on axial b=900 s mm-2 diffusion-weighted images and ADC maps. An ROI was drawn around each deposit on the ADC map and the mean ADC calculated. The median diameter of ROIs was 18.6 mm (range 10.0–41.0 mm).
Fig. 1.
(a) Sagittal T2w and (b) T1w MRI of the cervico-thoracic spine shows a typical low signal metastasis (arrow) and a typical high signal haemangioma (dashed arrow). Corresponding axial diffusion-weighted MRI images of the metastasis (c b=50 s mm-2, d b=900 s mm-2, and e apparent diffusion coefficient (ADC) map) and of the haemangioma (f b=50 s mm-2, g b=900 s mm-2, and h ADC map) are shown. The metastasis exhibits restricted diffusion on the ADC map (e, arrow) but conversely the haemangioma has a high ADC (h, dashed arrow)
Statistical analysis
Statistical analysis was carried out using Matlab version 2016a (The Mathworks, Natick, MA, USA). A two-sample t-test was used to assess whether there was a significant difference in ADC estimates between haemangiomas and malignant focal deposits. P<0.05 was considered to indicate a significant difference. Receiver operating characteristic (ROC) curves were used to assess the performance of ADC estimates in distinguishing haemangiomas from malignant focal deposits.
Results
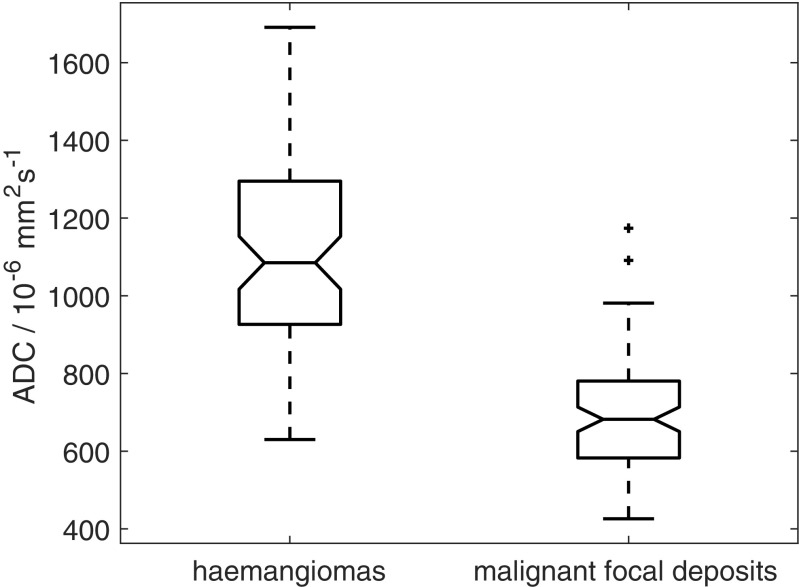
The ADC of haemangiomas (72 ROIs, median ADC 1,085×10-6mm2s-1, interquartile range 927–1,295×10-6mm2s-1) was significantly higher than the ADC of malignant focal deposits (97 ROIs, median ADC 682×10-6mm2s-1, interquartile range 583–781×10-6mm2s-1) with a p-value < 10-6 (Fig. 2).
Fig. 2.
Boxplot showing all apparent diffusion coefficient (ADC) estimates from haemangiomas (n=72) and malignant focal deposits (n=97). Two-sample t-test, p<10-6
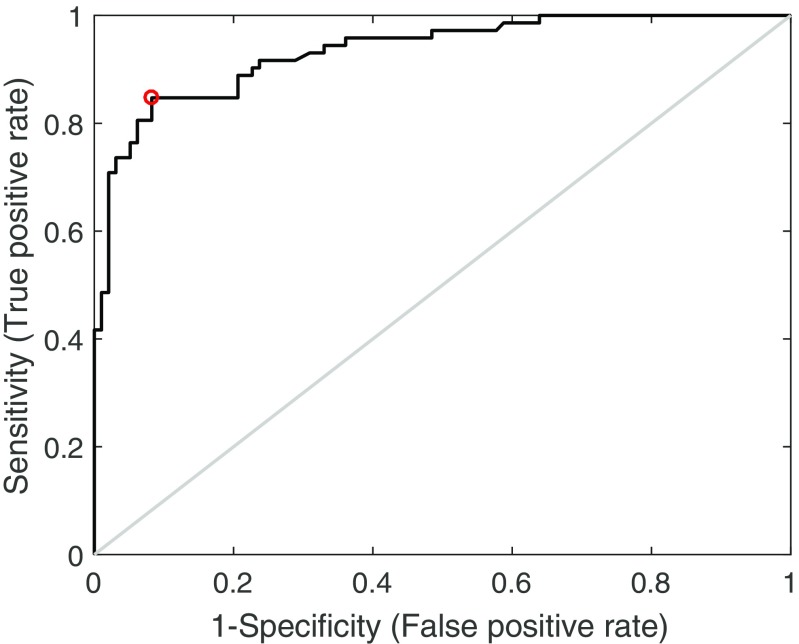
ROC analysis produced an area under the curve of 0.93. An ADC threshold of 872×10-6mm2s-1 separated haemangiomas from malignant focal deposits with a sensitivity of 84.7 % and specificity of 91.8 % (Fig. 3).
Fig. 3.
Receiver operating characteristic (ROC) curve showing performance of apparent diffusion coefficient (ADC) estimates in distinguishing haemangiomas from malignant focal deposits. Red circle shows optimal operating point. Grey line shows line of identity
Discussion
This study demonstrated that ADC values of classical vertebral haemangiomas are significantly different to malignant focal deposits. The high ADC of vertebral haemangiomas allows them to be distinguished visually and quantitatively from active sites of disease, which show restricted diffusion. The ADC of malignant focal deposits (682×10-6mm2s-1) was in agreement with previously published values of 761×10-6mm2s-1 for myeloma [12] and 782×10-6mm2s-1 for bone metastases [13]. However, previous studies have reported ADC values of 960×10-6mm2s-1 following treatment [12] and therefore treated sites of disease could potentially be mistaken for haemangiomas in the absence of corresponding T1w and T2w imaging or previous imaging for comparison.
The ADC values of vertebral haemangiomas and malignant focal deposits in the present study are higher than ADC values of normal bone marrow reported in previous studies of healthy volunteers, which were acquired with comparable protocols [14, 15]. Mean ADCs of (471±142)×10-6mm2s-1 [14] and (577.4±56.9)×10-6mm2s-1 [15] have been reported in bone marrow in mixed cohorts of healthy volunteers of comparable ages to the patients in the present study. We were unable to confirm normal marrow for analysis in this cohort of patients as bone marrow in patients with myeloma or bone metastases may be abnormal even in the absence of focal lesions or clear evidence of diffuse signal abnormality.
The narrow range of ADC estimates observed across the 97 malignant focal deposits suggests that the whole-body diffusion-weighted MRI protocol employed in this study is robust and suitable for use in quantitative applications. The wider range of ADC estimates observed across the 72 haemangiomas may arise from variations in the composition of haemangiomas and may relate to differences in vascularity, fat content and oedema.
Accurate estimation of ADCs across the FOV is essential for the use of ADC thresholds to discriminate between imaging features, for example to distinguish haemangiomas from malignant focal deposits. Variation in ADC estimates has been demonstrated at points far from isocentre and has been attributed largely to non-linearity in the diffusion-encoding gradients [16, 17]. The variation in ADC estimates across the FOV in the whole-body diffusion-weighted MRI protocol employed in this study has been shown to be around 5–8 % but greater variations in ADC estimates would be encountered in imaging protocols that employ larger numbers of slices per station [17].
In conclusion, the ADC values of classical vertebral haemangiomas are significantly higher than the ADCs of malignant focal deposits. The high ADC of vertebral haemangiomas allows them to be distinguished visually and quantitatively from active sites of disease in whole-body diffusion-weighted imaging.
Acknowledgements
This report is independent research funded by the National Institute for Health Research. The views expressed in this publication are those of the author(s) and not necessarily those of the National Health Service, the National Institute for Health Research or the Department of Health.
Funding
This study has received funding by Cancer Research UK and Engineering and Physical Sciences Research Council support to the Cancer Imaging Centre at The Institute of Cancer Research and Royal Marsden Hospital in association with Medical Research Council and Department of Health C1060/A10334, C1060/A16464 and National Health Service funding to the National Institute for Health Research Biomedical Research Centre, Clinical Research Facility in Imaging and the Cancer Research Network.
Abbreviations
- ADC
Apparent diffusion coefficient
- AP
Anterior-posterior
- FOV
Field of view
- GRAPPA
Generalized Autocalibrating Partially Parallel Acquisitions
- MRI
Magnetic resonance imaging
- PACS
Picture Archiving and Communication System
- ROC
Receiver operating characteristic
- ROI
Region of interest
- STIR
Short-TI inversion recovery
- T1w
T1 weighted
- T2w
T2 weighted
- TE
Echo time
- TI
Inversion time
- TR
Repetition time
Compliance with ethical standards
Guarantor
The scientific guarantor of this publication is Dr Christina Messiou.
Conflict of interest
The authors of this manuscript declare no relationships with any companies whose products or services may be related to the subject matter of the article.
Statistics and biometry
No complex statistical methods were necessary for this paper.
Informed consent
Written informed consent was waived by the Institutional Review Board.
Ethical approval
Institutional Review Board approval was obtained.
Methodology
• retrospective
• observational
• performed at one institution
References
- 1.Slon V, Stein D, Cohen H, Sella-Tunis T, May H, Hershkovitz I. Vertebral hemangiomas: their demographical characteristics, location along the spine and position within the vertebral body. Eur Spine J. 2015;24:2189–2195. doi: 10.1007/s00586-015-4022-y. [DOI] [PubMed] [Google Scholar]
- 2.Pastushyn AI, Slin'ko EI, Mirzoyeva GM. Vertebral hemangiomas: diagnosis, management, natural history and clinicopathological correlates in 86 patients. Surg Neurol. 1998;50:535–547. doi: 10.1016/S0090-3019(98)00007-X. [DOI] [PubMed] [Google Scholar]
- 3.Vinay S, Khan SK, Braybrooke JR. Lumbar vertebral haemangioma causing pathological fracture, epidural haemorrhage, and cord compression: a case report and review of literature. J Spinal Cord Med. 2011;34:335–339. doi: 10.1179/2045772311Y.0000000004. [DOI] [PMC free article] [PubMed] [Google Scholar]
- 4.Baudrez V, Galant C, Vande Berg BC. Benign vertebral hemangioma: MR-histological correlation. Skeletal Radiol. 2001;30:442–446. doi: 10.1007/s002560100390. [DOI] [PubMed] [Google Scholar]
- 5.Ross JS, Masaryk TJ, Modic MT, Carter JR, Mapstone T, Dengel FH. Vertebral hemangiomas: MR imaging. Radiology. 1987;165:165–169. doi: 10.1148/radiology.165.1.3628764. [DOI] [PubMed] [Google Scholar]
- 6.Nouh MR, Eid AF. Magnetic resonance imaging of the spinal marrow: basic understanding of the normal marrow pattern and its variant. World J Radiol. 2015;7:448–458. doi: 10.4329/wjr.v7.i12.448. [DOI] [PMC free article] [PubMed] [Google Scholar]
- 7.National Institute for Health and Care Excellence (2016) Myeloma: Diagnosis and Management. NICE guideline (NG35). Available via https://www.nice.org.uk/guidance/ng35/chapter/recommendations. Accessed 24 May 2017
- 8.Messiou C, Kaiser M. Whole body diffusion weighted MRI - a new view of myeloma. Br J Haematol. 2015;171:29–37. doi: 10.1111/bjh.13509. [DOI] [PMC free article] [PubMed] [Google Scholar]
- 9.Padhani AR, Lecouvert FE, Tunariu N, et al. METastasis reporting and data system for prostate cancer: practical guidelines for acquisition, interpretation, and reporting of whole-body magnetic resonance imaging-based evaluations of multiorgan involvement in advanced prostate cancer. Eur Urol. 2017;71:81–92. doi: 10.1016/j.eururo.2016.05.033. [DOI] [PMC free article] [PubMed] [Google Scholar]
- 10.Rueckert D, Glocker B, Kainz B. Learning clinically useful information from images: Past, present and future. Med Image Anal. 2016;33:13–18. doi: 10.1016/j.media.2016.06.009. [DOI] [PubMed] [Google Scholar]
- 11.Dimopoulos MA, Hillengass J, Usmani S, et al. Role of magnetic resonance imaging in the management of patients with multiple myeloma: a consensus statement. J Clin Oncol. 2015;33:657–664. doi: 10.1200/JCO.2014.57.9961. [DOI] [PubMed] [Google Scholar]
- 12.Messiou C, Giles S, Collins DJ, et al. Assessing response of myeloma bone disease with diffusion-weighted MRI. Br J Radiol. 2012;85:e1198–e1203. doi: 10.1259/bjr/52759767. [DOI] [PMC free article] [PubMed] [Google Scholar]
- 13.Perez-Lopez R, Mateo J, Mossop H, et al. Diffusion-weighted imaging as a treatment response biomarker for evaluating bone metastases in prostate cancer: a pilot study. Radiology. 2017;283:168–177. doi: 10.1148/radiol.2016160646. [DOI] [PMC free article] [PubMed] [Google Scholar]
- 14.Messiou C, Collins DJ, Morgan VA, deSouza NM. Optimising diffusion weighted MRI for imaging metastatic and myeloma bone disease and assessing reproducibility. Eur Radiol. 2011;21:1713–1718. doi: 10.1007/s00330-011-2116-4. [DOI] [PubMed] [Google Scholar]
- 15.Lavdas I, Rockall AG, Castelli F, et al. Apparent diffusion coefficient of normal abdominal organs and bone marrow from whole-body DWI at 1.5T: the effect of sex and age. AJR AM J Roentgenol. 2015;205:242–250. doi: 10.2214/AJR.14.13964. [DOI] [PubMed] [Google Scholar]
- 16.Malyarenko DI, Newitt D, Wilmes LJ, et al. Demonstration of nonlinearity bias in the measurement of the apparent diffusion coefficient in multicenter trials. Magn Reson Med. 2016;75:1312–1323. doi: 10.1002/mrm.25754. [DOI] [PMC free article] [PubMed] [Google Scholar]
- 17.Winfield JM, Collins DJ, Priest AN, et al. A framework for optimization of diffusion-weighted MRI protocols for large field-of-view abdominal-pelvic imaging in multicenter studies. Med Phys. 2016;43:95–110. doi: 10.1118/1.4937789. [DOI] [PubMed] [Google Scholar]


