Significance
Silicon has a peculiar negative thermal expansion at low temperature. This behavior has been understood with a “quasiharmonic” theory where low-energy phonons decrease in frequency with volume contraction. We report inelastic neutron scattering measurements of phonon dispersions over a wide range of temperatures. These measurements cast doubt upon quasiharmonic theory, which predicts the wrong sign for most phonon shifts with temperature. Fully anharmonic ab initio calculations correctly predict the phonon shifts and thermal expansion. Crystal structure, anharmonicity, and nuclear quantum effects all play important roles in the thermal expansion of silicon, and a simple mechanical explanation is inappropriate. The quantum effect of nuclear vibrations is also expected to be important for thermophysical properties of many materials.
Keywords: thermal expansion, phonon anharmonicity, inelastic neutron scattering, nuclear quantum effects, silicon
Abstract
Despite the widespread use of silicon in modern technology, its peculiar thermal expansion is not well understood. Adapting harmonic phonons to the specific volume at temperature, the quasiharmonic approximation, has become accepted for simulating the thermal expansion, but has given ambiguous interpretations for microscopic mechanisms. To test atomistic mechanisms, we performed inelastic neutron scattering experiments from 100 K to 1,500 K on a single crystal of silicon to measure the changes in phonon frequencies. Our state-of-the-art ab initio calculations, which fully account for phonon anharmonicity and nuclear quantum effects, reproduced the measured shifts of individual phonons with temperature, whereas quasiharmonic shifts were mostly of the wrong sign. Surprisingly, the accepted quasiharmonic model was found to predict the thermal expansion owing to a large cancellation of contributions from individual phonons.
A quantized harmonic oscillator was Einstein’s seminal idea for understanding atom vibrations in solids. Better accuracy for crystalline solids is achieved when the vibrations are resolved into normal modes. Each normal mode is quantized, with a zero-point energy and excitations called phonons. However, harmonic models are limited to quadratic terms in the interatomic potential, and it is well known that higher-order terms are necessary to describe properties of real solids such as thermal conductivity and thermal expansivity. Despite this knowledge, the necessary and sufficient contributions to nonharmonic effects remain less clear. A popular approach is the quasiharmonic model (QH), which assumes harmonic oscillators, but with frequencies renormalized to account for the thermal expansion. In a QH, the energy of the phonon mode changes with crystal volume, . Changes to phonon energies are usually described by a mode Grüneisen parameter, , where is the phonon energy (and is the frequency). A positive gives a reduction in mode energy with thermal expansion, increasing the vibrational entropy . At finite temperature, the extra elastic energy from thermal expansion, , is offset by the term in the free energy (1, 2). For positive , is minimized with a positive thermal expansion; for negative , a negative thermal expansion is expected.
The cubic and quartic, and higher-order terms of the interatomic potential, cause the normal modes to interact and exchange energy. This is pure anharmonicity, where the energy of a phonon is altered by the presence of other phonons irrespective of the volume of the solid. Phonon anharmonicity is essential for thermal conductivity and other thermophysical properties. Anharmonic effects increase with larger thermal atomic displacements. Sometimes this causes a misperception that pure anharmonicity is important only at high temperatures, and quasiharmonic models may be valid at low and moderate temperatures owing to low phonon populations. However, the leading-order terms of both quasiharmonicity and anharmonicity are linear in temperature (4), so, if anharmonicity is important at high temperatures, it can have the same relative importance at low temperatures, too. Furthermore, at low temperatures, the “zero-point” energy gives atom displacements that allow a nuclear quantum effect to engage the high-energy phonon modes that are half-occupied.
Finding the relative importances of quasiharmonicity and anharmonicity should be done by quantitative analysis, but, to date, the dominance of quasiharmonicity for silicon has been assumed, in part, because quasiharmonic models predict the thermal expansion with reasonable accuracy (5–11). The quasiharmonic model predicts the anomalous negative thermal expansion of silicon from 10 K to 125 K and predicts the low thermal expansion up to the melting temperature (12–16). The positive thermal expansion coefficients observed at moderate and high temperatures are anomalous in their own right—they are small compared with diamond and other materials with zincblende structures (14). Further validation of the quasiharmonic approximation was provided by measurements of the Raman mode and a few second-order Raman modes of silicon under pressure, which were accurately predicted by volume-dependent density functional theory (DFT) calculations at low temperature (17, 18). The negative Grüneisen parameters of the low-energy transverse acoustic (TA) modes have received considerable attention and have been attributed to the “openness” of the diamond cubic structure (16), the stability of angular forces (9), or entropy in general (8). Nevertheless, the precise role of the TA modes in thermal expansion remains unclear (7, 9). With increasing temperature, phonons are excited in higher-energy phonon branches, and their positive Grüneisen parameters are expected to cause the overall thermal expansion to change sign. Today, this quasiharmonic model is the workhorse for predicting thermal expansion.
“Nontrivial” phonon shifts that were not accounted for by thermal expansion were reported in an earlier experimental paper on phonon dispersions in silicon up to 300 K (3). The importance of pure anharmonicity in temperature-dependent phonon shifts at moderate and high temperatures was also found in work based on molecular dynamics, many-body perturbation theory, and ab initio calculations on silicon (19–27). The uncertainty principle and quantum distributions of nuclear positions influence the exploration of atomic potential landscapes. The zero-point motion was shown to be important, but does not by itself reproduce the correct thermal expansion coefficients (28, 29). Temperature-dependent phonon shifts from pure phonon anharmonicity with zero-point energy could give a nuclear quantum effect that alters thermophysical properties. A more detailed study of the temperature dependence of phonons in silicon is therefore appropriate because very few modes were previously assessed (3, 23, 24, 30).
We report inelastic neutron scattering measurements of phonon dispersions of silicon above 300 K along with fully anharmonic ab initio calculations using the stochastically initialized temperature-dependent effective potential method (s-TDEP). This stochastic method samples and fits the phonon potential landscape the same way a Born–Oppenheimer molecular dynamics potential energy surface is fitted to a model Hamiltonian (17). This method can accurately describe highly anharmonic systems and includes higher-order contributions of the lattice dynamic Hamiltonian, which intrinsically includes the phonon–phonon interactions as well as the nuclear quantum effects (17, 31–34). These measurements are in conflict with the quasiharmonic theory, which predicts the wrong sign for phonon shifts with temperature. We show that the crystal structure, quasiharmonicity, pure anharmonicity, and nuclear quantum effects all play important roles in the thermal expansion of silicon. Methods for both the measurements and the calculations are described in Materials and Methods and Supporting Information.
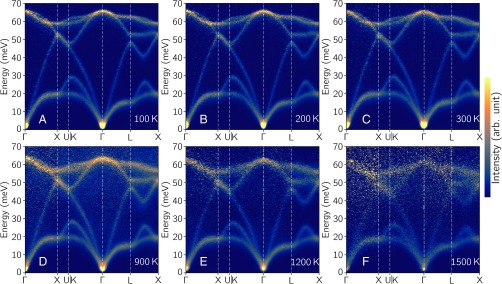
Fig. 1 shows phonon dispersions as bright intensities. The dispersions at low temperatures are in excellent agreement with previous work that used triple-axis spectrometers (3, 30). With increasing temperature, the majority of phonon modes, including the low-energy TA modes, soften in proportion to their energy. This self-similar behavior of phonon softening was reported previously (25).
Fig. 1.
Experimental phonon dispersions of silicon. Inelastic neutron scattering data of silicon were measured on the ARCS time-of-flight spectrometer at (A) 100 K, (B) 200 K, (C) 300 K, (D) 900 K, (E) 1,200 K, and (F) 1,500 K. The 4D phonon dynamical structure factors, S(q,), were reduced, multiphonon-subtracted, and “folded” into one irreducible wedge in the first Brillouin zone. Phonon dispersions are shown along high-symmetry lines and through the zone L–X.
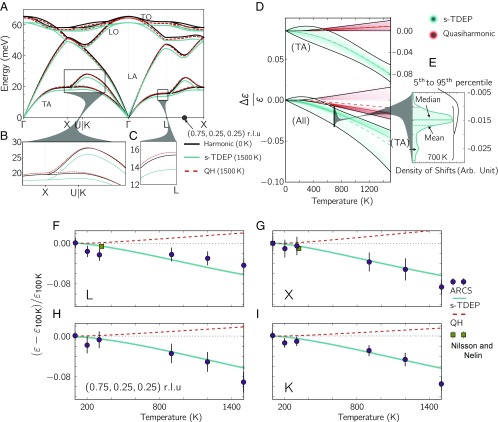
Results from calculations by the s-TDEP method (with anharmonicity and thermal expansion) and conventional quasiharmonic ab initio calculations (with no anharmonicity) are shown in Fig. 2. There are large discrepancies in the signs and magnitudes of phonon energy shifts between the two models. Most interestingly, Fig. 2 B and C shows that the s-TDEP calculations predict a reduction in phonon energy, a thermal “softening,” in the transverse modes (roughly 35 meV), whereas the quasiharmonic calculations predict an increase in phonon energy, “stiffening,” at 1,500 K [with negative Grüneisen parameters as reported previously (7–9)].
Fig. 2.
Comparison between experimental, s-TDEP, and QH ab initio calculations throughout the Brillouin zone. (A–C) Phonon dispersions of silicon from harmonic, s-TDEP, and QH ab initio DFT calculations. The (0.75, 0.25, 0.25) point is shown as a black circle marker for reference. (B and C) Magnifications from A show low-energy modes. (D) Density of fractional phonon energy shifts with temperature. The densities from all branches (s-TDEP, teal; QH, red) and densities from just the low transverse modes are offset and scaled for clarity. (E) The density of shifts from s-TDEP at 700 K. Notice that the more negative peak consists of a majority of TA modes. (F–I) Temperature-dependent phonon shifts, , of the low-energy transverse modes at the (F) L, (G) X, (H) K, and (I) (0.75, 0.25, 0.25) reciprocal lattice units (r.l.u.) points. Experimental fits of phonon centroids with standard (1 ) error bars from the present work are shown alongside calculated shifts and previously reported shifts (3).
We calculated the fractional shifts of energies, , for all phonon modes in the first Brillouin zone. The energies of all phonons were calculated using a 50 50 50 grid of q points. Fig. 2D compares the density of fractional phonon shifts from quasiharmonic and anharmonic (s-TDEP) calculations. The density of fractional shifts, , is shown in Fig. 2E from the s-TDEP method at 700 K. Compared with the quasiharmonic predictions for the TA modes (shown at the top of Fig. 2D), the anharmonic shifts are an order-of-magnitude larger, have opposite signs, and follow opposite thermal trends. Such large discrepancies allow for definitive experimental tests.
Individual phonon energies were obtained from constant q fits to the measured S(q,), as shown in Supporting Information. Fig. 2 F–I shows that the trends from the anharmonic s-TDEP calculations are in far better agreement with experiment than are the quasiharmonic trends. Thermal trends for individual phonons at the L, X, and K points (Fig. 2 F–H) are presented for their importance in the interpretation of quasiharmonic results (7). Another example for a phonon mode located away from a high-symmetry line is shown in Fig. 2I.
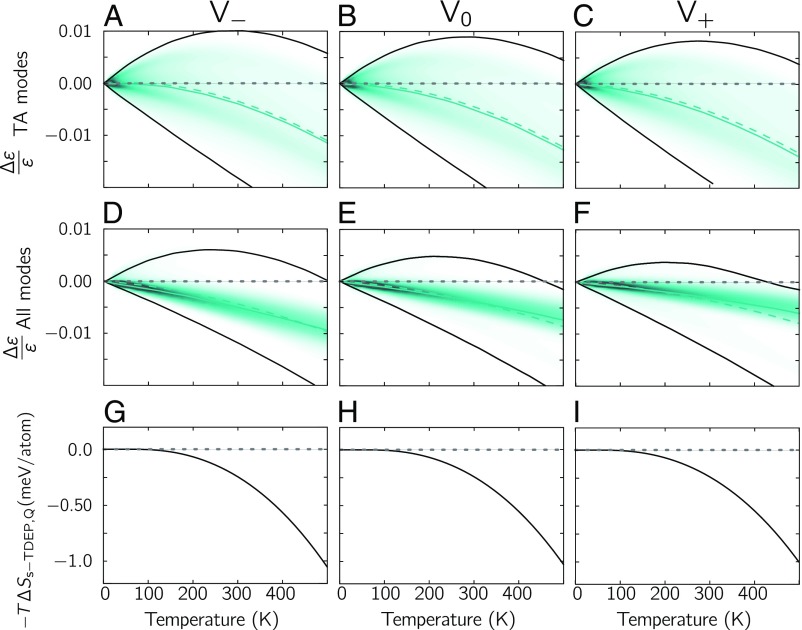
Additional s-TDEP calculations of densities of thermal shifts suggest why the quasiharmonic theory has been so apparently successful. Calculations were performed for volumes that were 1% larger and 1% smaller than the 0 K harmonic volume calculated for Fig. 2A, and the results are shown on the left and right sides of Fig. 3 for the TA modes (Fig. 3 A–C) and all phonon modes (Fig. 3 D–F). For all three volumes, at low temperatures, there is a wide spread in the thermal phonon shifts, both stiffening and softening. At low temperatures, the average thermal shift from anharmonicity at a fixed volume is, surprisingly, nearly zero. At fixed volume, the shifts of all quasiharmonic phonons are zero, of course, so the two methods agree on the average. This is seen in Fig. 3 A–C for the TA modes and in Fig. 3 D–F for all modes. Nevertheless, the average phonon energies of TA modes from the s-TDEP method show an ordinary softening with increased volume and temperature, inconsistent with the negative Grüneisen parameters from quasiharmonic calculations. At high temperatures, Fig. 3 D–F shows that all of the modes tend to soften at similar rates. Differences in vibrational entropies from the s-TDEP and quasiharmonic methods were calculated using equations in Supporting Information. The difference in entropies from the quasiharmonic and anharmonic calculations was used to obtain the shown in Fig. 3 G–I. For all volumes, the differences are negligible up to 125 K but increase at higher temperatures (Fig. 3).
Fig. 3.
Phonon shifts and entropy differences from constant volume ab initio calculations. (A–F) Density of fractional shifts with temperature at constant volumes using the s-TDEP method. The color indicates density values and the mean (dashed color line), the median (solid color line), and the 5th and 95th percentiles (black solid lines) of the density are also shown. Quasiharmonic predictions are the dashed zero lines in A–F. (G–I) Corresponding constant volume differences between the QH and s-TDEP in free energies from vibrational entropy with temperature. Calculations are shown for (A, D, and G) 99% of 0 K volume, (B, E, and H) 0K volume, and (C, F, and I) 101% of 0 K volume.
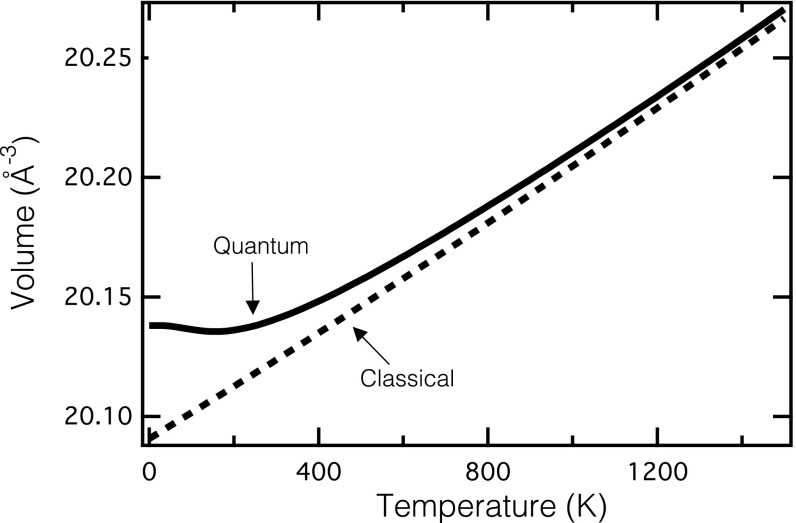
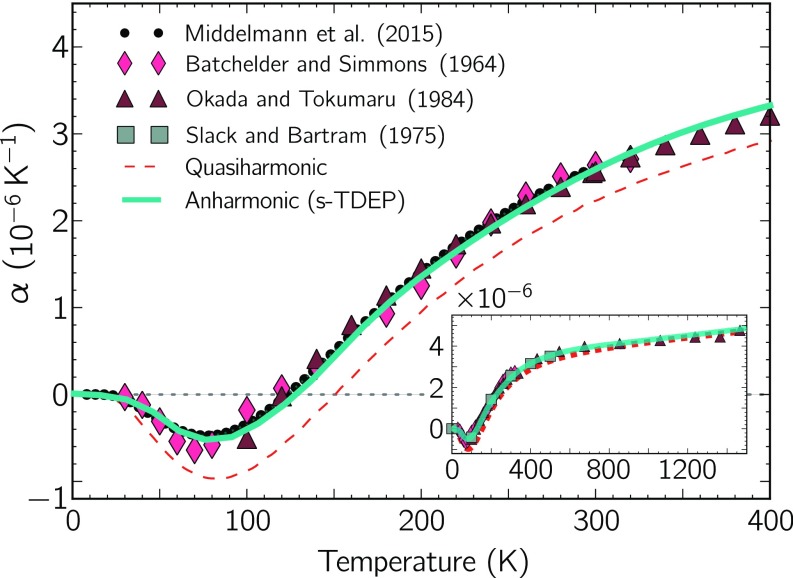
A quasiharmonic model with negative Grüneisen parameters gives a physically incorrect explanation of thermal expansion, although some of its predictions of average properties are preserved by gross cancellations of errors. As described in Supporting Information, zero-point energy () in Eq. S6 proves essential for an anharmonic model to predict the negative thermal expansion of silicon (Fig. 4). Nuclear quantum effects give nonzero anharmonic couplings between all phonons, even modes of higher energy that are not excited thermally at low temperature. These anharmonic couplings alter the self-energies of the lower-energy phonons that are excited at low temperatures, altering the volume dependence of the free energy. Calculated coefficients of linear thermal expansion are in excellent agreement with experiments (Fig. 5). Not only are quantum effects essential at lower temperatures, but differences persist up to melting temperatures. Varying the zero-point motion from changes in nuclear mass allows for an interesting engineering opportunity, too (29, 35–37).
Fig. 4.
Volume per atom as a function of temperature for silicon obtained from classical and quantum mechanical free energies.
Fig. 5.
Calculated and experimental coefficients of linear thermal expansion in silicon. Calculated coefficients are from minimized free energies using Eq. S1 (s-TDEP, teal solid line; QH, red dashed line). Experimental values are shown as colored markers (12–15). (Inset) Calculations and experimental values at higher temperatures.
Measurements of the phonon dispersions of single-crystal silicon from 100 K to 1,500 K showed thermal shifts that contradict the trends predicted by the widely accepted QH, even at low temperatures. Pure phonon anharmonicity, i.e., phonon–phonon interactions, dominate the phonons in silicon from low to high temperatures, altering the effective interatomic potential and causing both positive and negative shifts of phonon energies. At low temperatures, the zero-point quantum occupancies of high-energy vibrational modes alter the energies of low-energy modes through anharmonic coupling. This nuclear quantum effect with anharmonicity (and quasiharmonicty) is the essential cause of the negative thermal expansion of silicon. The crystal structure, anharmonicity, and nuclear quantum effects of silicon all play important roles in the thermal expansion of silicon, and could be essential in other technologically important materials.
Materials and Methods
For a detailed description of methods, see Supporting Information.
The experiments used a high-purity single crystal of silicon (mass 28.5 g) with 110 orientation, machined into a tube for optimal neutron scattering properties. The sample was rotated in a furnace on a direct geometry time-of-flight inelastic neutron scattering spectrometer called wide-angular range chopper spectrometer (ARCS) (38) at the Spallation Neutron Source at Oak Ridge National Laboratory. For each temperature, the 4D S(q,) data were reduced and multiphonon scattering was subtracted to give all phonon dispersions in the irreducible wedge of the first Brillouin zone. The multiphonon scattering produces a relatively smooth background between the phonon dispersions and was determined to produce the majority of the background intensity (Supporting Information) (39). Our “folding” technique of summing all of the S(q,) data (from 100 Brillouin zones) into an irreducible wedge increases the signal strength, suppresses polarization effects that alter intensities in some Brillouin zones (39), and averages out any possible effects of “anharmonic interference” (40).
All ab initio calculations were performed with the Vienna Ab Initio Simulation Package (VASP) (41–47). An s-TDEP (17, 31, 33, 48) was implemented to obtain phonon shifts with temperature, including intrinsic phonon anharmonicities and nuclear quantum effects. Quasiharmonic calculations were also conducted as described previously (25).
Supplementary Material
Acknowledgments
The authors thank F. H. Saadi, A. Swaminathan, I. Papusha, and Y. Ding for assisting in sample preparation and discussions. Research at Oak Ridge National Laboratory’s Spallation Neutron Source (SNS) was sponsored by the Scientific User Facilities Division, Basic Energy Sciences (BES), Department of Energy (DOE). This work used resources from National Energy Research Scientific Computing Center (NERSC), a DOE Office of Science User Facility supported by the Office of Science of the US Department of Energy under Contract DE-AC02-05CH11231. Support from the Swedish Research Council Program 637-2013-7296 is also gratefully acknowledged. Supercomputer resources were provided by the Swedish National Infrastructure for Computing. This work was supported by the DOE Office of Science, BES, under Contract DE-FG02-03ER46055.
Footnotes
The authors declare no conflict of interest.
This article is a PNAS Direct Submission. A.M. is a guest editor invited by the Editorial Board.
This article contains supporting information online at www.pnas.org/lookup/suppl/doi:10.1073/pnas.1707745115/-/DCSupplemental.
References
- 1.Fultz B. Vibrational thermodynamics of materials. Prog Mater Sci. 2010;55:247–352. [Google Scholar]
- 2.Fultz B. Phase Transitions in Materials. Cambridge Univ Press; Cambridge, UK: 2014. [Google Scholar]
- 3.Nilsson G, Nelin G. Study of the homology between silicon and germanium by thermal-neutron spectrometry. Phys Rev B. 1972;6:3777–3786. [Google Scholar]
- 4.Maradudin AA, Fein AE. Scattering of neutrons by an anharmonic crystal. Phys Rev. 1962;128:2589–2608. [Google Scholar]
- 5.Biernacki S, Scheffler M. Negative thermal expansion of diamond and zinc-blende semiconductors. Phys Rev Lett. 1989;63:290–293. doi: 10.1103/PhysRevLett.63.290. [DOI] [PubMed] [Google Scholar]
- 6.Fleszar A, Gonze X. First-principles thermodynamical properties of semiconductors. Phys Rev Lett. 1990;64:2961. doi: 10.1103/PhysRevLett.64.2961. [DOI] [PubMed] [Google Scholar]
- 7.Wei S, Li C, Chou MY. Ab initio calculation of thermodynamic properties of silicon. Phys Rev B. 1994;50:14587–14590. doi: 10.1103/physrevb.50.14587. [DOI] [PubMed] [Google Scholar]
- 8.Liu ZK, Wang Y, Shang S. Thermal expansion anomaly regulated by entropy. Sci Rep. 2014;4:7043. doi: 10.1038/srep07043. [DOI] [PMC free article] [PubMed] [Google Scholar]
- 9.Xu CH, Wang CZ, Chan CT, Ho KM. Theory of the thermal expansion of Si and diamond. Phys Rev B. 1991;43:5024–5027. doi: 10.1103/physrevb.43.5024. [DOI] [PubMed] [Google Scholar]
- 10.Baroni S, de Gironcoli S, Dal Corso A, Giannozzi P. Phonons and related crystal properties from density-functional perturbation theory. Rev Mod Phys. 2001;73:515–562. [Google Scholar]
- 11.Rignanese GM, Michenaud JP, Gonze X. Ab initio study of the volume dependence of dynamical and thermodynamical properties of silicon. Phys Rev B. 1996;53:4488–4497. doi: 10.1103/physrevb.53.4488. [DOI] [PubMed] [Google Scholar]
- 12.Middelmann T, Walkov A, Bartl G, Schödel R. Thermal expansion coefficient of single-crystal silicon from 7 K to 293 K. Phys Rev B. 2015;92:174113. [Google Scholar]
- 13.Okada Y, Tokumaru Y. Precise determination of lattice parameter and thermal expansion coefficient of silicon between 300 and 1500 K. J Appl Phys. 1984;56:314–320. [Google Scholar]
- 14.Slack GA, Bartram SF. Thermal expansion of some diamondlike crystals. J Appl Phys. 1975;46:89–98. [Google Scholar]
- 15.Batchelder DN, Simmons RO. Lattice constants and thermal expansivities of silicon and of calcium fluoride between 6° and 322°K. J Chem Phys. 1964;41:2324–2329. [Google Scholar]
- 16.Shah JS, Strauman ME. Thermal expansion behavior of silicon at low temperatures. Solid State Commun. 1972;10:159–162. [Google Scholar]
- 17.Hellman O, Steneteg P, Abrikosov IA, Simak SI. Temperature dependent effective potential method for accurate free energy calculations of solids. Phys Rev B. 2013;87:104111. doi: 10.1021/acs.jpca.6b08633. [DOI] [PMC free article] [PubMed] [Google Scholar]
- 18.Weinstein BA, Piermarini GJ. Raman scattering and phonon dispersion in Si and GaP at very high pressure. Phys Rev B. 1975;12:1172–1186. [Google Scholar]
- 19.Debernardi A, Baroni S, Molinari E. Anharmonic phonon lifetimes in semiconductors from density-functional perturbation theory. Phys Rev Lett. 1995;75:1819–1822. doi: 10.1103/PhysRevLett.75.1819. [DOI] [PubMed] [Google Scholar]
- 20.Narasimhan S, Vanderbilt D. Anharmonic self-energies of phonons in silicon. Phys Rev B. 1991;43:4541–4544. doi: 10.1103/physrevb.43.4541. [DOI] [PubMed] [Google Scholar]
- 21.Balkanski M, Wallis RF, Haro E. Anharmonic effects in light scattering due to optical phonons in silicon. Phys Rev B. 1983;28:1928–1934. [Google Scholar]
- 22.Wang CZ, Chan CT, Ho KM. Empirical tight-binding force model for molecular-dynamics simulation of Si. Phys Rev B. 1989;39:8586–8592. doi: 10.1103/physrevb.39.8586. [DOI] [PubMed] [Google Scholar]
- 23.Menéndez J, Cardona M. Temperature dependence of the first-order Raman scattering by phonons in Si, Ge, and -Sn: Anharmonic effects. Phys Rev B. 1984;29:2051–2059. [Google Scholar]
- 24.Tsu R, Hernandez JG. Temperature dependence of silicon Raman lines. Appl Phys Lett. 1982;41:1016–1018. [Google Scholar]
- 25.Kim DS, et al. Phonon anharmonicity in silicon from 100 to 1500 K. Phys Rev B. 2015;91:014307. [Google Scholar]
- 26.Debernardi A. Anharmonic effects in the phonons of III-V semiconductors: First principles calculations. Solid State Commun. 1999;113:1–10. [Google Scholar]
- 27.Lang G, et al. Anharmonic line shift and linewidth of the Raman mode in covalent semiconductors. Phys Rev B. 1999;59:6182–6188. [Google Scholar]
- 28.Allen PB. Anharmonic phonon quasiparticle theory of zero-point and thermal shifts in insulators: Heat capacity, bulk modulus, and thermal expansion. Phys Rev B. 2015;92:064106. [Google Scholar]
- 29.Herrero CP, Ramírez R. Path-integral simulation of solids. J Phys Condens Matter. 2014;26:233201. doi: 10.1088/0953-8984/26/23/233201. [DOI] [PubMed] [Google Scholar]
- 30.Brockhouse BN. Lattice vibrations in silicon and germanium. Phys Rev Lett. 1959;2:256–258. [Google Scholar]
- 31.Klein ML, Horton GK. The rise of self-consistent phonon theory. J Low Temp Phys. 1972;9:151–166. [Google Scholar]
- 32.Shulumba N, Hellman O, Minnich AJ. Intrinsic localized mode and low thermal conductivity of PbSe. Phys Rev B. 2017;95:014302. doi: 10.1103/PhysRevLett.119.185901. [DOI] [PubMed] [Google Scholar]
- 33.Errea I, Calandra M, Mauri F. Anharmonic free energies and phonon dispersions from the stochastic self-consistent harmonic approximation: Application to platinum and palladium hydrides. Phys Rev B. 2014;89:064302. [Google Scholar]
- 34.Wallace DC. Thermodynamics of Crystals. Wiley; New York: 1972. [Google Scholar]
- 35.Herrero CP, Ramírez R, Cardona M. Isotope effects on the lattice parameter of cubic SiC. Phys Rev B. 2009;79:012301. [Google Scholar]
- 36.Herrero CP. Dependence of the silicon lattice constant on isotopic mass. Solid State Commun. 1999;110:243–246. [Google Scholar]
- 37.Noya JC, Herrero CP, Ramírez R. Isotope dependence of the lattice parameter of germanium from path-integral Monte Carlo simulations. Phys Rev B. 1997;56:237–243. [Google Scholar]
- 38.Abernathy DL, et al. Design and operation of the wide angular-range chopper spectrometer ARCS at the spallation neutron source. Rev Sci Instrum. 2012;83:015114. doi: 10.1063/1.3680104. [DOI] [PubMed] [Google Scholar]
- 39.Squires GL. Introduction to the Theory of Thermal Neutron Scattering. Cambridge Univ Press; Cambridge, UK: 2012. [Google Scholar]
- 40.Glyde HR. Interference effects in neutron and X ray scattering. Can J Phys. 1974;52:2281–2298. [Google Scholar]
- 41.Kresse G, Hafner J. Ab initio molecular dynamics for liquid metals. Phys Rev B. 1993;47:558–561. doi: 10.1103/physrevb.47.558. [DOI] [PubMed] [Google Scholar]
- 42.Kresse G, Hafner J. Ab initio molecular-dynamics simulation of the liquid-metal-amorphous-semiconductor transition in germanium. Phys Rev B. 1994;49:14251–14269. doi: 10.1103/physrevb.49.14251. [DOI] [PubMed] [Google Scholar]
- 43.Kresse G, Furthmüller J. Efficiency of ab-initio total energy calculations for metals and semiconductors using a plane-wave basis set. Comput Mater Sci. 1996;6:15–50. doi: 10.1103/physrevb.54.11169. [DOI] [PubMed] [Google Scholar]
- 44.Kresse G, Furthmüller J. Efficient iterative schemes for ab initio total-energy calculations using a plane-wave basis set. Phys Rev B. 1996;54:11169–11186. doi: 10.1103/physrevb.54.11169. [DOI] [PubMed] [Google Scholar]
- 45.Mattsson AE, et al. The AM05 density functional applied to solids. J Chem Phys. 2008;128:084714. doi: 10.1063/1.2835596. [DOI] [PubMed] [Google Scholar]
- 46.Mattsson AE, Armiento R. Implementing and testing the AM05 spin density functional. Phys Rev B. 2009;79:155101. [Google Scholar]
- 47.Armiento R, Mattsson AE. Functional designed to include surface effects in self-consistent density functional theory. Phys Rev B. 2005;72:085108. [Google Scholar]
- 48.Hellman O, Abrikosov IA. Temperature-dependent effective third-order interatomic force constants from first principles. Phys Rev B. 2013;88:144301. [Google Scholar]
- 49.Stone MB, Niedziela JL, Loguillo MJ, Overbay MA, Abernathy DL. A radial collimator for a time-of-flight neutron spectrometer. Rev Sci Instrum. 2014;85:085101. doi: 10.1063/1.4891302. [DOI] [PubMed] [Google Scholar]
- 50. Mantid (2013) Manipulation and analysis toolkit for instrument data. Mantid Project. Available at https://dx.doi.org/10.5286/SOFTWARE/MANTID. Accessed March 2, 2014.
- 51.Arnold O, et al. Mantid—Data analysis and visualization package for neutron scattering and SR experiments. Nucl Instrum Methods Phys Res A. 2014;764:156–166. [Google Scholar]
- 52.Ewings RA, et al. Horace: Software for the analysis of data from single crystal spectroscopy experiments at time-of-flight neutron instruments. Nucl Instrum Methods Phys Res A. 2016;834:132–142. [Google Scholar]
- 53.Li CW, et al. Orbitally driven giant phonon anharmonicity in SnSe. Nat Phys. 2015;11:1063–1069. [Google Scholar]
- 54.Blochl PE. Projector augmented-wave method. Phys Rev. 1994;B50:17953–17979. doi: 10.1103/physrevb.50.17953. [DOI] [PubMed] [Google Scholar]
- 55.Gonze X, Lee C. Dynamical matrices, born effective charges, dielectric permittivity tensors, and interatomic force constants from density-functional perturbation theory. Phys Rev B. 1997;55:10355–10368. [Google Scholar]
- 56.Sun J, et al. Accurate first-principles structures and energies of diversely bonded systems from an efficient density functional. Nat Chem. 2016;8:831–836. doi: 10.1038/nchem.2535. [DOI] [PubMed] [Google Scholar]
- 57.Yao Y, Kanai Y. Plane-wave pseudopotential implementation and performance of SCAN meta-GGA exchange-correlation functional for extended systems. J Chem Phys. 2017;146:224105. doi: 10.1063/1.4984939. [DOI] [PubMed] [Google Scholar]
- 58.Dove MT. Introduction to Lattice Dynamics. Cambridge Univ Press; Cambridge, UK: 1993. [Google Scholar]
Associated Data
This section collects any data citations, data availability statements, or supplementary materials included in this article.


