Abstract
Multimodality therapies are used to manage patients with hepatocellular carcinoma (HCC), although advanced HCC is incurable. Oncolytic virus therapy is probably the next major breakthrough in cancer treatment. The third‐generation oncolytic herpes simplex virus type 1 (HSV‐1) T‐01 kills tumor cells without damaging the surrounding normal tissues. Here we investigated the antitumor effects of T‐01 on HCC and the host's immune response to HCC cells. The cytopathic activities of T‐01 were tested in 14 human and 1 murine hepatoma cell line in vitro. In various mouse xenograft models, HuH‐7, KYN‐2, PLC/PRF/5 and HepG2 human cells and Hepa1‐6 murine cells were used to investigate the in vivo efficacy of T‐01. T‐01 was cytotoxic to 13 cell lines (in vitro). In mouse xenograft models of subcutaneous, orthotopic and peritoneal tumor metastasis in athymic mice (BALB/c nu/nu), the growth of tumors formed by the human HCC cell lines and hepatoblastoma cell line was inhibited by T‐01 compared with that of mock‐inoculated tumors. In a bilateral Hepa1‐6 subcutaneous tumor model in C57BL/6 mice, the growth of tumors inoculated with T‐01 was inhibited, as was the case for contralateral tumors. T‐01 also significantly reduced tumor growth. T‐01 infection significantly enhanced antitumor efficacy via T cell‐mediated immune responses. Results demonstrate that a third‐generation oncolytic HSV‐1 may serve as a novel treatment for patients with HCC.
Keywords: antitumor immunity, herpes simplex virus, human hepatocellular carcinoma, oncolytic immunotherapy, oncolytic virus
1. INTRODUCTION
Hepatocellular carcinoma (HCC) is the fifth and the eighth most common malignancy in men and women, respectively, and more than 500 000 new cases are diagnosed worldwide each year.1, 2 The long‐term prognosis of patients with HCC who are treated with curative intent is unsatisfactory, and the efficacies of available chemotherapeutic agents are limited.3, 4 Therefore, novel and effective curative and adjuvant therapies are urgently required.
Recently, oncolytic virus therapy has been recognized as a promising new therapeutic approach for cancer treatment.5 The use of conditionally replicating herpes simplex virus type 1 (HSV‐1) that specifically kills tumor cells is an attractive strategy for HCC therapy. Oncolytic HSV‐1 (oHSV) contains mutations in genes associated with virulence, viral DNA synthesis, or both, which can limit virus replication to cancer cells and, thus, oHSV specifically destroys only tumor cells.6 Furthermore, oHSV is not associated with cross‐resistance to other therapy strategies, such as chemotherapy.6
Oncolytic HSV‐1 is in phase I‐III clinical trials for treating solid tumors.7, 8, 9, 10, 11 One of the first mutants, oHSV G207, was derived from HSV‐1 strain F with deletions in both copies of the γ34.5 gene and harbors a lacZ insertion that inactivates the ICP6 gene, which permits replication in cancer cells that can complement these mutations but not in normal cells, including neurons.12 oHSV T‐Vec is a double‐mutated HSV‐1 with deletions in the γ34.5 and α47 genes, and the human granulocyte‐macrophage colony‐stimulating factor (GM‐CSF) gene inserted into the deleted γ34.5 loci.10 T‐Vec (talimogene laherparepvec) was approved for melanoma by the FDA in the USA and was subsequently approved in Europe and Australia.13, 14 The mutant G47Δ was derived from G207 by introducing a third deletion within the α47 gene that overlaps the US11 promoter.15, 16, 17, 18, 19, 20 Compared with G207, G47Δ replicates more efficiently and increases the presentation of the MHC class I molecule while maintaining the safety profile of G207.15 These properties enabled the development of an enhanced cytotoxic lymphocyte response against tumor cells and enhanced the therapeutic efficacy of the virus, as indicated by the results acquired from studies of animal models of brain tumors.15 Furthermore, Fukuhara et al5 demonstrate that an induction of specific antitumor immunity in the course of oncolytic activities plays an important role in presenting antitumor effects.
In the present study, we used T‐01,21 which has a genomic structure similar to that of G47Δ. In T‐01, the α47 and γ34.5 loci are deleted and the LacZ gene replaces the ICP6 gene. Deletion of the α47 loci enhanced antitumor immune responses following treatment.21 We examined the antitumor activities of T‐01 in HCC cell lines and mouse tumor xenograft models, and evaluated the host's immune response to HCC cells.
2. MATERIALS AND METHODS
2.1. Cell lines
Human HCC cell lines (HuH‐7, Li‐7, JHH‐1, JHH2, JHH5, JHH6, JHH7, HLE, HLF, PLC/PRF/5 and huH‐1), a human hepatoblastoma (HBC) cell line (HuH‐6) and a murine hepatoma (Hepa1‐6) cell line were obtained from the Japanese Collection of Research Bioresources (Osaka, Japan). Human HBC cells (HepG2) and an African green monkey kidney cell line (Vero) were obtained from the RIKEN BioResource Center (Tsukuba, Japan). Dr Hirohisa Yano (Kurume University, Fukuoka, Japan) provided the human HCC cell line KYN‐2.
HuH‐7, JHH‐1, HLE, HLF, PLC/PRF/5, huH‐1, HuH‐6, HepG2, Hepa1‐6 and Vero cells were cultured in DMEM containing 10% FBS (GIBCO, Grand Island, New York, USA). JHH2, JHH5, JHH6 and JHH7 cells were cultured in Williams’ medium E containing 10% FBS. KYN‐2 and Li‐7 cells were cultured in RPMI1640 containing 10% FBS.
2.2. Plasmids, viruses and transfection
Firefly (Photinus pyralis) luciferase (luc) cDNA from pGL3 basic (Promega, Madison, Wisconsin, USA) was inserted into the pLVSIN‐CMV Pur retroviral vector (Takara Bio/Clontech, Palo Alto, California, USA) to generate pLVSIN‐CMV‐luc. Lenti‐X 293T packaging cells (Takara Bio/Clontech) were cotransfected with pLVSIN‐CMV‐luc and a Lentiviral HTX Packaging System (Takara Bio/Clontech) using X‐Fect Transfection Reagent (Takara Bio/Clontech). Supernatants from transfected Lenti‐X 293T cells were added to subconfluent cells in the presence of polybrene (8 μg/mL final concentration; Sigma‐Aldrich, Buchs SG, Switzerland). The transduced cells were propagated in medium containing 15 μg/mL puromycin (Sigma‐Aldrich) and the transfected cells were named HuH‐7‐luc, KYN2‐luc and HepG2‐luc.
The details for constructing the T‐01 as HSV‐1 mutant are as published previously.21 Virus stocks were purified and concentrated as described with minor modifications.22
2.3. Animals
Five‐week‐old male C57BL/6 mice and athymic mice (BALB/c nu/nu) were purchased from Japan SLC (Shizuoka, Japan) and used in experiments at 6 weeks of age. All mice were caged in groups of 4 or fewer. Mice were anesthetized with an intraperitoneal injection of pentobarbital. The mouse studies were conducted according to the guidelines approved by the Animal Care and Use Committee of Kansai Medical University.
2.4. In vitro cytotoxicity and virus replication assay
Assays were performed as previously described.17, 21 Briefly, cells were infected with virus or mock for 1 hour and incubated at 37°C in DMEM supplemented with 1% heat‐inactivated FBS. The number of surviving cells (cytotoxicity) was expressed as a percentage of the mock‐infected controls. Cells were infected with T‐01 at a multiplicity of infection (MOI) = 0.01 and incubated at 37°C for 48 hours. The titer of the progeny virus stock was determined using a plaque assay with Vero cells. Each experiment was performed in triplicate.
2.5. Therapy of subcutaneous tumors
Tumors were generated by subcutaneously injecting tumor cells (5 × 10⁶) into the left flank (HuH‐7, KYN‐2, PLC/PRF/5 and HepG2 cells) or bilateral flanks (Hepa 1‐6 cells) of athymic mice (HuH‐7, KYN‐2, PLC/PRF/5 and HepG2 cells) or C57BL/6 mice (Hepa 1‐6 cells). When tumors reached 5‐7 mm in diameter, animals were randomized, and tumors were inoculated with virus (2 × 10⁶ pfu) or mock in 20 μL PBS(−) containing 10% glycerol inoculated on the left side (day 0). Viruses were similarly inoculated on day 3. Tumor size was measured using Vernier calipers and tumor growth was determined by measuring the tumor volume (0.5 × [long axis] × [short axis]2) twice each week. The mice were killed if they appeared moribund or the maximum diameter of tumors exceeded 20 mm. The subcutaneous tumors were excised, fixed in formaldehyde and embedded in paraffin for histological analysis.
C57BL/6 mice harboring established subcutaneous Hepa1‐6 tumors in both flanks were used to determine the efficacy of T‐01 therapy in immunocompetent mice engrafted with murine hepatoma cells.
2.6. Orthotopic tumor therapy in mice
Orthotopic tumors were generated by injecting 5 × 10⁶ HuH‐7‐Luc, KYN‐2‐Luc or HepG2‐Luc cells into the left lobe of the liver of athymic mice under laparotomy. When an orthotopic tumor was confirmed using an in vivo imaging system (IVIS) after implantation, mice were randomized, and the mock or virus (2 × 10⁶ pfu) in 20 μL PBS(−) containing 10% glycerol preparation was inoculated into the tumor. Mice inoculated with HuH‐7‐Luc cells were killed 21 days after initial treatment, and tumor volumes were determined (5 or 10 mice per group).
2.7. Peritoneal metastasis tumor therapy in mice
Peritoneal metastatic tumors were generated by intraperitoneally injecting KYN‐2‐Luc cells (5 × 10⁶) into athymic mice or Hepa1‐6 cells (5 × 10⁶) into C57BL/6 mice. When peritoneal metastasis was detected, the mice were randomized, and mock or virus (2 × 10⁶ pfu, twice) in 20 μL PBS(−) containing 10% glycerol was inoculated intraperitoneally or into the caudal vein on days 0 and 3.
2.8. Histochemical analysis
2.8.1. HE staining
Mice were killed 7 days after inoculation of T‐01. Subcutaneous tumor tissues of virus‐ or mock‐inoculated mice were embedded in 10% formalin, and sections (5‐μm thick) were mounted on silanized slides (Dako Cytomation, Glostrup, Denmark) and stained with HE.
2.8.2. Immunohistochemical analysis of herpes simplex virus type 1
Sequential sections were cut and subjected to immunohistochemical analysis to detect HSV‐1. The sections were treated to inhibit endogenous peroxidase activity and prevent nonspecific binding of the secondary antibody and then incubated with a rabbit polyclonal anti‐HSV‐1 antibody (1:50 000) (Dako Cytomation), rinsed, and then incubated with an HRP‐conjugated goat anti‐rabbit IgG antibody (Nichirei Bioscience, Tokyo, Japan). The positive site was visualized by a brownish color using 3‐3′diaminobenzidine (DAB) as a chromogenic substrate. Sections were then counterstained with hematoxylin.
2.8.3. Analysis of CD4 and CD8 expression
Mice were killed 14 days after virus or mock inoculation, and subcutaneous Hepa1‐6 tumor tissues and spleens were embedded in optimal cutting temperature compound and frozen in liquid nitrogen. Sections (5‐μm thick) were mounted on silanized slides (Dako Cytomation). Samples were incubated with a rat anti‐CD4 antibody (diluted 1:5) or a rat anti‐CD8 antibody (diluted 1:10) (BD Pharmingen, CA, USA), followed by incubation with a donkey anti‐rat IgG (Jackson ImmunoResearch Laboratories, Pennsylvania, USA). The positive site was visualized by brownish color, using DAB as a chromogenic substrate. Sections were then counterstained with hematoxylin. CD4‐positive and CD8‐positive (CD4+, CD8+) and negative cells were counted in randomly selected deeply stained fields using a light microscope (×100). The mean numbers of CD4+ and CD8+ cells per mm2 were counted (positive cells per mm2, n = 3 per group).
2.9. ELISPOT assay
Assays were performed according to the manufacturer's protocols (MABTECH AB, Nacka Strrand, Sweden). Subcutaneous Hepa1‐6 tumors were established in the left flank of C57BL/6 mice and mock inoculated or inoculated with T‐01 twice (days 0 and 3). On day 14, treated mice were killed, and the splenocytes were collected. After splenocytes were re‐stimulated with pulsed Hepa1‐6 cells, the immunogenic potential of T‐01 was evaluated using ELISPOT assays to detect IFN‐γ and IL‐4. Briefly, re‐stimulated CD8+ or CD4+ target splenocytes (4 × 10⁵) were added to the plate and then effector Hepa1‐6 cells (5 × 10⁵) or untreated controls and target cells were added to the plate, which was then incubated for 24 hours at 37°C in an atmosphere containing 5% CO2. The number of spots was automatically counted using an Eliphoto system (Minerva Tech, Tokyo, Japan).
2.10. Rechallenge studies
Mice with established subcutaneous tumors formed by Hepa1‐6 cells and regressed cells after treatment using T‐01 (2 × 10⁶ pfu, twice) as well as age‐matched naïve male C57BL/6 mice were rechallenged with Hepa1‐6 cells. Hepa1‐6 cells (5 × 10⁶) were injected subcutaneously into the back, and tumor growth was observed as described previously.21 The animals were observed for 60 days.
2.11. Safety evaluation of T‐01 when injected to the liver
To evaluate safety of T‐01, T‐01 (2 × 10⁶ pfu) in 20 μL of PBS containing 10% glycerol or mock preparation was injected into the left lobe of the liver of athymic mice. Mice were monitored for clinical manifestations daily for 7 days (n = 3). The mice were killed 1 week after the injection of T‐01 or mock preparation and were subjected to analyses of serum and pathology. Before killing the mice, the blood was collected in the ophthalmic vein. Serum aspartate aminotransferase, alanine aminotransferase, γ‐glutamyltranspeptidase, amylase, alkaline phosphatase and lactate dehydrogenase were analyzed using commercial kits (Wako Pure Chemicals, Osaka, Japan). Serum urea nitrogen and creatinine were measured with Denka Seiken (Tokyo, Japan) and Alfresa Pharma (Osaka, Japan) commercial kits, respectively.
Body weight was evaluated at the start of treatment and upon death. Liver, lungs and kidneys were excised, fixed in formaldehyde, and embedded in paraffin for histological analysis.
2.12. Statistical analysis
All data are expressed as the mean ± SEM. The in vitro data and in vivo tumor‐volume data were evaluated using an unpaired t‐test. Overall survival was estimated using the Kaplan–Meier method, and the data were compared using the log‐rank test. P < .05 was considered statistically significant.
3. RESULTS
3.1. Cytopathic effects of T‐01 and virus yields in vitro
We first examined the effects of T‐01 on a panel of human HCC (12), human HBC (2) and murine hepatoma (1) cells using in vitro cytotoxicity assays. At day 4 after infection with T‐01 at MOI 0.01, cell survival was reduced to >40%‐50% in KYN‐2, huH‐1, HLF, PLC/PRF/5, JHH‐2, JHH‐6, JHH‐7, HepG2, HuH‐6 and Hepa1‐6 cells (Figure 1). No significant changes were detected in other T‐01‐infected cells. However, after infection with T‐01 at MOI 0.1, the number of surviving cells decreased to >80% in KYN‐2, huH‐1, Li‐7, JHH‐6, JHH‐7, HepG2 and HuH‐6 cells, and to >40%‐50% in HuH‐7, HLF, PLC/PRF/5, JHH‐1 JHH‐2 and Hepa1‐6 cells. No significant effects were detected in HLE and JHH‐5 cells. Together our results show that T‐01 at MOI 0.1 induced significant cell death in 13 cell lines.
Figure 1.
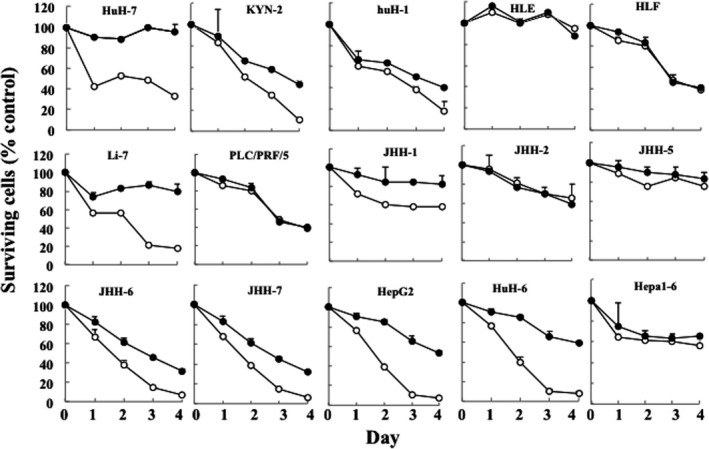
Cytotoxic activity of T‐01 in vitro. Cell lines were treated with T‐01 virus (MOI = 0.01 [filled circles] and 0.1 [open circles]) and then incubated for the indicated days. The number of surviving cells was counted and expressed as a percentage of mock‐infected controls at each time point. Data represent the mean ± SE (n = 3 per time point)
We also examined virus yields in the cell lines and found that the virus yields increased in most cells, except for JHH‐5 and JHH‐7 cells (unchanged) and HLE and JHH‐2 cells (decreased) (Figure 2). The cell lines used in these assays and the data are summarized (Table S1).
Figure 2.
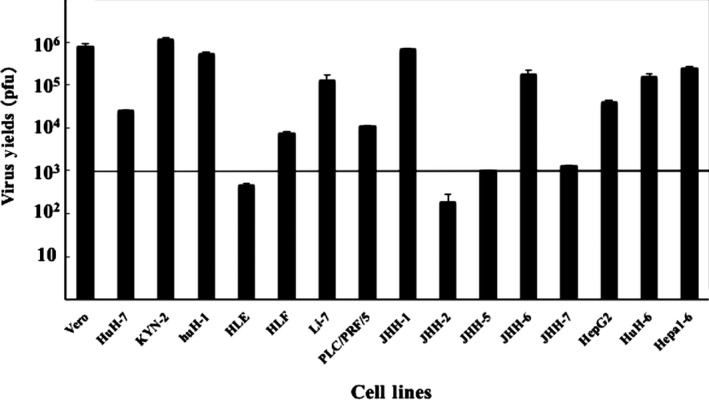
Viral replication of T‐01 in vitro. The in vitro virus yields were determined using a plaque assay 48 h after infection with T‐01 (MOI = 0.01) in Vero or hepatoma/hepatoblastoma cells (5 × 10³ pfu/well). Data represent the mean ± SE (n = 3)
3.2. Effects of T‐01 in mice with subcutaneous tumors
The efficacy of T‐01 was tested in athymic mouse models with subcutaneous tumors that were generated using human HCC and HBC cell lines (Figure 3). HuH‐7, KYN‐2, PLC/PRF/5 and HepG2 are related to hepatitis B or C viruses, and their differentiation states are shown (Table S2). Established subcutaneous tumors, which were palpable 21‐28 days after implantation, were inoculated with mock or T‐01 on day 0 or on days 0 and 3. We detected reduced growth of tumors from each cell line in mice inoculated once or twice with T‐01 compared with mock‐inoculated mice (Figure 3, top). Furthermore, 2 inoculations with T‐01 markedly extended the survival rates of mice bearing subcutaneous tumors formed by HuH‐7, KYN‐2, PLC/PRF/5 and HepG2 cells (Figure 3, bottom).
Figure 3.
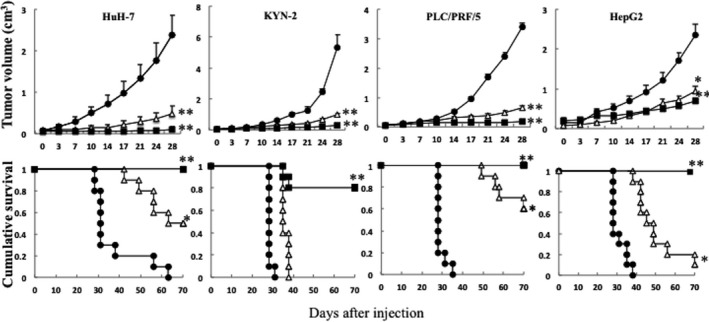
Antitumor effect of T‐01 in mice with subcutaneous tumors. Human tumor cells (HuH‐7, KYN‐2, PLC/PRF/5 and HepG2) were implanted subcutaneously into male athymic mice. Established tumors were inoculated with mock preparation (filled circles) or T‐01 (2 × 10⁶ pfu) once on day 0 (open triangles) or twice on days 0 and 3 (filled squares). Effects on tumor growth are shown in the top row; data represent the mean ± SE (n = 10 mice per time point per group). Survival is shown in the bottom row. *P < .05 and **P < .01 vs mock treatment
3.3. Effects of T‐01 on orthotopic tumors
We examined the effects of T‐01 on orthotopic tumors induced by HuH‐7‐Luc, KYN‐2‐Luc and HepG2‐Luc cells. Tumor‐bearing mice were inoculated with mock or T‐01 on day 0. The mice transplanted with HuH‐7‐Luc cells were killed 21 days later, and tumor volumes of the T‐01 and mock groups were evaluated. The tumor volumes of mice inoculated with T‐01 were markedly reduced compared with those of mock‐treated mice, with volumes upon death of 1.65 ± 0.67 and 0.025 ± 0.025 cm3 in the mock and T‐01 groups, respectively (Figure 4A, top and middle). T‐01 inoculated mice transplanted with HuH‐7‐Luc, KYN‐2‐Luc and HepG2‐Luc cells survived longer compared with the mock‐infected groups (Figure 4A bottom,B,C, respectively).
Figure 4.
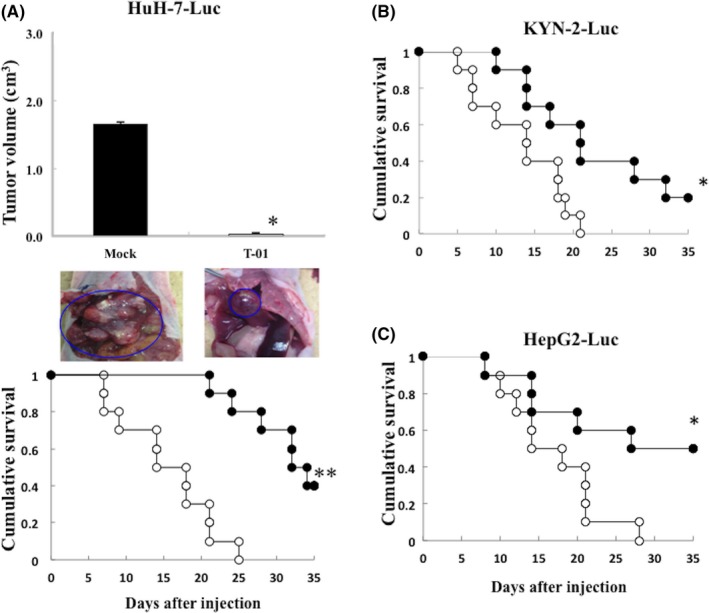
Antitumor effect of T‐01 in mice with orthotopic tumors. Human tumor cells (HuH‐7‐Luc, KYN‐2‐Luc and HepG2‐Luc) were implanted in the liver of male athymic mice. Established tumors were inoculated with mock preparation (open circles) or T‐01 (2 × 10⁶ pfu) (filled circles) once on day 0. A, Effect of T‐01 on growth of tumors from HuH‐7‐Luc cells. Tumor growth was determined by measuring the tumor volume 21 d after implantation in the mock‐ and T‐01‐treated groups (upper graph). In the middle panel, blue circles indicate orthotopic tumors in the mock‐treated and T‐01 treated mice (representative images of 5 mice in the 2 groups). Survival of mock‐treated and T‐01‐treated mice with tumors from HuH‐7‐Luc cells (A, lower panel), KYN‐2‐Luc cells (B) and HepG2‐Luc cells (C). Data represent the mean ± SE (n = 10 mice per time point per group). *P < .05 and **P < .01 vs mock treatment
3.4. Effect of T‐01 on peritoneal metastases
We established peritoneal metastatic tumors in athymic or C57BL/6 mice implanted with KYN‐2‐Luc or Hepa1‐6 cells, and inoculated mice intraperitoneally with mock or T‐01 twice (days 0 and 3). The mock‐infected mice injected with KYN‐2‐Luc and Hepa 1‐6 cells developed gross peritoneal tumor nodules and the sizes of the tumors formed in mice inoculated with T‐01 were decreased compared with mock infection (Figure 5A, right; photos in KYN‐2‐Luc cells). The T‐01 infected KYN‐2‐Luc and Hepa1‐6 mice survived longer compared with the mock‐infected groups (Figure 5A,C). For comparison, we also injected T‐01 into the caudal vein of KYN‐2‐Luc mice and found that the group inoculated intravenously with T‐01 survived as long as those inoculated intraperitoneally with T‐01 (Figure 5B).
Figure 5.
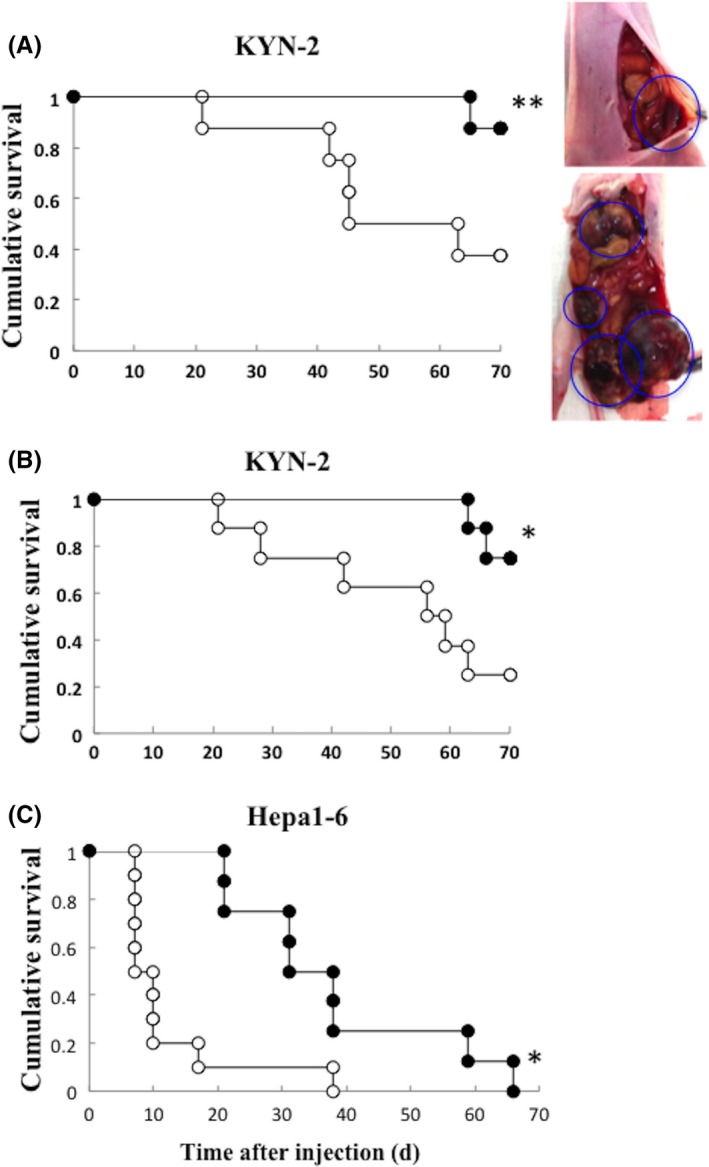
Cytopathic effects of T‐01 in mice with peritoneal metastatic tumors. Human hepatocellular carcinoma (HCC) cells (KYN‐2‐Luc) or murine hepatoma cells (Hepa1‐6) were implanted intraperitoneally in male athymic mice or in C57BL/6 mice, respectively. Photos in KYN‐2‐Luc cells (A, lower right, mock‐infected; upper right, T‐01‐infected mice with KYN‐2‐Luc cells). Graphs show survival of KYN‐2‐Luc tumors treated by intraperitoneal inoculation (A, left), KYN‐2‐Luc tumors treated by intravenous inoculation (B) and Hepa1‐6 tumors treated by intraperitoneal inoculation (C). Tumors were inoculated as indicated with mock preparation (open circles) or T‐01 (2 × 10⁶ pfu) (filled circles) twice on days 0 and 3 (n = 8 mice per group). *P < .05 and **P < .01 vs mock treatment
3.5. Efficacy of T‐01 treatment of immunocompetent mice with bilateral subcutaneous tumors formed by Hepa1‐6 cells
In general, mouse tumor cells are more resistant to oncolysis induced by HSV‐1 compared with human cells. Therefore, Hepa1‐6 tumors were established in both flanks of C57BL/6 mice, which were palpable 21 days after tumor cell injection, and the left‐sided tumors were inoculated with T‐01 twice (days 0 and 3) at 2 × 10⁴, 2 × 10⁵ or 2×10⁶ pfu. We found that doses of 2 × 10⁵ and 2 × 10⁶ pfu caused a significant reduction in tumor growth compared with controls (Figure 6A). Furthermore, the growth of the contralateral uninoculated tumors was significantly reduced by inoculation of 2 × 10⁶ pfu of T‐01 (Figure 6B). Furthermore, T‐01 once at 2 × 10⁶ pfu (day 0) also showed a significant reduction in tumor growth compared with controls, as similar results as mentioned above (data not shown).
Figure 6.
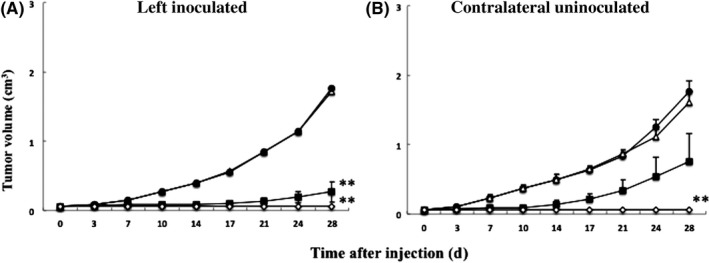
Cytopathic effects of T‐01 in immunocompetent mice with bilateral subcutaneous tumors. C57BL/6 mice were established harboring subcutaneous Hepa1‐6 tumors in their bilateral flanks. A, Left side tumors were treated by inoculation with mock (filled circles) or T‐01 at 2 × 10⁴ pfu (open triangles), 2 × 10⁵ pfu (filled squares), or 2 × 10⁶ pfu (open diamonds) twice (days 0 and 3) (n = 8 mice per group). The growth of the left inoculated (A) and contralateral uninoculated tumors (B) was measured. Data represent the mean ± SE. **P < .01 vs mock treatment
To determine whether T‐01 conferred strong antitumor immunity, C57BL/6 mice with subcutaneous tumors formed from Hepa1‐6 cells were inoculated twice with T‐01 (2 × 10⁶ pfu) or mock control. Tumors disappeared 4 weeks later, and we performed a second subcutaneous injection of Hepa1‐6 cells (5 × 10⁶) in the back of mice. After 4 weeks, none of the 10 mice inoculated with T‐01 grew tumors. In contrast, subcutaneous tumors grew rapidly in 5/10 mock‐inoculated mice (P = .016, Fisher's test; data not shown).
3.6. Induction of IFN‐γ and interleukin‐4 in mice with tumors formed by Hepa1‐6 cells
The splenocytes obtained from mice with Hepa1‐6 cell‐derived tumors that were treated with T‐01 released higher amounts of IFN‐γ compared with mock‐infected cells (Figure 7A). In contrast, there was no difference in the release of IL‐4 from splenocytes harvested from mice with or without T‐01 (Figure 7B).
Figure 7.
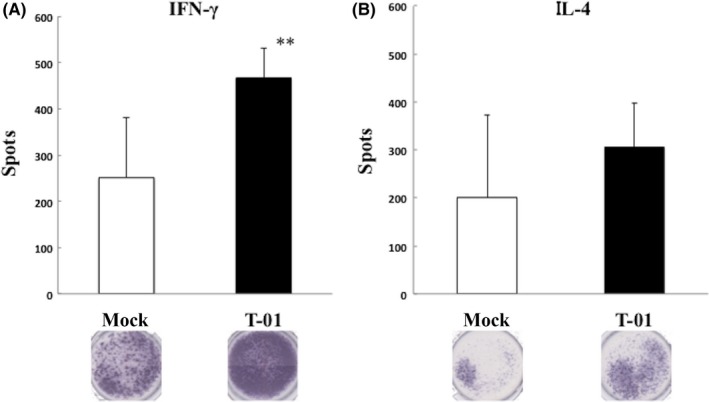
IFN‐γ and IL‐4 levels in splenocytes from Hepa1‐6 tumor‐bearing mice. C57BL/6 mice harboring established subcutaneous Hepa1‐6 tumors in the left flank were treated with mock preparation or T‐01 (2 × 10⁶ pfu) twice (days 0 and 3). IFN‐γ and IL‐4 ELISPOT assays were performed in splenocytes from treated groups. Data represent the mean ± SE (n = 3 mice per group). **P < .01 vs mock treatment
3.7. Immunohistochemical analysis of subcutaneous tumors
HE staining of the tissues of mice bearing subcutaneous tumors induced by HuH‐7 or Hepa1‐6 cells revealed that inoculation with T‐01 elicited a prominent antitumor effect, which was confirmed by the detection of necrotic cells, compared with mock‐treated mice (Figure 8, top and middle). Furthermore, strong HSV‐1 staining was observed in the necrotic cells (Figure 8, bottom).
Figure 8.
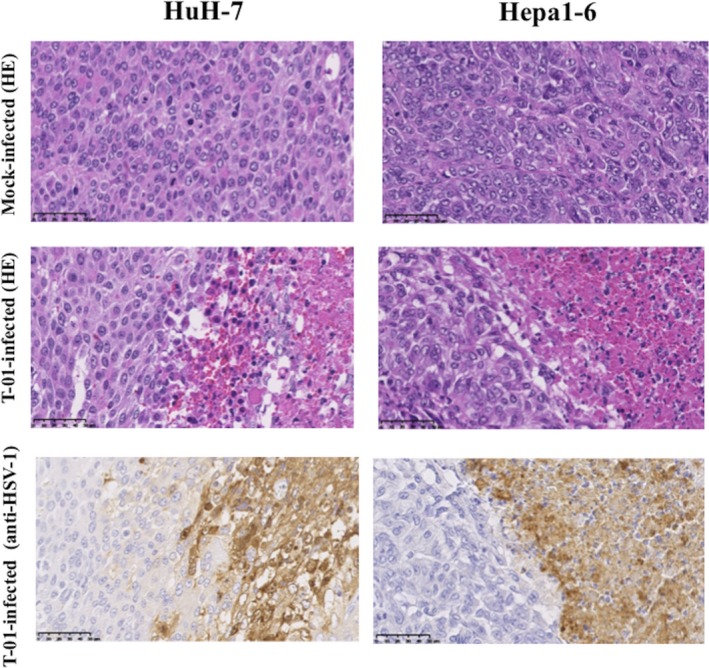
Immunohistochemical analyses of HSV‐1 in mice with subcutaneous tumors. Tumors were induced by subcutaneously injecting HuH‐7 or Hepa1‐6 cells (5 × 10⁶) into the left flank of athymic mice or C57BL/6 mice, respectively. Subcutaneous tumors were treated with mock preparation or T‐01 (2 × 10⁶ pfu) twice (days 0 and 3). Mice were killed 7 d after inoculation, and tissue sections were stained with HE or immunostained with anti‐HSV‐1 antibody. Bar = 50 μm (magnification, ×400)
The effect of T‐01 infection on the immune response to the tumor was then tested in immunocompetent mice bearing tumors formed by Hepa1‐6 cells. T cell migration into a tumor mass is a critical component of the immune response, which causes tumor regression.23 The number of CD8+ cells was significantly increased in the Hepa1‐6 tumors in T‐01‐treated and untreated flanks compared with mock‐infected mice (Figure 9). However, the numbers of CD4+ positive cells were unchanged among the 3 groups. T‐01 treatment did not influence the numbers of CD8+ and CD4+ cells in the spleen compared with the mock‐infected group. Immunohistochemical analyses of subcutaneous tumors treated with T‐01 did not reveal virus in the untreated side, and T‐01 treatment did not induce detectable pathological changes in the liver, kidney and spleen (data not shown).
Figure 9.
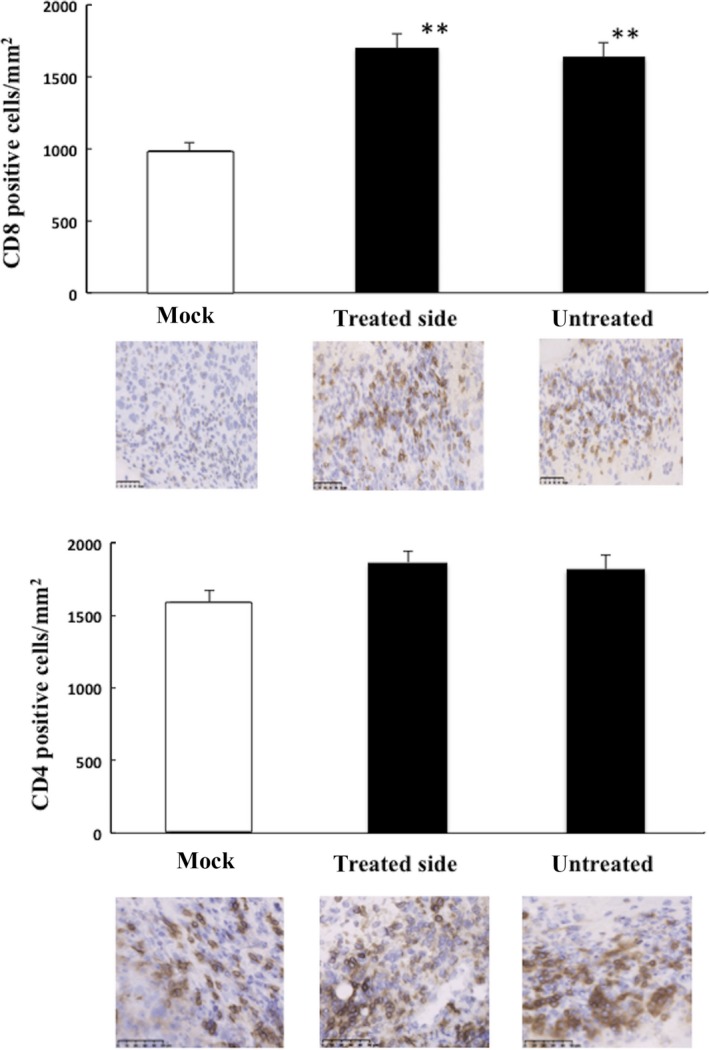
Immunohistochemical analyses of CD8 and CD4 expression in mice with subcutaneous tumors. Subcutaneous Hepa1‐6 tumors were established in both flanks of C57BL/6 mice, and the left‐side tumors were inoculated with T‐01 (2 × 10⁶ pfu) twice (days 0 and 3). Mice were killed 14 d after viral inoculation. Sections prepared from Hepa1‐6 tumors inoculated with T‐01 (treated and untreated sides) or mock preparation were immunostained for anti‐CD8 (top 2 rows) or anti‐CD4 (bottom 2 rows). The graphs present the numbers of CD8 or CD4 positive cells/mm2. Data represent the mean ± SE (n = 3 mice/group). Bar = 100 μm (magnification ×200). **P < .01 vs mock treatment
3.8. Safety of intrahepatic inoculation of T‐01
To determine whether intrahepatic inoculation of T‐01 induced cytotoxicity, we used BALB/c nu/nu mice because BALB/c mice are more susceptible to HSV‐1 infection compared with C57BL/6 mice. BALB/c nu/nu mice were inoculated intrahepatically with mock preparation or T‐01 (2 × 10⁶ pfu) and monitored daily for clinical manifestations for 7 days. All mock‐inoculated and T‐01‐inoculated mice survived without any detectable abnormalities, and there were no significant differences in blood analysis data between groups (Table S3). Furthermore, there were no significant differences in the body weights and HE staining data of liver, lungs and kidneys between mock‐inoculated and T‐01‐inoculated mice (data not shown).
4. DISCUSSION
A major goal of antitumor therapy is to specifically target tumor cells while sparing adjacent healthy tissue from destruction. Here we determined the cytopathic effects of a third‐generation oHSV T‐01 on cell lines established from human HCC, human HBC, and a murine hepatoma (in vitro) and demonstrated the therapeutic value of oHSV T‐01 in mouse models of HCC and HBC. Furthermore, we assessed the effects of T‐01 on the host's antitumor immune response in a mouse model of hepatoma.
The major causative factors associated with HCC are infection with hepatitis B (HBV) and C (HCV) viruses.24 The huH‐1, JHH‐7, PLC/PRF/5, KYN‐2 and HepG2 cell lines are related to HBV;25, 26, 27, 28 HuH‐7 is related to HCV;29 and the association of HLE, HLF, Li‐7 and JHH‐2, 5, 6, 7 with HBV is unknown. The HuH‐7 and HepG2 cell lines are well differentiated, the PLC/PRF/5 line is moderately differentiated, KYN‐2 is poorly differentiated, and HLE and HLF are undifferentiated. The states of differentiation of the other cell lines studied here are unknown. T‐01 induced cytopathic effects in vitro in most of the HCC and HBC cells used, independent of their phenotype (Figure 1). We found that the killing activity of T‐01 on HLF, PLC/PRF/5, JHH‐2 and Hepa1‐6 were uncorrelated to the amounts (pfu) of the virus (Figure 1), because HLF and PLC/PRF/5 had a tendency to be killed by their antitumor effects themself, JHH‐2 replicated rather slowly and Hepa1‐6 (mouse tumor cells) were more resistant to oncolysis induced by HSV‐1 compared with human cells.30 However, T‐01 had no detectable effect on HLE and JHH‐5 cells, likely because of the relatively low levels of T‐01 replication (Figure 2). It cannot negate the possibility that the entry efficiency of T‐01 into cells and/or the expression levels of HSV receptors on cell lines used were involved in the cytopathic activities of T‐01 in addition to the levels of T‐01 replication.31, 32, 33, 34, 35, 36 Such information may help to elucidate why some tumors are highly sensitive to oHSV, and may lead to methods for selecting patients with the most sensitive tumors in oHSV therapy. We analyzed the expression levels of the herpesvirus entry mediator A (HVEM/HveA) and nectin‐1 (HveC/CD111) on cell lines such as HuH‐7, PLC/PRF/5, HLE and JHH‐5. By flow cytometry analysis, we found that cellular sensitivity to killing by T‐01 was presumably uncorrelated to the expression of HVEM and nectin‐1 (data not shown).
To investigate the antitumor effects of T‐01 in vivo, we established subcutaneous tumor models of HCC using 4 cell lines. We selected cell lines related to HBV and HCV, which were well differentiated with a high frequency of occurrence and a poorly differentiated phenotype that is associated with poor prognosis. T‐01 was administered to subcutaneous tumors once or twice. A higher survival rate and a significant reduction in tumor growth were observed in T‐01‐treated tumors compared with controls (Figure 3). Most subcutaneous tumors gradually regressed, suggesting that T‐01 may effectively inhibit HCC with different malignant phenotypes.
Next, we examined the antitumor effect of T‐01 using an orthotopic model that reflects clinical conditions (Figure 4). Furthermore, we examined the effects of T‐01 on a mouse model of peritoneal dissemination using KYN‐2 cells (Figure 5A,B), because poorly differentiated adenocarcinomas frequently disseminate to the peritoneum. Ascites frequently accumulate in patients with peritoneal metastasis, and ascites fluid is expected to be rich in anti‐HSV antibodies, because its immunoglobulin G content reflects that of blood.37 We examined the effects of T‐01 on peritoneal dissemination in an immunocompetent mouse strain engrafted with Hepa1‐6 cells (Figure 5C). Moreover, a model of orthotopic or peritoneal metastasis is likely more informative compared with a model of a subcutaneous tumor. In our next study, we will confirm the antitumor efficacy and safety of T‐01 by using fresh tissue of clinical tumor material, to ensure adequate clinical applications.38 The significant efficacy and safety in preclinical models can appear the therapeutic benefits. We will confirm the antitumor efficacy and safety of T‐01 against clinical tumor material, to allow adequate clinical application.
Tumor cells infected with an α47‐deficient HSV‐1 vector express increased levels of MHC class I molecules and stimulate immune cells to a greater extent compared with cells infected with an α47‐intact HSV‐1 vector.15 Furthermore, in immunocompetent mice, oHSV inoculated into subcutaneous tumors is not detected in remote, uninoculated tumors.21 We show here that in immunocompetent mice bearing subcutaneous Hepa1‐6 tumors in both flanks, T‐01 infection inhibited the growth of the contralateral uninoculated tumors as well as that of the inoculated tumors compared with mock infection (Figure 6). Moreover, splenocytes from mice with Hepa1‐6‐derived tumors inoculated with T‐01 released higher levels of IFN‐γ, indicating the increased number of lymphocytes that specifically recognized immune stimulation of splenocytes (Figure 7). Furthermore, the numbers of CD8+ cells that infiltrated the Hepa1‐6 tumors were significantly increased in the T‐01‐treated and untreated sides compared with mock treatment (Figure 9). These results suggested that T‐01 conferred antitumor immunity and that cytotoxic lymphocytes induced by T‐01 invaded the tumor. The deletion of the α47 locus confers enhanced viral replication and partially restores MHC class I expression in infected cells, which stimulates lymphocytes and decreases natural killer cell cytolysis of host cells, which contributes to drastic improvement of antitumor efficacy while preserving safety.
Oncolytic HSV‐1 vectors harbor mutations in the viral genome that restrict viral replication to tumor cells, and, therefore, oHSV kills the host tumor cells without harming normal tissue.14 G47Δ was as safe as G207 at the tested dose (2 × 10⁶ pfu) when inoculated in the brain of an AJ mouse.15 AJ is one of the inbred mouse strains most susceptible to HSV‐1 infection, particularly compared with BALB/c mice.30 Despite the toxicity of intraperitoneally inoculated wild‐type HSV‐1 to BALB/c mice,30 our results showed that T‐01 did not detectably harm normal tissues (Table S3). Oncolytic viruses cannot replicate in normal cells, and T‐01 is, therefore, nontoxic when inoculated into the liver of nu/nu BALB/c mice. Treatment for HCC depends on the stage of the tumor and the degree of liver dysfunction. In the clinical, the patients with HCC were derived from HBV and/or HCV infection, which coexist in comorbid liver cirrhosis. T‐01 has not posed a safety concern; thus, it might be used not only normal liver but also for hepatitis and cirrhosis. In our next study, we will confirm the safety of T‐01 by using animal models of liver cirrhosis and chronic hepatitis.
“Arming” oHSV with transgene(s) is a useful strategy to add certain antitumor functions to oncolytic viruses.5 T‐01 is a base oHSV for “arming” interleukin (IL)‐12, IL‐18, soluble B7‐1 or thrombospondin‐1.5, 21 Arming IL‐12, IL‐18 or soluble B7‐1 oHSV may significantly enhance the antitumor efficacy through augmentation of the antitumor immunity induction. A combination with systemic administration of immune check‐point inhibitors is a reasonable strategy to enhance the efficacy of oncolytic viruses.5 In our current study, the antitumor efficacy of T‐01 was confirmed as a base oHSV for “arming,” and investigating the efficacy of “arming” oHSV with immune check‐point inhibitors.
The safety and increased presentation of MHC class I molecules associated with a third‐generation oHSV shows that the oHSV is useful as a backbone vector for expressing foreign antigens in the context of vaccination. In conclusion, our study demonstrates that T‐01 effectively inhibited the growth of human HCC and HBC cells in mouse models of HCC.
CONFLICT OF INTEREST
The authors have no conflicts of interest to declare.
Supporting information
ACKNOWLEDGMENTS
The authors thank Drs M. Tanaka, J. Fujisawa (Department of Microbiology, Kansai Medical University) and H. Gonda (Department of Central Research of Laboratory, Kansai Medical University) for providing valuable techniques and Dr K. Yoshizawa (Department of Pathology II, Kansai Medical University) for providing valuable comments on the histological analysis.
Nakatake R, Kaibori M, Nakamura Y, et al. Third‐generation oncolytic herpes simplex virus inhibits the growth of liver tumors in mice. Cancer Sci. 2018;109:600–610. https://doi.org/10.1111/cas.13492
Funding information
JSPS KAKENHI (Grant/Award Number: 24592014, 15K10176); Joint Research Project of the Institute of Medical Science, The University of Tokyo; Kansai Medical University (Research Grant D2).
REFERENCES
- 1. Arzumanyan A, Reis HMGPV, Feitelson MA. Pathogenic mechanisms in HBV‐ and HCV‐associated hepatocellular carcinoma. Nat Rev Cancer. 2013;13:123‐135. [DOI] [PubMed] [Google Scholar]
- 2. Bosch FX, Ribes J, Diaz M, Cleries R. Primary liver cancer: worldwide incidence and trends. Gastroenterology. 2004;127:S5‐S16. [DOI] [PubMed] [Google Scholar]
- 3. Bruix J, Raoul JL, Sherman M, et al. Efficacy and safety of sorafenib in patients with advanced hepatocellular carcinoma: subanalyses of a phase III trial. J Hepatol. 2012;57:821‐829. [DOI] [PMC free article] [PubMed] [Google Scholar]
- 4. Wada J, Ota K, Kumar A, Wallner EI, Kanwar YS. Developmental regulation, expression, and apoptotic potential of galectin‐9, a beta‐galactoside binding lectin. J Clin Invest. 1997;99:2452‐2461. [DOI] [PMC free article] [PubMed] [Google Scholar]
- 5. Fukuhara H, Ino Y, Todo T. Oncolytic virus therapy: a new era of cancer treatment at dawn. Cancer Sci. 2016;107:1373‐1379. [DOI] [PMC free article] [PubMed] [Google Scholar]
- 6. Peters C, Rabkin SD. Designing herpes viruses as oncolytics. Mol Ther Oncolytics. 2015;2:15010. [DOI] [PMC free article] [PubMed] [Google Scholar]
- 7. Rampling R, Cruickshank G, Papanastassiou V, et al. Toxicity evaluation of replication‐competent herpes simplex virus (ICP 34.5 null mutant 1716) in patients with recurrent malignant glioma. Gene Ther. 2000;7:859‐866. [DOI] [PubMed] [Google Scholar]
- 8. Markert JM, Medlock MD, Rabkin SD, et al. Conditionally replicating herpes simplex virus mutant, G207 for the treatment of malignant glioma: results of a phase I trial. Gene Ther. 2000;7:867‐874. [DOI] [PubMed] [Google Scholar]
- 9. Kemeny N, Brown K, Covey A, et al. Phase I, open‐label, dose‐escalating study of a genetically engineered herpes simplex virus, NV1020, in subjects with metastatic colorectal carcinoma to the liver. Hum Gene Ther. 2006;17:1214‐1224. [DOI] [PubMed] [Google Scholar]
- 10. Hu JC, Coffin RS, Davis CJ, et al. A phase I study of OncoVEXGM‐CSF, a second‐generation oncolytic herpes simplex virus expressing granulocyte macrophage colony‐stimulating factor. Clin Cancer Res. 2006;12:6737‐6747. [DOI] [PubMed] [Google Scholar]
- 11. Kaufman HL, Kim DW, DeRaffele G, Mitcham J, Coffin RS, Kim‐Schulze S. Local and distant immunity induced by intralesional vaccination with an oncolytic herpes virus encoding GM‐CSF in patients with stage IIIc and IV melanoma. Ann Surg Oncol. 2010;17:718‐730. [DOI] [PubMed] [Google Scholar]
- 12. Andtbacka RH, Kaufman HL, Collichio F, et al. Talimogene laherparepvec Improves durable response rate in patients with advanced melanoma. J Clin Oncol. 2015;33:2780‐2788. [DOI] [PubMed] [Google Scholar]
- 13. Coffin R. Interview with Robert Coffin, inventor of T‐VEC: the first oncolytic immunotherapy approved for the treatment of cancer. Immunotherapy. 2016;8:103‐106. [DOI] [PubMed] [Google Scholar]
- 14. Mineta T, Rabkin SD, Yazaki T, Hunter WD, Martuza RL. Attenuated multi‐mutated herpes‐simplex virus‐1 for the treatment of malignant gliomas. Nat Med. 1995;1:938‐943. [DOI] [PubMed] [Google Scholar]
- 15. Todo T, Martuza RL, Rabkin SD, Johnson PA. Oncolytic herpes simplex virus vector with enhanced MHC class I presentation and tumor cell killing. Proc Natl Acad Sci U S A. 2001;98:6396‐6401. [DOI] [PMC free article] [PubMed] [Google Scholar]
- 16. Fukuhara H, Martuza RL, Rabkin SD, Ito Y, Todo T. Oncolytic herpes simplex virus vector g47delta in combination with androgen ablation for the treatment of human prostate adenocarcinoma. Clin Cancer Res. 2005;11:7886‐7890. [DOI] [PubMed] [Google Scholar]
- 17. Liu RB, Varghese S, Rabkin SD. Oncolytic herpes simplex virus vector therapy of breast cancer in C3(1)/SV40 T‐antigen transgenic mice. Cancer Res. 2005;65:1532‐1540. [DOI] [PubMed] [Google Scholar]
- 18. Messerli SM, Prabhakar S, Tang Y, et al. Treatment of schwannomas with an oncolytic recombinant herpes simplex virus in murine models of neurofibromatosis type 2. Hum Gene Ther. 2006;17:20‐30. [DOI] [PubMed] [Google Scholar]
- 19. Wang J, Xu L, Zeng W, et al. Treatment of human hepatocellular carcinoma by the oncolytic herpes simplex virus G47delta. Cancer Cell Int. 2014;14:83. [DOI] [PMC free article] [PubMed] [Google Scholar]
- 20. Hoffmann D, Bangen JM, Bayer W, Wildner O. Synergy between expression of fusogenic membrane proteins, chemotherapy and facultative virotherapy in colorectal cancer. Gene Ther. 2006;13:1534‐1544. [DOI] [PubMed] [Google Scholar]
- 21. Ino Y, Saeki Y, Fukuhara H, Todo T. Triple combination of oncolytic herpes simplex virus‐1 vectors armed with interleukin‐12, interleukin‐18, or soluble B7‐1 results in enhanced antitumor efficacy. Clin Cancer Res. 2006;12:643‐652. [DOI] [PubMed] [Google Scholar]
- 22. Todo T, Feigenbaum F, Rabkin SD, et al. Viral shedding and biodistribution of G207, a multimutated, conditionally replicating herpes simplex virus type 1, after intracerebral inoculation in aotus. Mol Ther. 2000;2:588‐595. [DOI] [PubMed] [Google Scholar]
- 23. Fujiwara H, Hamaoka T. Coordination of chemokine and adhesion systems in intratumoral T cell migration responsible for the induction of tumor regression. Int Immunopharmacol. 2001;1:613‐623. [DOI] [PubMed] [Google Scholar]
- 24. Montalto G, Cervello M, Giannitrapani L, Dantona F, Terranova A, Castagnetta LA. Epidemiology, risk factors, and natural history of hepatocellular carcinoma. Ann N Y Acad Sci. 2002;963:13‐20. [DOI] [PubMed] [Google Scholar]
- 25. Aden DP, Fogel A, Plotkin S, Damjanov I, Knowles BB. Controlled synthesis of HBsAg in a differentiated human liver carcinoma‐derived cell line. Nature. 1979;282:615‐616. [DOI] [PubMed] [Google Scholar]
- 26. Fujise K, Nagamori S, Hasumura S, et al. Integration of hepatitis B virus DNA into cells of six established human hepatocellular carcinoma cell lines. Hepatogastroenterology. 1990;37:457‐460. [PubMed] [Google Scholar]
- 27. MacNab GM, Alexander JJ, Lecatsas G, Bey EM, Urbanowicz JM. Hepatitis B surface antigen produced by a human hepatoma cell line. Br J Cancer. 1976;34:509‐515. [DOI] [PMC free article] [PubMed] [Google Scholar]
- 28. Yano H, Maruiwa M, Murakami T, et al. A new human pleomorphic hepatocellular carcinoma cell line, KYN‐2. Acta Pathol Jpn. 1988;38:953‐966. [DOI] [PubMed] [Google Scholar]
- 29. Lohmann V, Körner F, Koch J, Herian U, Theilmann L, Bartenschlager R. Replication of subgenomic hepatitis C virus RNAs in a hepatoma cell line. Science. 1999;285:110‐113. [DOI] [PubMed] [Google Scholar]
- 30. Lopez C. Genetics of natural resistance to herpesvirus infections in mice. Nature. 1975;258:152‐153. [DOI] [PubMed] [Google Scholar]
- 31. Huang YY, Yu Z, Lin SF, Li S, Fong Y, Wong RJ. Nectin‐1 is a marker of thyroid cancer sensitivity to herpes oncolytic therapy. J Clin Endocrinol Metab. 2007;92:1965‐1970. [DOI] [PubMed] [Google Scholar]
- 32. Yu Z, Adusumilli PS, Eisenberg DP, et al. Nectin‐1 expression by squamous cell carcinoma is a predictor of herpes oncolytic sensitivity. Mol Ther. 2007;15:103‐113. [DOI] [PubMed] [Google Scholar]
- 33. Friedman GK, Langford CP, Coleman JM, et al. Engineered herpes simplex viruses efficiently infect and kill CD133+human glioma xenograft cells that express CD111. J Neuro‐Oncol. 2009;95:199‐209. [DOI] [PMC free article] [PubMed] [Google Scholar]
- 34. Wang PY, Currier MA, Hansford L, et al. Expression of HSV‐1 receptors in EBV‐associated lymphoproliferative disease determines susceptibility to oncolytic HSV. Gene Ther. 2013;20:761‐769. [DOI] [PMC free article] [PubMed] [Google Scholar]
- 35. Jackson JD, McMorris AM, Roth JC, et al. Assessment of oncolytic HSV efficacy following increased entry‐receptor expression in malignant peripheral nerve sheath tumor cell lines. Gene Ther. 2014;21:984‐990. [DOI] [PMC free article] [PubMed] [Google Scholar]
- 36. Wang PY, Swain HM, Kunkler AL, et al. Neuroblastomas vary widely in their sensitivities to herpes simplex virotherapy unrelated to virus receptors and susceptibility. Gene Ther. 2016;23:135‐143. [DOI] [PMC free article] [PubMed] [Google Scholar]
- 37. Fujiwara S, Nawa A, Luo C, et al. Carrier cell‐based delivery of replication‐competent HSV‐1 mutants enhances antitumor effect for ovarian cancer. Cancer Gene Ther. 2011;18:77‐86. [DOI] [PMC free article] [PubMed] [Google Scholar]
- 38. Kangasniemi L, Kiviluoto T, Kanerva A, et al. Infectivity‐enhanced adenoviruses deliver efficacy in clinical samples and orthotopic models of disseminated gastric cancer. Clin Cancer Res. 2006;12:3137‐3144. [DOI] [PubMed] [Google Scholar]
Associated Data
This section collects any data citations, data availability statements, or supplementary materials included in this article.
Supplementary Materials


