Abstract
Five datasets were constructed from ligand and bioassay result data from the literature. These datasets include bioassay results from the Ames mutagenicity assay, Greenscreen GADD-45a-GFP assay, Syrian Hamster Embryo (SHE) assay, and 2 year rat carcinogenicity assay results. These datasets provide information about chemical mutagenicity, genotoxicity and carcinogenicity.
Specifications Table
| Subject area | Computational Chemistry |
| More specific subject area | Quantitative Structure-Activity Relationship (QSAR) modelling |
| Type of data | Raw data (CSV files), processed data (ARFF files) with analysis |
| Data format | SMILES structures and bioassay results, selected descriptors |
| Experimental factors | Data was gleaned for QSAR model development |
| Experimental features | QSAR models were developed for each dataset using machine learning algorithms using calculated structural descriptors |
| Data source location | Discipline of Pharmacology, Blackburn Building, University of Sydney, Australia |
| Data accessibility | Raw and processed data are presented as CSV and ARFF files, respectively, as supplementary data for this article |
Value of the data
-
•
This article contains the largest public collection of ligands and results for the GreenScreen GADDα-45 and Syrian Hamster Embryonic Cell Transformation assays collated from previous literature to date.
-
•
A benchmark dataset of pharmaceutically relevant ligands for use in rat carcinogenicity QSAR models is presented and compared with ligands from regulatory domains.
-
•
Physiochemical descriptors were calculated from the SMILES structures and selected for QSAR model performance.
1. Data
The creation of a QSAR model for the 2-year rodent carcinogenicity bioassay is highly desirable since it is the gold standard for assessing potential chemical carcinogenicity. However, previous modelling efforts have been hampered due to data availability and reliability issues stemming from bioassay limitations such as low throughput, high cost, and modest reproducibility between laboratories and rodent species. The in vivo carcinogenicity datasets in this article are solely rat carcinogenicity outcomes due to previous literature finding the rat carcinogenicity bioassay produces better endpoint reliability in comparison to the mouse carcinogenicity bioassay. This article presents two rat carcinogenicity datasets from the regulatory toxicology and pharmaceutical safety chemical domains.
Genotoxicity occurs from chemicals acting with genomic mechanisms of toxicity and this has been associated with potential carcinogenicity. This endpoint type features many in vitro bioassays with larger libraries of screened molecules in comparison to in vivo rodent carcinogenicity bioassay data. QSAR models capable of utilizing this data in combination with rodent carcinogenicity data may address the limited applicability domain of the in vivo data. The data was exhaustively collated from the in vitro GreenScreen GADD-45 and Syrian Hamster Embryonic bioassays from the literature. Previous literature found concordance between these bioassays and in vivo rodent carcinogenicity outcomes. The Ames Bacterial Mutagenicity Benchmark Dataset has also been included for comparison.
2. Experimental design, materials and methods
2.1. Dataset preparation
ISSCAN: 854 chemical database of in vivo rat carcinogenicity from [1].
PHARM: in vivo rodent carcinogenicity results on pharmaceutical chemicals from [2].
GreenScreen: 1415 GADD-45a-GFP assay results from [3], [4], [5], [6], [7], [8], [9], [10].
Syrian Hamster Embryonic: Data on 1415 chemicals extracted from [11], [12].
Ames: 6512 Ames results from [13].
2.2. Dataset curation
SMILES structures were generated using ChemAxon JChem for Office from CAS Numbers or chemical names.
These structures were curated using ChemAxon Standardizer to remove salts and solvents and aromatized.
2.3. Descriptor selection
The CfsSubsetEval algorithm [14] selected subsets of structural descriptors (generated by PaDEL Descriptor [15]) for each dataset.
2.4. Applicability domain quantification
The applicability domain of each dataset compared to the PHARM dataset was quantified using leverage, Euclidean distance from centroid, and a variable knn-based distance [16] measures.
2.5. QSAR model Attribute Importance Scores
Attribute Importance Scores were calculated from each RandomForest QSAR model (Fig. 1, Table 1, Table 2, Table 3, Table 4, Table 5, Table 6, Table 7).
Fig. 1.
Box and whisker plots depicting the percentage of PHARM validation dataset samples retained within the applicability domain of the processed Ames (A), GSX (B), SHE (C), ISC (D) modelling datasets over different k values. k values in the variable knn-based distance measure were optimized using 20% of samples in the PHARM validation dataset, 1000 iterations, and a maximum k value of 25.
Table 1.
Summary of initial datasets after curation.
| Name/source | Bioassay/data source | n | +/− Results | % Balance (+/−) |
|---|---|---|---|---|
| Ames Mutagenicity | Ames Bacterial Mutagenicity Benchmark Dataset | 6512 | 3503/3009 | 54:46 |
| Syrian Hamster Embryonic | Syrian Hamster Embryonic Cell Transformation Assay (pH 7) | 356 | 232/124 | 65:35 |
| GreenScreen | GADD-45 GFP Literature Results | 1415 | 163/1252 | 12:88 |
| ISSCAN | ISSCAN expert rat carcinogenicity calls | 854 | 510/344 | 60:40 |
| PHARM | Rat carcinogenicity literature results | 374 | 134/240 | 36:64 |
Table 2.
Summary of modelling datasets after structural descriptor calculation and selection.
| Name | # Desc. | n/Desc |
|---|---|---|
| Ames | 90 | 72.4 |
| GSX | 21 | 93.1 |
| SHE | 58 | 8.28 |
| ISC | 51 | 23.5 |
| PHARM | 1875 | – |
Table 3.
Applicability Domain (AD) quantification comparing each processed QSAR modelling dataset to the PHARM dataset.
| Name | AD measure | Inside AD | Outside AD |
|---|---|---|---|
| Ames | knn distance | 350 | 24 |
| Distance from centroid | 356 | 18 | |
| Leverage | 351 | 23 | |
| GSX | knn distance | 355 | 19 |
| Distance from centroid | 353 | 21 | |
| Leverage | 352 | 22 | |
| SHE | knn distance | 357 | 17 |
| Distance from centroid | 356 | 18 | |
| Leverage | 331 | 43 | |
| ISC | knn distance | 325 | 49 |
| Distance from centroid | 330 | 44 | |
| Leverage | 309 | 65 |
Table 4.
Attribute Importance Scores (AIS) and node membership for structural descriptors in the GreenScreen (GSX) QSAR model.
| Structural descriptor | AIS | Node membership |
|---|---|---|
| AATS2m | 0.37 | 20,529 |
| naAromAtom | 0.35 | 15,136 |
| GATS2m | 0.35 | 17,920 |
| GATS2i | 0.35 | 16,693 |
| SpMin1_Bhp | 0.34 | 15,952 |
| ETA_BetaP | 0.32 | 14,229 |
| IC3 | 0.3 | 14,615 |
| nAcid | 0.3 | 4138 |
| nAtomLC | 0.29 | 11,238 |
| nssO | 0.29 | 9829 |
| MDEC-33 | 0.29 | 12,339 |
| SHBint6 | 0.29 | 7607 |
| R_TpiPCTPC | 0.28 | 12,038 |
| RDF50m | 0.28 | 7741 |
| MPC4 | 0.28 | 13,116 |
| L3m | 0.27 | 7252 |
| De | 0.26 | 7117 |
| nHAvin | 0.23 | 3773 |
| MDEN-13 | 0.21 | 4086 |
| n3HeteroRing | 0.18 | 1316 |
Table 5.
Attribute Importance Scores (AIS) and node membership for structural descriptors in the ISSCAN (ISC) QSAR model.
| Structural descriptor | AIS | Node membership |
|---|---|---|
| ALogp2 | 0.4 | 13,058 |
| AATSC0p | 0.38 | 11,714 |
| ATSC7e | 0.38 | 9518 |
| MATS3s | 0.37 | 11,996 |
| BCUTp-1l | 0.37 | 10,779 |
| MATS1e | 0.37 | 11,671 |
| BCUTw-1h | 0.35 | 9596 |
| nN | 0.35 | 6494 |
| nAcid | 0.34 | 1640 |
| nCl | 0.34 | 3703 |
| P1s | 0.33 | 7280 |
| C3SP2 | 0.3 | 4817 |
| nHBint4 | 0.3 | 2765 |
| nHBint2 | 0.29 | 3028 |
| nssCH2 | 0.29 | 5294 |
| topoShape | 0.29 | 5618 |
| nHBint3 | 0.29 | 3033 |
| nHBint5 | 0.28 | 2579 |
| nHBint6 | 0.28 | 1998 |
| C1SP2 | 0.28 | 4941 |
| nHCsatu | 0.27 | 3117 |
| nAtomLAC | 0.26 | 3733 |
| ndO | 0.26 | 4003 |
| minsOH | 0.26 | 3633 |
| maxsOH | 0.26 | 3248 |
| nssO | 0.26 | 2945 |
| nsssCH | 0.25 | 3217 |
| maxsNH2 | 0.25 | 3572 |
| maxssO | 0.25 | 3885 |
| nssssC | 0.25 | 1917 |
| ndssC | 0.25 | 3828 |
| nBase | 0.25 | 1811 |
| ETA_Beta_ns_d | 0.25 | 3798 |
| SaaS | 0.24 | 612 |
| nHssNH | 0.24 | 1971 |
| n6Ring | 0.24 | 4471 |
| n6HeteroRing | 0.23 | 1761 |
| mindsN | 0.23 | 1969 |
| nHBDon | 0.23 | 3556 |
| nsssN | 0.23 | 2034 |
| LipinskiFailures | 0.23 | 1479 |
| nsOm | 0.23 | 1527 |
| maxdsN | 0.22 | 1748 |
| n5HeteroRing | 0.21 | 1658 |
| MDEN-23 | 0.2 | 2373 |
| SRW5 | 0.19 | 2445 |
| mintsC | 0.19 | 641 |
| SaaO | 0.18 | 789 |
| MDEN-13 | 0.18 | 706 |
| nT7Ring | 0.15 | 574 |
| nF11HeteroRing | 0.13 | 393 |
Table 6.
Attribute Importance Scores (AIS) and node membership for structural descriptors in the Syrian Hamster Embryonic (SHE) cell transformation assay QSAR model.
| Structural descriptor | AIS | Node membership |
|---|---|---|
| ATSC0e | 0.39 | 2283 |
| AATSC4m | 0.39 | 2176 |
| AATS0p | 0.38 | 2522 |
| AATS7i | 0.38 | 1848 |
| MATS2c | 0.37 | 2105 |
| AATS1m | 0.36 | 2582 |
| ATSC6s | 0.36 | 2284 |
| ATSC8s | 0.36 | 1687 |
| GATS2c | 0.35 | 1825 |
| AATSC7m | 0.34 | 1812 |
| MATS7m | 0.34 | 1589 |
| MATS8c | 0.33 | 1571 |
| MATS7p | 0.33 | 1573 |
| GATS1c | 0.33 | 2219 |
| GATS4m | 0.33 | 1943 |
| VE3_Dzp | 0.32 | 2041 |
| SpMin8_Bhp | 0.32 | 1655 |
| nAcid | 0.31 | 448 |
| GATS8v | 0.31 | 1067 |
| GATS8c | 0.31 | 1464 |
| SpMin7_Bhs | 0.3 | 1857 |
| VR2_Dt | 0.3 | 1707 |
| GATS8i | 0.29 | 1172 |
| naasC | 0.29 | 808 |
| TDB2i | 0.29 | 1128 |
| C1SP2 | 0.29 | 760 |
| nsCH3 | 0.29 | 974 |
| TDB8u | 0.28 | 672 |
| minHBint3 | 0.28 | 803 |
| C1SP3 | 0.28 | 992 |
| TDB4e | 0.27 | 1057 |
| ASP-6 | 0.27 | 1806 |
| nRotBt | 0.27 | 1127 |
| SCH-5 | 0.27 | 594 |
| Ds | 0.27 | 972 |
| SHsOH | 0.27 | 897 |
| RNCG | 0.27 | 1039 |
| E3p | 0.27 | 915 |
| RDF10m | 0.27 | 961 |
| TDB1m | 0.27 | 1203 |
| piPC9 | 0.27 | 1033 |
| TDB3i | 0.26 | 1314 |
| nsNH2 | 0.26 | 400 |
| nHsNH2 | 0.26 | 496 |
| RotBFrac | 0.26 | 1203 |
| nssO | 0.25 | 565 |
| minsssN | 0.25 | 376 |
| nHeteroRing | 0.25 | 490 |
| TDB7r | 0.24 | 835 |
| maxssO | 0.23 | 743 |
| SRW5 | 0.23 | 442 |
| minHBint7 | 0.23 | 424 |
| nssssNp | 0.23 | 25 |
| nAtomLAC | 0.22 | 871 |
| MDEN-12 | 0.21 | 208 |
| nT6HeteroRing | 0.21 | 384 |
| nHCHnX | 0.2 | 172 |
| nFG12HeteroRing | 0.17 | 258 |
Table 7.
Attribute Importance Scores (AIS) and node membership for structural descriptors in the Ames QSAR model.
| Structural descriptor | AIS | Node membership |
|---|---|---|
| AATS4e | 0.42 | 17,373 |
| ATSC7c | 0.42 | 15,115 |
| ATSC2c | 0.41 | 18,428 |
| AATS2e | 0.41 | 16,488 |
| AATS1m | 0.41 | 16,634 |
| ATSC4m | 0.4 | 16,224 |
| ATSC3m | 0.4 | 16,652 |
| ATSC2v | 0.38 | 15,374 |
| ATSC3e | 0.38 | 15,359 |
| ATSC4i | 0.37 | 14,988 |
| ATSC2e | 0.37 | 15,187 |
| AATSC5c | 0.37 | 14,636 |
| ATSC2i | 0.36 | 14,319 |
| MATS6c | 0.36 | 13,289 |
| nAcid | 0.36 | 2038 |
| MATS4c | 0.36 | 15,264 |
| ATSC1e | 0.35 | 15,795 |
| MATS4m | 0.35 | 13,467 |
| ATSC1i | 0.35 | 14,449 |
| MATS6i | 0.34 | 12,963 |
| GATS3c | 0.34 | 13,301 |
| GATS1c | 0.33 | 14,472 |
| GATS8m | 0.33 | 9386 |
| AATSC1i | 0.32 | 13,724 |
| AATSC1e | 0.32 | 13,859 |
| GATS5v | 0.32 | 12,664 |
| VE1_Dzp | 0.32 | 11,795 |
| GATS3m | 0.32 | 12,529 |
| MATS1e | 0.31 | 12,967 |
| MATS1i | 0.3 | 12,082 |
| BCUTc-1l | 0.3 | 9751 |
| GATS1m | 0.3 | 12,484 |
| SpMax1_Bhv | 0.29 | 13,212 |
| GATS2e | 0.29 | 12,634 |
| SpMin1_Bhp | 0.29 | 13,295 |
| GATS1p | 0.29 | 11,559 |
| GATS1i | 0.29 | 11,251 |
| SpMax1_Bhi | 0.28 | 12,842 |
| ASP-2 | 0.28 | 8374 |
| ETA_EtaP | 0.28 | 11,891 |
| mindsssP | 0.27 | 299 |
| BCUTw-1h | 0.27 | 8210 |
| BCUTw-1l | 0.27 | 5500 |
| hmax | 0.27 | 12,581 |
| BIC2 | 0.27 | 11,166 |
| TDB9u | 0.27 | 4470 |
| Mpe | 0.27 | 9879 |
| Du | 0.27 | 6788 |
| ETA_Epsilon_1 | 0.27 | 9185 |
| MIC2 | 0.26 | 10,461 |
| nHCsats | 0.26 | 4146 |
| MDEC-12 | 0.26 | 5914 |
| ETA_Eta_L | 0.26 | 11,100 |
| E3i | 0.26 | 6433 |
| JGT | 0.26 | 10,771 |
| TDB8i | 0.26 | 5577 |
| RDF40m | 0.26 | 7058 |
| ETA_Epsilon_4 | 0.25 | 9370 |
| SHCsatu | 0.25 | 4686 |
| BIC1 | 0.25 | 11,006 |
| MLFER_S | 0.25 | 10,748 |
| R_TpiPCTPC | 0.25 | 11,100 |
| ETA_dEpsilon_A | 0.25 | 8641 |
| RDF20m | 0.25 | 7793 |
| WTPT-5 | 0.25 | 9438 |
| C3SP3 | 0.25 | 1330 |
| piPC10 | 0.25 | 7381 |
| SaaaC | 0.25 | 4592 |
| RDF20s | 0.25 | 7448 |
| L3u | 0.24 | 7228 |
| SdCH2 | 0.24 | 705 |
| ETA_BetaP_ns_d | 0.24 | 5993 |
| AMW | 0.24 | 8526 |
| MLFER_A | 0.23 | 7826 |
| nAtomP | 0.23 | 7347 |
| minHssNH | 0.22 | 3200 |
| ETA_Shape_X | 0.22 | 2980 |
| MDEN-33 | 0.21 | 990 |
| mindsN | 0.21 | 2570 |
| minsNH2 | 0.21 | 3578 |
| SRW9 | 0.2 | 4461 |
| MDEN-23 | 0.2 | 2559 |
| maxHCHnX | 0.2 | 2082 |
| minwHBd | 0.19 | 1599 |
| nTG12Ring | 0.19 | 1527 |
| nFG12Ring | 0.19 | 1633 |
| SaaS | 0.18 | 760 |
| MDEN-13 | 0.17 | 979 |
| SCH-3 | 0.15 | 1699 |
| VCH-3 | 0.14 | 1762 |
Footnotes
Transparency document associated with this article can be found in the online version at doi:10.1016/j.dib.2018.01.077.
Supplementary data associated with this article can be found in the online version at doi:10.1016/j.dib.2018.01.077.
Transparency document. Supplementary material
Transparency document
Appendix A. Supplementary material
Supplementary material
Supplementary material
Supplementary material
Supplementary material
Supplementary material
Supplementary material
Supplementary material
Supplementary material
Supplementary material
Supplementary material
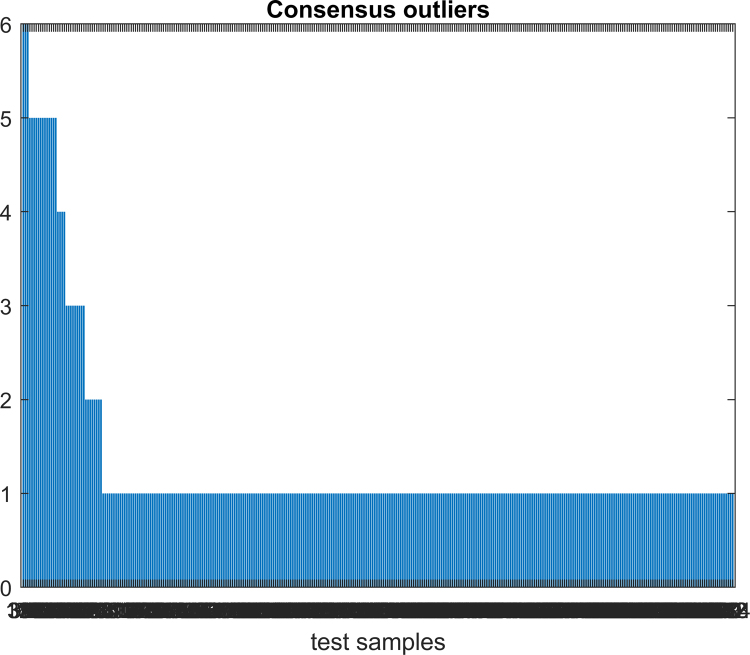
Fig. S1.
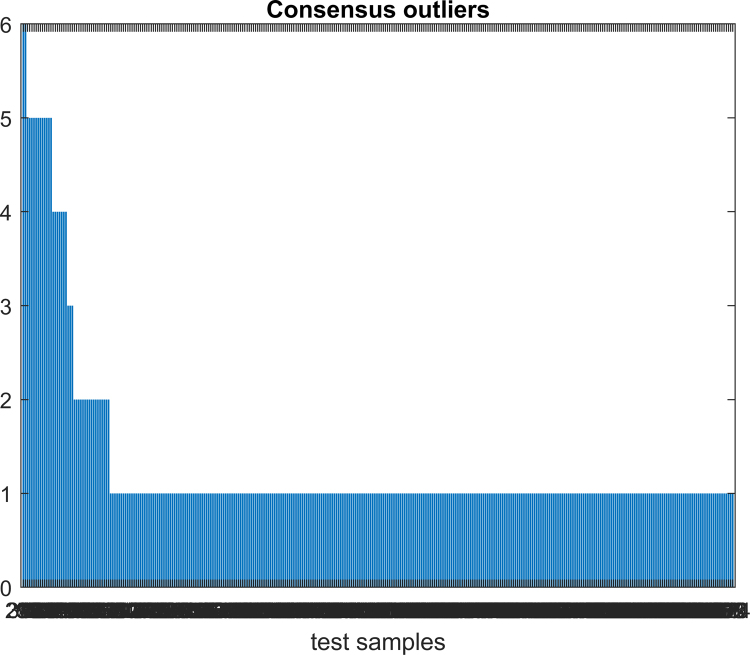
Fig. S2.
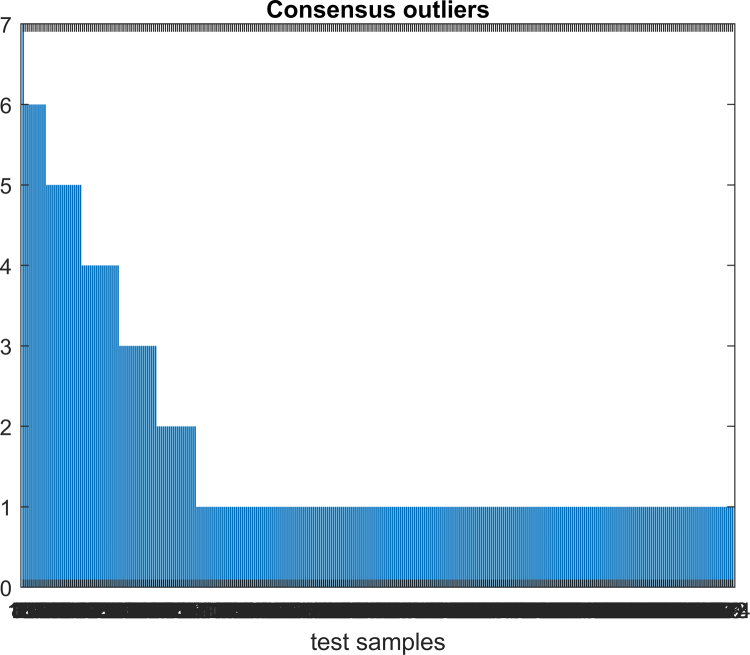
Fig. S3.
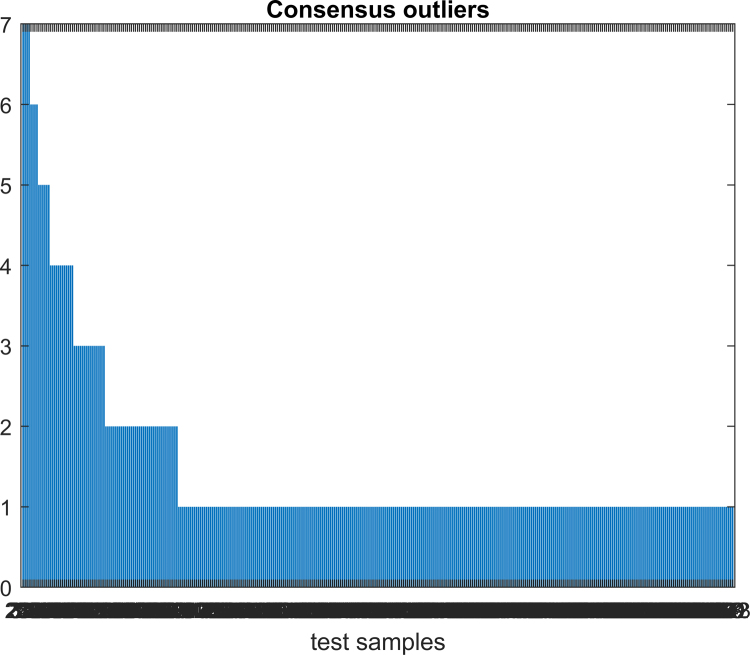
Fig. S4.
References
- 1.Benigni R. A novel approach: chemical relational databases, and the role of the ISSCAN database on assessing chemical carcinogenicity. Ann. Ist. Super. Sanita. 2008;44(1):48–56. [PubMed] [Google Scholar]
- 2.Snyder R.D. An update on the genotoxicity and carcinogenicity of marketed pharmaceuticals with reference to in silico preclictivity. Environ. Mol. Mutagen. 2009;50(6):435–450. doi: 10.1002/em.20485. [DOI] [PubMed] [Google Scholar]
- 3.Johnson D., Walmsley R. Histone-deacetylase inhibitors produce positive results in the GADD45a-GFP GreenScreen HC assay. Mutat. Res. 2013;751(2):96–100. doi: 10.1016/j.mrgentox.2012.12.009. [DOI] [PubMed] [Google Scholar]
- 4.Birrell L. GADD45a-GFP GreenScreen HC assay results for the ECVAM recommended lists of genotoxic and non-genotoxic chemicals for assessment of new genotoxicity tests. Mutat. Res./Genet. Toxicol. Environ. Mutagen. 2010;695(1–2):87–95. doi: 10.1016/j.mrgentox.2009.12.008. [DOI] [PubMed] [Google Scholar]
- 5.Knight A.W. Evaluation of high-throughput genotoxicity assays used in profiling the US EPA ToxCast chemicals. Regul. Toxicol. Pharmacol. 2009;55(2):188–199. doi: 10.1016/j.yrtph.2009.07.004. [DOI] [PubMed] [Google Scholar]
- 6.Olaharski A. Evaluation of the GreenScreen GADD45alpha-GFP indicator assay with non-proprietary and proprietary compounds. Mutat. Res. 2009;672(1):10–16. doi: 10.1016/j.mrgentox.2008.08.019. [DOI] [PubMed] [Google Scholar]
- 7.Knight A.W., Birrell L., Walmsley R.M. Development and validation of a higher throughput screening approach to genotoxicity testing using the GADD45a-GFP GreenScreen HC assay. J. Biomol. Screen. 2009;14(1):16–30. doi: 10.1177/1087057108327065. [DOI] [PubMed] [Google Scholar]
- 8.Hastwell P.W. Analysis of 75 marketed pharmaceuticals using the GADD45a-GFP 'GreenScreen HC' genotoxicity assay. Mutagenesis. 2009;24(5):455–463. doi: 10.1093/mutage/gep029. [DOI] [PubMed] [Google Scholar]
- 9.Jagger C. Assessment of the genotoxicity of S9-generated metabolites using the GreenScreen HC GADD45a-GFP assay. Mutagenesis. 2009;24(1):35–50. doi: 10.1093/mutage/gen050. [DOI] [PubMed] [Google Scholar]
- 10.Hastwell P.W. High-specificity and high-sensitivity genotoxicity assessment in a human cell line: validation of the GreenScreen HC GADD45a-GFP genotoxicity assay. Mutat. Res. 2006;607(2):160–175. doi: 10.1016/j.mrgentox.2006.04.011. [DOI] [PubMed] [Google Scholar]
- 11.Isfort R.J., Kerckaert G.A., LeBoeuf R.A. Comparison of the standard and reduced pH Syrian Hamster Embryo (SHE) cell in vitro transformation assays in predicting the carcinogenic potential of chemicals. Mutat. Res. - Fundam. Mol. Mech. Mutagen. 1996;356(1):11–63. doi: 10.1016/0027-5107(95)00197-2. [DOI] [PubMed] [Google Scholar]
- 12.OECD, Detailed review paper on cell transformation assays for detection of chemical carcinogens, in: OECD Environment, Health and Safety Publications, 2007. Series on Testing and Assessment Number 31 (2007) ENV/JM/MONO(2007)18.
- 13.Hansen K. Benchmark data set for in silico prediction of ames mutagenicity. J. Chem. Inf. Model. 2009;49(9):2077. doi: 10.1021/ci900161g. [DOI] [PubMed] [Google Scholar]
- 14.Hall M. 1998. Correlation-based Feature Subset Selection for Machine Learning. Thesis Submitted in Partial Fulfillment of the Requirements of the Degree of Doctor of Philosophy at the University of Waikato. [Google Scholar]
- 15.Yap C.W. PaDEL-descriptor: an open source software to calculate molecular descriptors and fingerprints. J. Comput. Chem. 2011;32(7):1466–1474. doi: 10.1002/jcc.21707. [DOI] [PubMed] [Google Scholar]
- 16.Sahigara F. Defining a novel k-nearest neighbours approach to assess the applicability domain of a QSAR model for reliable predictions. J. Chemin. 2013;5(5) doi: 10.1186/1758-2946-5-27. (27-27) [DOI] [PMC free article] [PubMed] [Google Scholar]
Associated Data
This section collects any data citations, data availability statements, or supplementary materials included in this article.
Supplementary Materials
Transparency document
Supplementary material
Supplementary material
Supplementary material
Supplementary material
Supplementary material
Supplementary material
Supplementary material
Supplementary material
Supplementary material
Supplementary material


