

Abstract
Background
Many adolescents are exposed to tobacco smoke, from either active smoking (CS) or secondhand smoke exposure (SHS). Tobacco-specific biomarkers of exposure include cotinine (detects use in past 2-4 days) and 4-(methylnitrosamino)-1-(3-pyridyl)-1-butanol (NNAL) (detects use for a month or longer). NNAL is expected to detect more intermittent tobacco exposure. We compared NNAL and cotinine as biomarkers of exposure to tobacco in urban adolescents and determined the optimal NNAL cut point to distinguish CS from SHS exposure.
Methods
Surplus urine samples, collected from 466 adolescents attending pediatric well or urgent care visits at Zuckerberg San Francisco General Hospital in 2013-2014, were assayed for cotinine and NNAL.
Results
94% of adolescents had measurable levels of NNAL compared to 87% for cotinine. The optimal NNAL cut point to distinguish CS from SHS was 9.6 pg/ml by latent class or 14.4 pg/ml by receiver operating characteristic analysis. Cotinine and NNAL were strongly correlated, but the correlation slopes differed for active vs SHS exposed adolescents. Among nonsmokers, NNAL levels were significantly higher in African American (median 3.3 pg/ml) compared to other groups (0.9 to 1.9 pg/ml), suggesting greater exposure to SHS.
Conclusions
Urine NNAL screening finds a large majority (94%) of urban adolescents are exposed to tobacco. African Americans are exposed to higher levels of SHS than other ethnic/racial groups.
Impact
SHS is associated with significant medical morbidity in adolescents. Routine biochemical screening with NNAL or cotinine detects high prevalence of SHS exposure and should be considered as a tool to reduce SHS exposure in high-risk populations.
Keywords: Tobacco, Secondhand smoke, Biomarkers, Cotinine, NNAL, Adolescents, Screening
INTRODUCTION
Secondhand smoke (SHS) exposure poses a significant health risk to adolescents, particularly for respiratory problems and infections.(1) Secondhand smoke exposure also increases the likelihood of a nonsmoker becoming an active tobacco user.(2) Biochemical assessment of tobacco smoke exposure could be a useful tool to identify and reduce SHS exposure and related disease. We recently reported a high prevalence of tobacco smoke exposure in adolescents screened using urine cotinine testing for tobacco smoke exposure while attending an urban hospital pediatric clinic.(3) We found that 87 % had evidence of nicotine exposure, with 12 % having cotinine levels consistent with active smoking. Cotinine is the proximate metabolite of nicotine with a half-life averaging 16-24 hours, and as such, is sensitive to exposure to nicotine over the preceding 2-4 days. (4,5)
4-(methylnitrosamino)-1-(3)pyridyl-1-butanol (NNAL) is a metabolite of the tobacco-specific nitrosamine 4-(methylnitrosamino)-1-(3)pyridyl-1-butanone (NNK).(6) NNK, a potent lung carcinogen, is formed from nicotine in the curing and pyrolysis of tobacco. NNAL is a urinary metabolite that is specific for tobacco use, has a long half-life of 10-16 days, and is sensitive to tobacco exposure for a month or longer.(7) Thus, NNAL would detect tobacco smoke exposure over a much longer period of time compared to cotinine. Many adolescents are intermittently exposed to tobacco smoke, such that exposure might not be detected using a biomarker with a short window of detection, such as cotinine. One set of aims of our study was to compare levels of NNAL and cotinine in urine of adolescents and to determine the optimal NNAL cut point to distinguish active vs passive smoking. By passive smoking, we include both SHS and thirdhand smoke (THS) exposure, the latter referring to exposure from tobacco smoke residues that contaminate homes and other indoor environments long after SHS has dissipated.(8)
Racial differences in cotinine levels in people exposed to tobacco smoke have been reported, with higher levels in African Americans smokers and non-smokers compared to whites.(9,10) The reason for differences in cotinine levels has not been established, but could be due to racial differences in cotinine metabolism and/or due to different levels of SHS exposure. African Americans on average metabolize nicotine and cotinine more slowly than Caucasians due to a higher prevalence of poor metabolism variants in the CYP2A6 and UGTB10 genes.(11,12) As a result, for a given level of nicotine intake, cotinine levels are on average higher in African Americans compared to Caucasians.(13) African Americans are also reported to be more likely to live in homes with a smoker, and therefore may have higher SHS exposure compared to non-smokers of other racial/ethnic groups.(14) A second aim of our study was to compare NNAL as a marker of level of SHS exposure in African Americans compared to other racial groups.
We and others have reported previously that the ratio of NNAL to cotinine is higher in people exposed to SHS compared to active smokers.(15-17) The reason is that NNK is formed from nicotine as SHS ages, while nicotine is rapidly lost by adsorption to room surfaces.(8) Thus, the NNK/nicotine ratio in the air increases as smoke ages. This results in non-smokers inhaling aged SHS with a higher ratio of NNK vs nicotine, and accordingly higher urine NNAL/cotinine ratios compared to active smokers inhaling mainstream smoke. A third aim of our study was to determine how well the ratio of NNAL/cotinine might serve as a diagnostic test to separate active vs passive smoking.
MATERIALS AND METHODS
Study Procedures
Details of the study procedures have been reported previously.(3) In brief, 466 adolescents, ages 13-19, who received pediatric care at the Children’s Health Center (CHC) at Zuckerberg San Francisco General Hospital (ZSFG) and who had surplus urine after collection for other clinical indications during a 12 month interval (June, 2013 – May, 2014) were studied. The CHC is the primary pediatric outpatient clinic at ZSFG, a county hospital serving an economically disadvantaged population of San Francisco. Of our subjects, 91.4% had public insurance and 7.9% were uninsured. Ethnically the adolescent population treated in the CHC is: Latino 58.1%, African American 19.1%, Asian 11.0%, White 6.5%, and Other 5.3%. At the CHC, 11.6% of active patients aged 13-18 who reported smoking status stated they were currently smoking, and 18.6% of active patients of all ages reported secondhand smoke exposure.
Adolescents presented to the clinic for both well and sick care, where urine samples were collected routinely for clinical indications including but not limited to urinary tract or sexually transmitted infection (STI) screening and diagnosis, abdominal pain evaluation, pregnancy screening and trauma. Samples were collected by clinic nurses and frozen for later analysis.
Information on subjects’ race/ethnicity, gender, age, medical diagnosis, and self-reported tobacco use history (reported to the care provider) was retrieved from the hospital electronic database. This was an un-consented study approved by the Committee on Human Research at the University of California, San Francisco. There was no direct patient contact; and after the chart review was completed, all patient identifiers were deleted from the database and research charts.
Analytical Chemistry
Urine samples were analyzed for free cotinine and total (free plus conjugated) NNAL by liquid chromatography – tandem mass spectrometry.(18,19) The lower limit of quantitation (LOQ) for cotinine was 0.05 ng/ml and for NNAL 0.25 pg/ml. Concentrations were analyzed both without and with creatinine normalization.
Data Analysis/Statistics
To determine the optimal NNAL concentration that discriminates between active smoking and SHS exposure we used both latent class analysis (LCA) and receiver operating characteristic (ROC) approaches. In the first approach, we performed density estimation and LCA on log-transformed urine NNAL levels using the R (www.R-project.org) package mclust.(20,21) This allowed us to fit models of the NNAL distribution as a set of gaussian mixtures. Using Bayes Information Criterion maximum-likelihood methods, the 2-cluster model was selected as the best-fitting model. This approach makes no assumptions about smoking status, but rather looks at discontinuities in the frequency distribution curves.
The second approach was to construct ROC curves and compare the performance of multiple cut points. In our recent publication on this study population, we developed three cotinine groups using latent class analysis to describe detectable cotinine levels in urine. (3) Active smoking was determined to be > 30 ng/ml, significant SHS exposure as 0.25 to 30 ng/ml, and low-level SHS and/or thirdhand smoke (THS) exposure as 0.05 to 0.25 ng/ml. In the ROC analysis, we used a cotinine concentration > 30 ng/ml as the gold standard for active smoking. ROC analyses were performed for urine NNAL concentration with and without creatinine correction, and for the urine NNAL/cotinine ratio. Optimal cut points were determined both as that which equalized sensitivity and specificity and that which maximized the Youden index (J). The Youden index, with a range of values from 0 to 1 provides a single number for summarizing a test’s accuracy. A value of 1 represents a test which minimizes both false positives and false negatives. A value of 0 represents a test with no ability to discriminate between true and false positives.(22,23) We also performed ROC analyses using urine cotinine cut points of 10, 15 and 20 ng/ml to assess the impact of over-estimating the optimal discriminating cotinine value to determine active smoking.
To examine effects of race/ethnicity, sex (male, female) and age (13–14, 15–16, 17–19 years), we tested differences in NNAL detection frequency with the χ2 test. We used Kruskal-Wallis tests to evaluate whether absolute measured values NNAL or the ratio of NNAL/cotinine differed across covariates.
Both NNAL and NNAL/cotinine were log-transformed given their approximate lognormal distribution. In correlational analyses, subjects with a cotinine or NNAL value below the limit of quantitation were excluded. Other than the latent class analysis, all statistical analyses were carried out using SAS v. 9.4 (SAS Institute, Inc. Cary, NC, USA). Statistical tests were considered significant at p < 0.05.
RESULTS
Overall 94% of adolescents had NNAL levels above the limit of quantitation, compared to 87 % for cotinine (Table 1). Table S1 shows the high concordance of classification of smokers and non-smokers by urine cotinine and NNAL. Median values for urine NNAL and cotinine in all subjects and by active smoking status, gender, ethnicity and age, based on volume and with correction for creatinine are shown in tables 2 and 3. A frequency histogram for urine NNAL is shown in Fig 1. Log urine NNAL and log cotinine were significantly correlated (R2 = 0.38 for active smokers, R2 = 0.33 for passive smokers, both p < 0.01), but the slopes of the regression lines (0.51 vs 0.72) differed for active vs passive smokers (Fig 2).
Table 1.
Comparison of NNAL and Cotinine Exposure Rates (Urine NNAL > 0.25 pg/ml; urine cotinine > 0.05 ng/ml) by gender, ethnicity and age.
| NNAL | Cotinine | ||||
|---|---|---|---|---|---|
| n | Frequency (%) | p | Frequency (%) | p | |
| All | 469 | 441 (94) | 407 (87) | ||
| Gender | |||||
| Male | 184 | 173 (94) | 159 (86) | ||
| Female | 285 | 268 (94) | 1 | 248 (87) | 1 |
| Ethnicity | |||||
| Asian | 51 | 47 (92) | 42 (82) | ||
| Latino | 246 | 226 (92) | 201 (82) | ||
| Black | 102 | 101 (99) | 97 (95) | ||
| White | 15 | 13 (84) | 15 (100) | ||
| Mixed/Other | 55 | 54 (98) | 0.05 | 52 (95) | < 0.01 |
| Age | |||||
| 13-14 | 102 | 93 (91) | 80 (78) | ||
| 15-16 | 203 | 192 (95) | 180 (89) | ||
| 17-19 | 164 | 156 (95) | 0.4 | 147 (90) | 0.02 |
Table 2.
Median Urine NNAL Values by smoking status and gender, ethnicity and age.
| Active Smokers (Urine Cotinine >30 ng/ml) | Non-Smokers | |||||
|---|---|---|---|---|---|---|
| n | Median (IQR) | p | n | Median (IQR) | p | |
| A - All | 55 | 80.9 (42.6–151.3) | 410 | 1.2 (0.5–3.2) | ||
| Gender | ||||||
| Male | 20 | 84.3 (59.6–99.8) | 163 | 1.1 (0.4–2.9) | ||
| Female | 35 | 62.0 (38.4–183.9) | 0.8 | 247 | 1.2 (0.5–3.4) | 0.5 |
| Ethnicity | ||||||
| Asian | 0 | - | 51 | 0.9 (0.3–3.0) | ||
| Latino | 8 | 29.3 (5.0–57.0) | 235 | 0.9 (0.4–2.1) | ||
| Black | 32 | 82.7 (45.4–146.1) | 70 | 3.3 (1.4–10.9) | ||
| White | 5 | 140.7 (80.8–145.1) | 10 | 1.9 (0.5–4.9) | ||
| Mixed/Other | 10 | 128.3 (50.0–192.6) | < 0.01 | 44 | 1.4 (0.6–3.9) | < 0.01 |
| Age | ||||||
| 13-14 | 5 | 89.2 (85.4–183.9) | 95 | 0.9 (0.4–2.3) | ||
| 15-16 | 21 | 62.0 (42.6.–82.3) | 181 | 1.3 (0.5–3.0) | ||
| 17-19 | 29 | 105.3 (45.4–208.5) | 0.14 | 134 | 1.2 (0.5–4.1) | 0.2 |
| B - All | 54 | 43.6 (23.7–74.1) | 384 | 1.0 (0.5–2.4) | ||
| Gender | ||||||
| Male | 20 | 45.4 (39.2–54.5) | 152 | 0.8 (0.5–2.0) | ||
| Female | 34 | 40.3 (22.3–83.9) | 1 | 232 | 1.0 (0.5–3.1) | 0.13 |
| Ethnicity | ||||||
| Asian | 0 | - | 47 | 0.8 (0.4–3.4) | ||
| Latino | 7 | 14.2 (8.4–47.1) | 217 | 0.7 (0.4–1.5) | ||
| Black | 32 | 41.3 (27.4–71.6) | 69 | 2.3 (1.0–7.9) | ||
| White | 5 | 55.4 (51.9–92.0) | 8 | 1.9 (0.7–2.7) | ||
| Mixed/Other | 10 | 56.4 (39.8–83.9) | 0.02 | 43 | 1.1 (0.5–3.9) | < 0.01 |
| Age | ||||||
| 13-14 | 5 | 43.7 (43.5–74.1) | 87 | 0.8 (0.5–2.1) | ||
| 15-16 | 20 | 40.3 (23.9–61.4) | 171 | 1.0 (0.5–2.4) | ||
| 17-19 | 29 | 51.9 (23.7–77.0) | 0.7 | 126 | 1.0 (0.4–3.2) | 0.9 |
A – Volume Based NNAL (pg/ml); B – Creatinine-Adjusted NNAL (pg/mg creatinine)
Table 3.
Median Urine Cotinine Values by smoking status and gender, ethnicity and age.
| Active Smokers (Urine Cotinine >30 ng/ml) | Non-Smokers | |||||
|---|---|---|---|---|---|---|
| n | Median (IQR) | p | n | Median (IQR) | p | |
| A - All | 55 | 155.2 (68.8–579.2) | 410 | 0.3 (0.1–1.3) | ||
| Gender | ||||||
| Male | 20 | 146.3 (73.6–390.2) | 163 | 0.3 (0.1–1.1) | ||
| Female | 35 | 155.2 (57.0–791.0) | 0.9 | 247 | 0.3 (0.1–1.5) | 0.6 |
| Ethnicity | ||||||
| Asian | 0 | - | 51 | 0.3 (0.1–1.7) | ||
| Latino | 8 | 50.3 (36.6–101.7) | 235 | 0.2 (0.1–0.6) | ||
| Black | 32 | 139.3 (73.6–657.5) | 70 | 1.3 (0.3–4.8) | ||
| White | 5 | 282.9 (250.4–406.1) | 10 | 0.8 (0.2–2.0) | ||
| Mixed/Other | 10 | 311.6 (161.7–811.8) | < 0.01 | 44 | 0.4 (0.2–1.8) | < 0.01 |
| Age | ||||||
| 13-14 | 5 | 283.3 (78.4–800.2) | 95 | 0.2 (0.1–1.1) | ||
| 15-16 | 21 | 104.9 (56.2–250.4) | 181 | 0.3 (0.1–1.1) | ||
| 17-19 | 29 | 238.8 (111.5–791.0) | 0.12 | 134 | 0.3 (0.1–2.7) | 0.02 |
| B - All | 54 | 104.6 (40.0–263.0) | 384 | 0.2 (0.1–0.9) | ||
| Gender | ||||||
| Male | 20 | 98.9 (41.8–186.8) | 152 | 0.2 (0.1–0.7) | ||
| Female | 34 | 115.8 (31.6–298.6) | 0.8 | 232 | 0.3 (0.1–1.0) | 0.3 |
| Ethnicity | ||||||
| Asian | 0 | - | 47 | 0.3 (0.1–1.1) | ||
| Latino | 7 | 26.2 (12.7–99.1) | 217 | 0.1 (0.1–0.5) | ||
| Black | 32 | 84.8 (41.6–310.62) | 69 | 0.7 (0.2–3.2) | ||
| White | 5 | 261.9 (111.4–285.1) | 8 | 1.1 (0.1–2.4) | ||
| Mixed/Other | 10 | 157.3 (110.1–249.6) | 0.03 | 43 | 0.3 (0.1–0.9) | < 0.01 |
| Age | ||||||
| 13-14 | 5 | 138.2 (40.0–322.6) | 87 | 0.2 (0.1–0.8) | ||
| 15-16 | 20 | 66.9 (35.7–201.3) | 171 | 0.2 (0.1–0.9) | ||
| 17-19 | 29 | 116.0 (56.6–298.6) | 0.4 | 126 | 0.2 (0.1–1.7) | 0.06 |
A – Volume Based Cotinine (ng/ml); B – Creatinine-Adjusted Cotinine (ng/mg creatinine)
Figure 1. Histogram: NNAL.
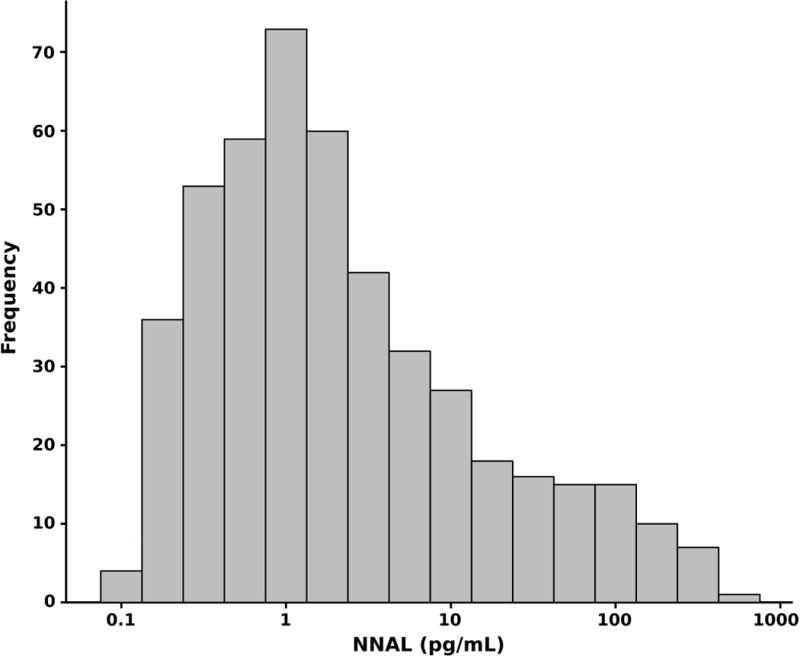
Figure 1 shows the frequency distribution of Urine NNAL.
Figure 2. Log-Log Plots: NNAL and Cotinine.
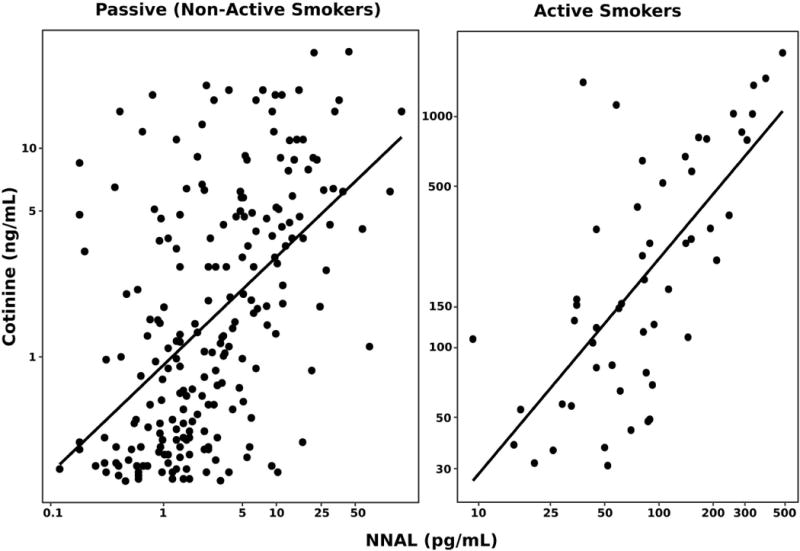
Figure 2 includes scatterplots of NNAL and cotinine in two panels. The first panel includes participants with cotinine values below the established urine cotinine cut point and a fitted regression [(ln(COT) = 0.72 * ln(NNAL) + 3.1); R2: 0.33]. The second panel plots the same for participants with cotinine values > 30 ng/ml with a fitted regression [ln(COT) = 0.51 * ln(NNAL) – 0.9; R2: 0.38]
Based on modeled density plots, latent class analysis found an optimal cut point of 9.6 pg/ml (95% CI 5.5 – 14.2) and 7.0 pg/mg creatinine (4.1 – 11.0). Assuming that a cotinine level of 30 ng/ml indicates active smoking, a NNAL cut point of 9.6 pg/ml would correctly classify 94.5% smokers as smokers and 88.5% of non-smokers as non-smokers. A cut point of 7.0 pg/mg creatinine would correctly classify 96.3% of smokers as smokers and 90.4% of non-smokers as non-smokers.
Based on ROC analysis using a urine cotinine of 30 ng/ml to define active smoking, the optimal cut point for NNAL was 14.4 pg/ml for both equality and Youden index (J = 0.88) with a sensitivity of 94.6% and specificity of 93.4%. For creatinine-normalized NNAL, the equality cut point was 10.2 pg/mg creatinine (sensitivity 92.6%, specificity 92.7%) and Youden-based cut point 6.6 pg/mg creatinine (sensitivity 98.1%, specificity 90.4%, with J = 0.88).
To examine the impact of overestimating the cotinine cut point to define active smoking, ROC analyses were performed using cotinine cut points of 10, 15 and 20 ng/ml for active smoking. Results are shown in table 4. The optimal NNAL cut point using the Youden index was similar when active smoking was defined as 15, 20 or 30 ng/ml, and similar using the equality measure at 20 and 30 ng/ml. The optimal NNAL cut point was lower (6.2 – 6.6 pg.ml) when smoking was defined as a cotinine of >10 ng/ml.
Table 4.
ROC Analyses for the optimal urine NNAL cut point using different urine cotinine criteria for active smoking.
| Positive Cotinine Cutoff | AUC | Cutpoint | Noted For | Sensitivity | Specificity | Youden |
|---|---|---|---|---|---|---|
| Volume Based - NNAL pg/ml | ||||||
| Cotinine > 10 ng/ml | 0.917 | 6.2 | Equality | 0.872 | 0.873 | 0.743 |
| 6.6 | Youden | 0.872 | 0.886 | 0.758 | ||
| Cotinine > 15 ng/ml | 0.942 | 8.2 | Equality | 0.884 | 0.884 | 0.768 |
| 15.5 | Youden | 0.841 | 0.949 | 0.790 | ||
| Cotinine > 20 ng/ml | 0.955 | 13.9 | Equality | 0.931 | 0.931 | 0.862 |
| 15.5 | Youden | 0.931 | 0.941 | 0.872 | ||
| Cotinine > 30 ng/ml | 0.971 | 14.4 | Equality, Youden | 0.946 | 0.934 | 0.882 |
| Creatinine Adjusted - NNAL (pg/mg creatinine) | ||||||
| Cotinine > 10 ng/ml | 0.929 | 4.1 | Equality | 0.870 | 0.870 | 0.740 |
| 5.6 | Youden | 0.857 | 0.917 | 0.774 | ||
| Cotinine > 15 ng/ml | 0.960 | 5.7 | Equality | 0.912 | 0.911 | 0.822 |
| 6.6 | Youden | 0.912 | 0.924 | 0.836 | ||
| Cotinine > 20 ng/ml | 0.971 | 8.5 | Equality | 0.93 | 0.921 | 0.851 |
| 6.6 | Youden | 0.965 | 0.908 | 0.873 | ||
| Cotinine > 30 ng/ml | 0.972 | 10.2 | Equality | 0.926 | 0.927 | 0.853 |
| 6.6 | Youden | 0.981 | 0.904 | 0.885 | ||
Among all subjects who were not active smokers (defined as cotinine levels of 30 ng/ml or less), NNAL was detected in 93.4%, with a trend of higher prevalence in African American and older adolescents (Supplementary Table S1). There was no detectable difference in NNAL by age or sex. Median concentrations of NNAL were much higher in smokers compared to non-smokers as expected (Table 3). Among non-smokers, NNAL levels were significantly higher in African American adolescents compared to other groups (p < 0.01).
Ratios of NNAL/cotinine were higher in non-smokers compared to smokers (p < 0.01), but was not different by sex, race/ethnicity or age (Supplementary Table S2). ROC analysis of the NNAL/cotinine ratio, indicated an equality-based cut point of 1.07 × 10⁻³ (sensitivity 85.0%, specificity 85.0%), and a Youden-based cut point was 1.85 × 10⁻³ (sensitivity 100%, specificity 73.4%).
DISCUSSION
The overall aim of our research is to determine optimal biomarkers for routine screening of adolescents for tobacco smoke exposure. We recently reported extraordinarily high prevalence (87%) of tobacco exposure using a high sensitivity urine cotinine assay.(3) NNAL is a tobacco-specific biomarker, which has previously been shown to be a sensitive indicator of both active and passive cigarette smoke exposure.(24-28) Now we find even higher prevalence (94%) of tobacco smoke exposure using a high-sensitivity NNAL assay. Since NNAL is entirely specific for tobacco exposure, this finding dispels any speculation that the high prevalence of low level cotinine positivity in the population might be due to the consumption of foods like tomatoes, potatoes, eggplant and black tea that contain low levels of nicotine, or the use of other nicotine-containing products.(29)
The subjects of our study were mostly minority, economically disadvantaged adolescents attending pediatric clinics at a public hospital in San Francisco. San Francisco is city with relatively low smoking prevalence in 2012-2014 of 10.1% in the general population.(30) In California, as elsewhere, the smoking prevalence in low socioeconomic status groups is much higher than the population average. In comparison to our findings, data from the nationally representative National Health and Nutrition Examination Survey (NHANES) from 2007-2008 and 2011-2012 found detectable NNAL in urine of 41% and 62% of all non-tobacco users, respectively, but used an assay with limit of detection of 0.6 pg/ml, which is considerably less sensitive than the assay used here (limit of quantitation 0.25 pg/ml).(25,27) Hecht et al (31), using an assay with a detection limit of ~0.6 pg/ml found NNAL in urine of 33% of schoolchildren in grades 2 to 5 (mean age 6.9 years) in Minneapolis. Due to adolescents frequenting more locations and social groups where smoking occurs, it is not surprising that rates of NNAL detected are higher in our sample.
As reported by others, we found a high overall correlation between urine cotinine and urine NNAL.(25,27,31) However the quantitative relationship between NNAL and cotinine differed for active and passive smokers, as the ratio of NNAL to cotinine is more than 10 times higher with passive exposure compared to active smoking.(15-17) As mentioned previously, this is because the aging of exhaled mainstream smoke (SHS) is associated with rapidly declining levels of nicotine and increasing levels of NNK, thereby increasing the ratio of NNK/nicotine in SHS compared to mainstream smoke.
We examined the use of urine NNAL as a biomarker to distinguish active vs passive smoke exposure. Using a latent class analysis based on the distribution of NNAL in our subjects, the optimal NNAL cut point was 9.6 pg/ml or 7.0 pg/mg creatinine. This estimate makes no assumptions about who the active smokers are, but simply looks for likely partitions in the frequency distribution.
An ROC analysis requires a definition of who is an active smoker. Since our study was unconsented, we did not have concurrent self-report about smoking status. Instead, we used urine cotinine to define active smoking. Urine cotinine appeared to be a robust marker of active smoking based on a latent class analysis of cotinine levels (3) and that analysis identified a urine cotinine of 30 ng/ml. Of note is that a urine concentration of 30 ng/ml corresponds to serum cotinine of about 6 ng/ml, which is similar to the cut point for active smoking in large national studies.(32,33) Using ROC analysis, with cotinine as the gold standard for active smoking, we found an optimal urine NNAL cut points of 14.4 pg/ml, and cut-points of 6.6 and 10.2 pg/mg creatinine depending on preferred discriminant. Similar estimates were found when ROC analyses using lower urine cotinine cut points as gold standards for activity smoking, indicating that our estimates are robust.
In a prior study of adults, comparing those heavily exposed to SHS vs active smokers, we found an optimal NNAL cut point of 47.3 pg/ml.(16) The higher cut point in our previous study is expected as non-smoker samples were selected based on substantial SHS exposure and the active smokers were adult regular smokers; while in the present study we compared adolescent light smokers to all non-smokers in a population in which cigarette smoke in active smokers is relatively low and passive exposure is light. Data from NHANES from 2007 to 2008 found in nonsmokers a 95th percentile urine NNAL of 24.4 pg/ml (25); and data from 2011 to 2012 found 11.7 pg/ml.(27) Thus, selection of the optimal urine NNAL cut point to discriminate smokers from non-smokers appears to vary from approximately 10 to 50 pg/ml, depending on the extent of SHS exposure and intensity of active smoking. Creatinine-corrected cut points are estimated to range from 5 to 40 pg/creatinine. The cut point will be higher in a population in which active smokers smoke more cigarettes per day and more people are exposed to higher levels of SHS.
The urine NNAL cut points showed excellent sensitivity and specificity for detecting active smoking. For example, the cut point of 14.4 pg/ml from ROC analysis provided 94.6% sensitivity and 93.4% specificity. For comparison, analysis of serum cotinine data from NHANES collected in 1999 to 2004, the optimal cut point in adolescents was 3 ng/ml with a sensitivity of 86.5% and specificity of 93.1%.(32) While the populations of adolescents and the gold standards for smoking (urine cotinine in our study vs self-report in NHANES) were different in the two studies, our analysis suggests that urine NNAL will perform as well or possibly better than serum cotinine as a discriminator of smoking vs non-smoking.
Among non-smokers, we found that the absolute NNAL concentration was higher in African American compared to Latino nonsmokers. This suggests that the prevalence of exposure to tobacco smoke is greater among black adolescents. Others have reported similar findings with NNAL levels comparing African Americans and whites.(27)
We reported previously that in San Francisco, African American young children and adolescents have higher levels of cotinine compared to children of other race/ethnicity.(3,34) Higher cotinine levels could be due to greater SHS exposure and/or due to metabolic differences. Blacks carry a higher frequency of slow metabolism gene alleles for cotinine oxidation (CYP2A6) and cotinine glucuronidation (UGT2B10).(11-13) These genetic differences could result in higher levels of cotinine for any given daily uptake of nicotine. The finding of much higher NNAL levels in African Americans without a difference in the NNAL/cotinine ratio supports that idea that African American adolescent non-smokers are exposed to greater levels of tobacco smoke that those in other racial/ethnic groups rather than having higher cotinine levels due to genetic metabolic differences. In support of the idea of greater exposure, surveillance data from another California study found that the prevalence of smoking in the home is higher in homes of African Americans compared to white, Latino or Asian homes.(14)
The prevalence of active smoking assessed by urine cotinine in our African American subjects was 32%, which is surprisingly high. The overall smoking prevalence in African Americans in San Francisco from 2014-2015 was 13.2%.(35) We were unable to find data on smoking prevalence among adolescents in San Francisco. However, the California Department of Public Health reported the state-wide smoking prevalence for high school students (grade 9-12) in 2012 was 9.5% for blacks, compared to 13% for white non-Hispanic, 10.4% for Hispanics and 5.9% for Asians.(30) The high active smoking rates in our African Americans subjects may be related to lower socioeconomic status as mentioned previously, and may also be related to the use of blunts – hollowed-out cigars filled with marijuana.(36) Blunt use is more common in African Americans compared to other racial/ethnic groups, and could contribute to more African American youth being classified as both active and heavy SHS exposure.
The NNAL/cotinine ratio can also be used as a biomarker to distinguish active vs passive smoking.(16) The present study found that the optimal ratio cut points were 1.07 or 1.85 × 10⁻³ by ROC analysis. This compares to the ratio cut point of 0.74 × 10⁻³ that we determined in a prior comparison of adults who were regular smokers vs those with heavy SHS exposure.(16) Differences in the optimal cut point are expected because, at present, we are trying to distinguish any active smoking from all non-smoking, while in our prior study we tried to distinguish active from heavy passive smoking. In any case, comparing sensitivity and specificity, the performance of urine NNAL alone was superior to that of the NNAL/cotinine ratio, indicating no advantage of the latter in discriminating between smokers and non-smokers.
While analysis of urine NNAL detected exposure in most of our study’s adolescents, the health consequences of low-level passive smoke exposure are still unclear. Many of the constituents of SHS and THS have the potential to cause adverse health effects, and a threshold level for toxicity has not been determined. With respect to NNAL as a biomarker for human disease from SHS, in non-smokers with chronic obstructive lung disease who are exposed to SHS, urine NNAL was a better predictor of symptoms and impaired quality of life than was cotinine.(37) Presumably this is because NNAL has a long half-life and provided a measure of exposure over long periods of time. Furthermore, urine NNAL was linearly related to COPD severity, without evidence of a threshold level for harm. The U.S. Surgeon General has indicated that there is no safe level of SHS exposure.(38) Further epidemiologic research is needed to determine the particular health consequences of low level passive smoke exposure among adolescents.
Limitations of our study include that our subjects were patients in one urban public hospital in a city where the overall smoking prevalence is relatively low. Many attended a hospital clinic for medical care, which could be a marker for greater smoke exposure risk. In addition, our subjects were primarily Latino and African American, thereby reducing generalizability. A strength of study is that because the study was non-consented, there was no subject self-selection bias. We think our data are likely representative of urban economically disadvantaged adolescents and our findings are expected to be relevant to similar populations in other cities.
In conclusion, using urine NNAL as a biomarker of tobacco smoke exposure we confirm a prior finding based on urine cotinine of nearly ubiquitous tobacco exposure in adolescents seen in pediatric clinics in an urban public hospital. We find that urine NNAL detects a higher prevalence of exposure than cotinine. This could be due to difference in assay sensitivity to a given level of exposure, or to the fact that NNAL detects exposure over a longer duration of time, and would be expected to be more sensitive to intermittent exposure. We present novel data on the optimal NNAL cut point to distinguish active from passive smoking. We find that among non-smokers urine NNAL exposure is more frequent and NNAL levels are higher in African Americans compared to other racial/ethnic groups, indicating higher levels of SHS or other sources of tobacco exposure.
Given the high level of tobacco exposure in our population of economically disadvantaged adolescents and the well-established risks to health of tobacco smoke exposure, we suggest that routine biochemical screening be considered to identify and reduce exposure of such individuals. Our data indicate that either cotinine or NNAL would be suitable analytes for biochemical screening, although NNAL would detect more exposed adolescents.
Supplementary Material
Acknowledgments
We thank Faith Allen for data management, Sandra Tinetti and the nurses in the Children’s Health Center at Zuckerberg San Francisco General Hospital for clinical research assistance and Trisha Mao, Lita Ramos and Lawrence Chan for performing analytical chemistry.
GRANT SUPPORT
This work was supported by the UCSF Bland Lane Center of Excellence on Secondhand Smoke funded by the Flight Attendants Medical Research, by the National Institute on Drug Abuse (NIDA) of the National Instititues of Health (NIH) under award number P30 DA012393 (to N.L. Benowitz) and by the National Center for Research Resources (NCRR) of the NIH under award number S10 RR026437 (to P. Jacob III). The content is solely the responsibility of the authors and does not necessarily represent the official views of the National Institutes of Health
Footnotes
POTENTIAL CONFLICTS OF INTEREST
Dr. Benowitz is a consultant to several pharmaceutical companies that market medications to aid smoking cessation and has served as a paid expert witness in litigation against tobacco companies. The other authors have no conflicts to disclose.
AUTHORS CONTRIBUTIONS
Conception and design: NLB, NN, SJ, DD, GSH, PJ
Analysis and interpretation of data: NLB, NN, NA, PJ
Writing, review, and/or revision of the manuscript: NLB, NN, SJ, DD, GSH, NA, PJ
Administrative, technical, or material support: NLB, NN, NA, PJ
Study supervision: NLB, NN, SJ, DD
References
- 1.USDHHS. Respiratory effects in children from exposure to seconhand smoke. Washington, DC: Office of the Surgeon General; 2006. [Google Scholar]
- 2.Tyas SL, Pederson LL. Psychosocial factors related to adolescent smoking: a critical review of the literature. Tobacco control. 1998;7(4):409–20. doi: 10.1136/tc.7.4.409. [DOI] [PMC free article] [PubMed] [Google Scholar]
- 3.Benowitz NL, Jain S, Dempsey DA, Nardone N, Helen GS, Jacob P. Urine Cotinine Screening Detects Nearly Ubiquitous Tobacco Smoke Exposure in Urban Adolescents. Nicotine & tobacco research: official journal of the Society for Research on Nicotine and Tobacco. 2016 doi: 10.1093/ntr/ntw390. [DOI] [PMC free article] [PubMed] [Google Scholar]
- 4.Hukkanen J, Jacob P, 3rd, Benowitz NL. Metabolism and disposition kinetics of nicotine. Pharmacological reviews. 2005;57(1):79–115. doi: 10.1124/pr.57.1.3. [DOI] [PubMed] [Google Scholar]
- 5.SRNT. Biochemical verification of tobacco use and cessation. Nicotine & tobacco research: official journal of the Society for Research on Nicotine and Tobacco. 2002;4(2):149–59. doi: 10.1080/14622200210123581. [DOI] [PubMed] [Google Scholar]
- 6.Hecht SS. Tobacco carcinogens, their biomarkers and tobacco-induced cancer. Nature reviews Cancer. 2003;3(10):733–44. doi: 10.1038/nrc1190. [DOI] [PubMed] [Google Scholar]
- 7.Goniewicz ML, Havel CM, Peng MW, Jacob P, 3rd, Dempsey D, Yu L, et al. Elimination kinetics of the tobacco-specific biomarker and lung carcinogen 4-(methylnitrosamino)-1-(3-pyridyl)-1-butanol. Cancer epidemiology, biomarkers & prevention: a publication of the American Association for Cancer Research, cosponsored by the American Society of Preventive Oncology. 2009;18(12):3421–5. doi: 10.1158/1055-9965.EPI-09-0874. [DOI] [PMC free article] [PubMed] [Google Scholar]
- 8.Jacob P, 3rd, Benowitz NL, Destaillats H, Gundel L, Hang B, Martins-Green M, et al. Thirdhand Smoke: New Evidence, Challenges, and Future Directions. Chemical research in toxicology. 2017;30(1):270–94. doi: 10.1021/acs.chemrestox.6b00343. [DOI] [PMC free article] [PubMed] [Google Scholar]
- 9.Caraballo RS, Giovino GA, Pechacek TF, Mowery PD, Richter PA, Strauss WJ, et al. Racial and ethnic differences in serum cotinine levels of cigarette smokers: Third National Health and Nutrition Examination Survey, 1988-1991. Jama. 1998;280(2):135–9. doi: 10.1001/jama.280.2.135. [DOI] [PubMed] [Google Scholar]
- 10.Homa DM, Neff LJ, King BA, Caraballo RS, Bunnell RE, Babb SD, et al. Vital signs: disparities in nonsmokers’ exposure to secondhand smoke–United States, 1999–2012. MMWR Morbidity and mortality weekly report. 2015;64(4):103–8. [PMC free article] [PubMed] [Google Scholar]
- 11.Benowitz NL, St Helen G, Dempsey DA, Jacob P, 3rd, Tyndale RF. Disposition kinetics and metabolism of nicotine and cotinine in African American smokers: impact of CYP2A6 genetic variation and enzymatic activity. Pharmacogenetics and genomics. 2016;26(7):340–50. doi: 10.1097/FPC.0000000000000222. [DOI] [PMC free article] [PubMed] [Google Scholar]
- 12.Patel YM, Stram DO, Wilkens LR, Park SS, Henderson BE, Le Marchand L, et al. The contribution of common genetic variation to nicotine and cotinine glucuronidation in multiple ethnic/racial populations. Cancer epidemiology, biomarkers & prevention: a publication of the American Association for Cancer Research, cosponsored by the American Society of Preventive Oncology. 2015;24(1):119–27. doi: 10.1158/1055-9965.EPI-14-0815. [DOI] [PMC free article] [PubMed] [Google Scholar]
- 13.Zhu AZ, Renner CC, Hatsukami DK, Swan GE, Lerman C, Benowitz NL, et al. The ability of plasma cotinine to predict nicotine and carcinogen exposure is altered by differences in CYP2A6: the influence of genetics, race, and sex. Cancer epidemiology, biomarkers & prevention: a publication of the American Association for Cancer Research, cosponsored by the American Society of Preventive Oncology. 2013;22(4):708–18. doi: 10.1158/1055-9965.EPI-12-1234-T. [DOI] [PMC free article] [PubMed] [Google Scholar]
- 14.Health CDoP, editor. California Tobacco Control Program. California Tobacco Facts and Figures 2015. Sacramento, CA: California Department of Public Health; 2015. [Google Scholar]
- 15.Benowitz N, Goniewicz ML, Eisner MD, Lazcano-Ponce E, Zielinska-Danch W, Koszowski B, et al. Urine cotinine underestimates exposure to the tobacco-derived lung carcinogen 4-(methylnitrosamino)-1-(3-pyridyl)-1-butanone in passive compared with active smokers. Cancer epidemiology, biomarkers & prevention: a publication of the American Association for Cancer Research, cosponsored by the American Society of Preventive Oncology. 2010;19(11):2795–800. doi: 10.1158/1055-9965.EPI-10-0497. [DOI] [PMC free article] [PubMed] [Google Scholar]
- 16.Goniewicz ML, Eisner MD, Lazcano-Ponce E, Zielinska-Danch W, Koszowski B, Sobczak A, et al. Comparison of urine cotinine and the tobacco-specific nitrosamine metabolite 4-(methylnitrosamino)-1-(3-pyridyl)-1-butanol (NNAL) and their ratio to discriminate active from passive smoking. Nicotine & tobacco research: official journal of the Society for Research on Nicotine and Tobacco. 2011;13(3):202–8. doi: 10.1093/ntr/ntq237. [DOI] [PMC free article] [PubMed] [Google Scholar]
- 17.Vogel RI, Carmella SG, Stepanov I, Hatsukami DK, Hecht SS. The ratio of a urinary tobacco-specific lung carcinogen metabolite to cotinine is significantly higher in passive than in active smokers. Biomarkers: biochemical indicators of exposure, response, and susceptibility to chemicals. 2011;16(6):491–7. doi: 10.3109/1354750X.2011.598565. [DOI] [PMC free article] [PubMed] [Google Scholar]
- 18.Jacob P, 3rd, Havel C, Lee DH, Yu L, Eisner MD, Benowitz NL. Subpicogram per milliliter determination of the tobacco-specific carcinogen metabolite 4-(methylnitrosamino)-1-(3-pyridyl)-1-butanol in human urine using liquid chromatography-tandem mass spectrometry. Analytical chemistry. 2008;80(21):8115–21. doi: 10.1021/ac8009005. [DOI] [PMC free article] [PubMed] [Google Scholar]
- 19.Jacob P, 3rd, Yu L, Duan M, Ramos L, Yturralde O, Benowitz NL. Determination of the nicotine metabolites cotinine and trans-3′-hydroxycotinine in biologic fluids of smokers and non-smokers using liquid chromatography-tandem mass spectrometry: biomarkers for tobacco smoke exposure and for phenotyping cytochrome P450 2A6 activity. Journal of chromatography B, Analytical technologies in the biomedical and life sciences. 2011;879(3–4):267–76. doi: 10.1016/j.jchromb.2010.12.012. [DOI] [PMC free article] [PubMed] [Google Scholar]
- 20.Fraley C, Raferty AE. Model-based Clustering, Discriminant Analysis and Density Estimation. Journal of the Ameican Statistical Association. 2002;97(458):611–31. [Google Scholar]
- 21.Fraley C, Raferty AE, Murphy TB, Scrucca L. mclust Version 4 for R. Normal Mixture Modeling for Model-Based Clustering, Classification, and Density Estimation. Seattle, WA: Department of Statistics, University of Washington; 2012. [Google Scholar]
- 22.Schisterman EF, Perkins NJ, Liu A, Bondell H. Optimal cut-point and its corresponding Youden Index to discriminate individuals using pooled blood samples. Epidemiology (Cambridge, Mass) 2005;16(1):73–81. doi: 10.1097/01.ede.0000147512.81966.ba. [DOI] [PubMed] [Google Scholar]
- 23.Youden WJ. Index for rating diagnostic tests. Cancer. 1950;3(1):32–5. doi: 10.1002/1097-0142(1950)3:1<32::aid-cncr2820030106>3.0.co;2-3. [DOI] [PubMed] [Google Scholar]
- 24.Avila-Tang E, Al-Delaimy WK, Ashley DL, Benowitz N, Bernert JT, Kim S, et al. Assessing secondhand smoke using biological markers. Tobacco control. 2013;22(3):164–71. doi: 10.1136/tobaccocontrol-2011-050298. [DOI] [PMC free article] [PubMed] [Google Scholar]
- 25.Bernert JT, Pirkle JL, Xia Y, Jain RB, Ashley DL, Sampson EJ. Urine concentrations of a tobacco-specific nitrosamine carcinogen in the U.S. population from secondhand smoke exposure. Cancer epidemiology, biomarkers & prevention: a publication of the American Association for Cancer Research, cosponsored by the American Society of Preventive Oncology. 2010;19(11):2969–77. doi: 10.1158/1055-9965.EPI-10-0711. [DOI] [PubMed] [Google Scholar]
- 26.Schick SF, Blount BC, Jacob P, 3rd, Saliba NA, Bernert JT, El Hellani A, et al. Biomarkers of Exposure to New and Emerging Tobacco and Nicotine Delivery Products. American journal of physiology Lung cellular and molecular physiology. 2017 doi: 10.1152/ajplung.00343.2016. ajplung.00343.2016. [DOI] [PMC free article] [PubMed] [Google Scholar]
- 27.Wei B, Blount BC, Xia B, Wang L. Assessing exposure to tobacco-specific carcinogen NNK using its urinary metabolite NNAL measured in US population: 2011-2012. Journal of exposure science & environmental epidemiology. 2016;26(3):249–56. doi: 10.1038/jes.2014.88. [DOI] [PMC free article] [PubMed] [Google Scholar]
- 28.Xia Y, Bernert JT, Jain RB, Ashley DL, Pirkle JL. Tobacco-specific nitrosamine 4-(methylnitrosamino)-1-(3-pyridyl)-1-butanol (NNAL) in smokers in the United States: NHANES 2007-2008. Biomarkers: biochemical indicators of exposure, response, and susceptibility to chemicals. 2011;16(2):112–9. doi: 10.3109/1354750X.2010.533288. [DOI] [PubMed] [Google Scholar]
- 29.Siegmund B, Leitner E, Pfannhauser W. Determination of the nicotine content of various edible nightshades (Solanaceae) and their products and estimation of the associated dietary nicotine intake. Journal of agricultural and food chemistry. 1999;47(8):3113–20. doi: 10.1021/jf990089w. [DOI] [PubMed] [Google Scholar]
- 30.California Tobacco Control Program. California Tobacco Facts and Figures 2016. Sacaramento, A: California Department of Public Health; 2016. [Google Scholar]
- 31.Hecht SS, Ye M, Carmella SG, Fredrickson A, Adgate JL, Greaves IA, et al. Metabolites of a tobacco-specific lung carcinogen in the urine of elementary school-aged children. Cancer epidemiology, biomarkers & prevention: a publication of the American Association for Cancer Research, cosponsored by the American Society of Preventive Oncology. 2001;10(11):1109–16. [PubMed] [Google Scholar]
- 32.Benowitz NL, Bernert JT, Caraballo RS, Holiday DB, Wang J. Optimal serum cotinine levels for distinguishing cigarette smokers and nonsmokers within different racial/ethnic groups in the United States between 1999 and 2004. Am J Epidemiol. 2009;169(2):236–48. doi: 10.1093/aje/kwn301. [DOI] [PubMed] [Google Scholar]
- 33.Benowitz NL, Dains KM, Dempsey D, Herrera B, Yu L, Jacob P., 3rd Urine nicotine metabolite concentrations in relation to plasma cotinine during low-level nicotine exposure. Nicotine & tobacco research: official journal of the Society for Research on Nicotine and Tobacco. 2009;11(8):954–60. doi: 10.1093/ntr/ntp092. [DOI] [PMC free article] [PubMed] [Google Scholar]
- 34.Dempsey DA, Meyers MJ, Oh SS, Nguyen EA, Fuentes-Afflick E, Wu AH, et al. Determination of tobacco smoke exposure by plasma cotinine levels in infants and children attending urban public hospital clinics. Archives of pediatrics & adolescent medicine. 2012;166(9):851–6. doi: 10.1001/archpediatrics.2012.170. [DOI] [PMC free article] [PubMed] [Google Scholar]
- 35.Research CfHP. Adults who Smoke. Los Angeles, CA: UCLA Center for Health Policy Research; 2014. California Health Interview Survey: CHIS 2014–2015. [Google Scholar]
- 36.Delnevo CD, Hrywna M. The relationship of cigars, marijuana, and blunts to adolescent bidi use. Public Health Rep. 2006;121(5):603–8. doi: 10.1177/003335490612100516. [DOI] [PMC free article] [PubMed] [Google Scholar]
- 37.Eisner MD, Jacob P, 3rd, Benowitz NL, Balmes J, Blanc PD. Longer term exposure to secondhand smoke and health outcomes in COPD: impact of urine 4-(methylnitrosamino)-1-(3-pyridyl)-1-butanol. Nicotine & tobacco research: official journal of the Society for Research on Nicotine and Tobacco. 2009;11(8):945–53. doi: 10.1093/ntr/ntp091. [DOI] [PMC free article] [PubMed] [Google Scholar]
- 38.Office on Smoking and Health(US) The Health Consequences of Involuntary Exposure to Tobacco Smoke: A Report of the Surgeon General. Atlanta, GA: Centers for Disease Control and Prevention (US); 2006. [PubMed] [Google Scholar]
Associated Data
This section collects any data citations, data availability statements, or supplementary materials included in this article.