
Figure 6.
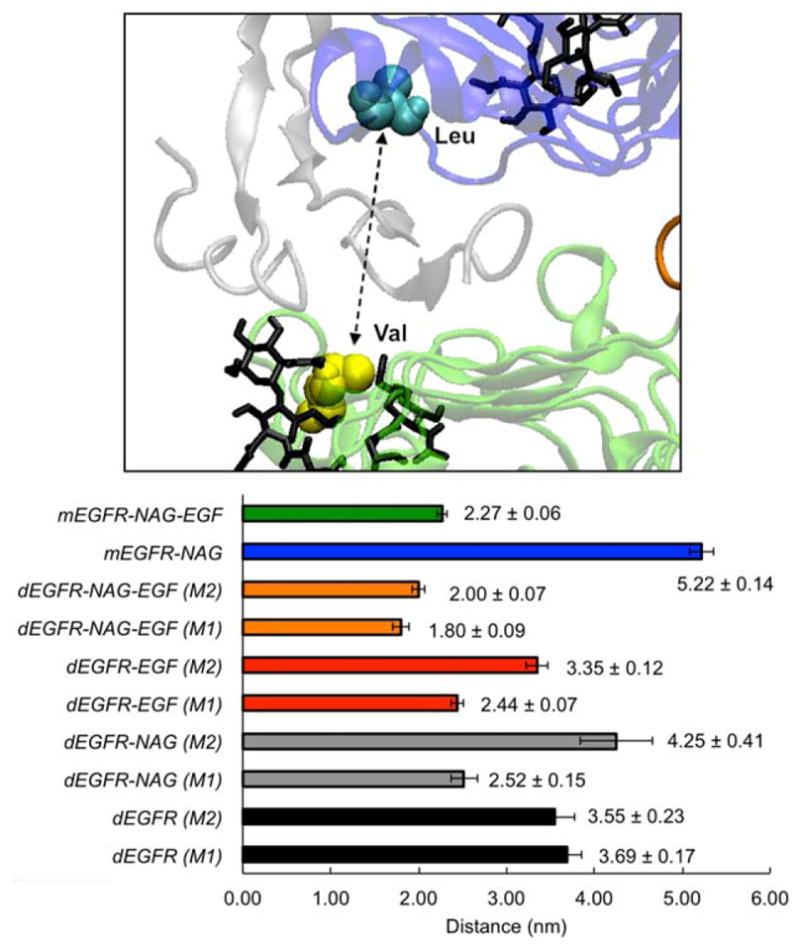
EGFR–EGF binding pocket behavior during molecular dynamics simulations. Upper figure depicts the EGF binding pocket, flanked by Residues L12 and V348. The lower graph shows the average distances (along with its standard deviation) between EGFR residues L12 and V348 for all systems between the 30 and 50 ns time.