

Abstract
Background
While generic drugs are therapeutically equivalent to brand drugs, some patients and healthcare providers remain uncertain about whether they produce identical outcomes. Authorized generics, which are identical in formulation to corresponding brand drugs but marketed as a generic, provide a unique post-marketing opportunity to study whether utilization patterns are influenced by perceptions of generic drugs.
Objectives
To compare generic-to-brand switchback rates between generics and authorized generics.
Methods
A retrospective cohort study was conducted using claims and electronic health records data from a regional U.S. healthcare system. Ten drugs with authorized generics and generics marketed between 1999 and 2014 were evaluated. Eligible adult patients received a brand drug during the 6 months preceding generic entry, and then switched to a generic or authorized generic. Patients in this cohort were followed for up to 30 months from the index switch date to evaluate occurrence of generic-to-brand switchbacks. Switchback rates were compared between patients on authorized generics versus generics using Kaplan-Meier curves and Cox proportional hazards models, controlling for individual drug effects, age, sex, Charlson comorbidity score, pre-index drug use characteristics, and pre-index healthcare utilization.
Results
Among 5,542 unique patients that switched from brand-to-generic or brand-to-authorized generic, 264 (4.8%) switched back to the brand drug. Overall switchback rates were similar for authorized generics compared with generics (HR=0.86; 95% CI 0.65-1.15). The likelihood of switchback was higher for alendronate (HR=1.64; 95% CI 1.20-2.23) and simvastatin (HR=1.81; 95% CI 1.30-2.54) and lower for amlodipine (HR=0.27; 95% CI 0.17-0.42) compared with other drugs in the cohort.
Conclusions
Overall switchback rates were similar between authorized generic and generic drug users, indirectly supporting similar efficacy and tolerability profiles for brand and generic drugs. Reasons for differences in switchback rates among specific products need to be further explored.
Keywords: generic, authorized generic, utilization, switchback
INTRODUCTION
Generic drugs play an important cost-saving role in the U.S. healthcare system. In 2012 alone, a healthcare savings of $217 billion was attributed to generic drug use.1 But, not all patients and providers are willing to use generic drugs. This is due partially to prior studies that suggest that generic and brand drugs are not perfectly interchangeable.2,3 Patients’ or physicians’ personal opinions about generic drugs also may affect their acceptance, and this can indirectly affect the perceived safety and efficacy of generic drugs.4–9 For example, a 2016 national survey found that 13 percent of respondents believed that branded drugs are more effective than generics, and 20 percent of respondents believed that generic drugs have different side effects than branded drugs.10 In a parallel survey of physicians, 11 percent of physicians expressed negative perceptions about the efficacy of generic drugs and 27 percent believed they caused more adverse effects.11 So while generic drugs can clearly save healthcare dollars, some doubt remains among the patient and provider communities about whether generic and brand drugs yield the same outcomes.
In lieu of the randomized controlled trials required for a branded drugs approval via a new drug application (NDA), generic drugs are approved via an abbreviated new drug application (ANDA) since safety and efficacy of the active pharmaceutical ingredient is established during the approval process for the branded drug. Generic drug applications are termed “abbreviated” because they are generally not required to include preclinical (animal) and clinical (human) data to establish safety and effectiveness. The ANDA requires generic drugs to demonstrate pharmaceutical equivalence and bioequivalence by showing that the same amount of active drug ingredient reaches the blood stream of healthy patients in the same amount of time (i.e., bioavailability).12 Therefore, while pharmaceutical and bioequivalence are established for generic drugs, therapeutic equivalence is assumed and not directly tested.
Instead of direct testing of therapeutic equivalence, post-marketing evaluation of brand vs. generic utilization behavior and outcomes can help provide indirect evidence to support or refute their comparability. Several studies have taken such an approach.13–16 Vari and colleagues followed a prospective cohort of 58 epilepsy patients to assess brand-generic interchange of levetiracetam, as well as incidence of self-reported adverse events and loss of seizure control.13 No statistically significant difference was found in number of adverse events or seizures in cases pre-generic switch and six months post-switch, with an overall 3.4% switchback to brand-name medication. Similarly, using Medicaid claims data in a retrospective crossover cohort study of 616 patients, Hartung et al. found no statistically significant increase in hospitalizations or emergency room visits after brand-generic switch for lamotrigine.14 This is consistent with earlier findings from Erickson et al.,15 in which a retrospective cohort of post-generic switch patients were compared to a cohort of brand-name medication users for lamotrigine, divalproex, or phenytoin. A recent prospective cohort study by Kim and colleagues found no statistically significant differences in intraocular pressure for glaucoma patients after switching from brand to generic dorzolamide/timolol ophthalmic drops.16
While prior studies provide a foundation for post-marketing surveillance of brand versus generic switching and clinical outcomes, the methods seen thus far do not adequately address selection bias (e.g., price and access may differentially affect who gets brand vs. who gets generic) nor does it account for patient and provider perceptions of generic drugs that can impact prescribing and healthcare utilization patterns. Authorized generic drugs provide an interesting research opportunity for overcoming these biases. Authorized generics (AGs) are drugs that contain the same active and inactive ingredients as the branded product, authorized under the same NDA, with the only difference being that they are labeled and marketed as generic drugs.17 This is in contrast to ANDA-approved generics (referred to as simply “generics” from here forward). Clinical outcomes of these generics are not directly compared with the reference listed product. Since AGs and generics are not differentiated in their prescribing, payment, or distribution to patients (i.e., they are both treated and perceived to be “generics”), any biases should be equally applied to both products. Therefore, we compared AG and generic utilization patterns as a proxy for a brand vs. generic comparison. We considered the act of switching back to a brand product after trying a generic product to be a broad marker for lack of generic efficacy or tolerability. Under this assumption, we compared AG-to-brand and generic-to-brand switchback rates. Results of our analyses can help to determine if there is post-marketing evidence to support potential differences between brands and generics, even after minimizing potential selection and perception biases.
METHODS
Study Design
We conducted a series of retrospective cohort studies among patients who received select branded drugs prior to generic drug market entry, and then were switched to an AG or generic within 30 months of generic entry (Figure 1). Included drugs (Table 1) were selected based on evidence that both an AG and generic were marketed at some point between the years 1999 and 2014, with a sufficient sample of users (≥30) in our study data. These drugs included alendronate (Fosamax), amlodipine (Norvasc), citalopram (Celexa), gabapentin (Neurontin), glimepiride (Amaryl), losartan (Cozaar), metformin extended-release [ER] (Glucophage XR), paroxetine (Paxil), sertraline (Zoloft), and simvastatin (Zocor). The sample of drugs was not designed to reflect a homogenous class of agents, but rather this diverse group of agents allowed examination across a broad market of agents. The date of the first generic prescription in our data was considered the index date for each drug, and this date marked the beginning of follow-up to evaluate generic-to-brand switchback patterns over the subsequent 30 months. The National Drug Code (NDC) was used to differentiate brand, AG, and generic drugs. Drugs were first considered as individual cohorts, and then combined as an aggregated cohort with time anchored to the index date for each patient-drug combination. Combined analyses controlled for individual drug effects. Unless otherwise specified, results are shown for the combined population. The study was approved by the Institutional Review Boards of the Marshfield Clinic Research Foundation and Auburn University, and by the U.S. FDA Research Involving Human Subjects Committee (RIHSC).
Figure 1.

Study design for identifying the switchback cohort
Table 1.
Products with authorized generics assessed in this study
| Drug | Form/Strentghs | Therapeutic Class | Date of First Reference Listed Drug (Brand) | Date of First Authorized Generic (AG) | Date of First ANDA-Approved Generic (Generic) | Number of FDA ANDA Approvals* |
|---|---|---|---|---|---|---|
| alendronate | Tablets, 35 & 70MG | Osteoporosis | 9/29/95 | 2/6/08 | 8/4/08 | 13 |
| amlodipine | Tablets, 2.5, 5 & 10MG | Cardiovascular | 7/31/92 | 3/23/07 | 3/23/07 | 34 |
| citalopram | Tablets, 10, 20 & 40MG | Antidepressant | 7/17/98 | 10/28/04 | 10/28/04 | 25 |
| gabapentin | Capsules, 100, 300 & 400MG | Antiepileptic | 12/30/93 | 10/8/04 | 10/4/04 | 18 |
| glimepiride | Tablets, 1, 2 & 4MG | Diabetes | 11/30/95 | 9/30/05 | 10/6/05 | 15 |
| losartan | Tablets, 25, 50 & 100MG | Cardiovascular | 4/14/95 | 4/6/10 | 4/6/10 | 18 |
| metformin | Extended Release Tablets, 500MG | Diabetes | 10/13/00 | 10/10/03 | 12/01/03 | 20 |
| paroxetine | Tablets, 10, 20, 30 & 40MG | Antidepressant | 12/29/92 | 3/5/03 | 9/8/03 | 12 |
| sertraline | Tablets, 25, 50 & 100MG | Antidepressant | 12/30/91 | 8/14/06 | 8/14/06 | 26 |
| simvastatin | Tablets, 5, 10, 20, 40 & 80MG | Cardiovascular | 12/23/91 | 6/23/06 | 6/23/06 | 14 |
Number of Abbreviated New Drug Applications (ANDAs) approved by the FDA for each drug as of December 31, 2014. A sponsor company may have multiple ANDAs fror the same drug.
AG = authorized generic; “Generic” refers to all other independing generics filed under an ANDA
Data
Administrative claims data from a regional insurance provider (Security Health Plan (SHP)) were combined with electronic health record (EHR) data from the Marshfield Clinic (MC), which is an integrated health care delivery system that provides the majority of healthcare services to 1.5 million patients residing in more than 50 locations in northern, central, and western Wisconsin. On average, 102,700 SHP insured beneficiaries have full-year insurance coverage and approximately 65% of the SHP population with full-year insurance coverage have evidence of use of MC clinics and providers. The research data warehouse used for this study did not contain charge or reimbursement-related fields for the SHP claims.
Study Sample
Data from 1999 through 2014 were used to apply the following inclusion criteria: 1) at least 1 brand prescription of interest during the 6-months pre-generic availability and at least 1 AG or generic prescription of interest within 30 months of generic entry; and 2) continuous enrollment in the 6 months prior to generic introduction and through at least the first generic prescription fill, with continuous enrollment defined as no gaps in enrollment greater than 31 days. The final sample included 5,929 unique person-drug combinations, representing 5,542 unique patients taking at least 1 included brand drug and then switching to a generic.
Main Outcome Measures
Generic-to-brand switchback was defined as a patient switching from the AG or generic product back to the branded drug. We assumed that the first dispensing date of the brand drug following AG or generic dispensing reflected the date of the patient’s switchback. Patients who stayed on the generic drug throughout the 30-month observation period or who discontinued treatment were defined as no switchback. Treatment discontinuation was defined as a gap in medication supply exceeding 90 days and follow-up time for these individuals was censored at the time of discontinuation (i.e., date of last available medication supply).
Covariates
Covariates were measured during the 6-month pre-index period, including demographics (age and sex), type of insurance, the proportion of a patient’s prescriptions for other medications that were filled with a brand drug, defined daily dosage of the last prescription prior to generic switch,18 Charlson comorbidity index,19 any pre-index all-cause hospitalizations, any pre-index all-cause ED visits, number of pre-index outpatient visits, and monotherapy or polytherapy status for the condition being treated (polytherapy defined as ≥2 different medications used in the same therapeutic class of interest).
Statistical Analysis
Descriptive statistics were used to summarize characteristics of patients who did and did not switchback to brand, stratifying the switchbacks by whether they were using an AG or generic. Independent sample t-tests and Chi-square tests were used to compare continuous and categorical characteristics, respectively, between the switchback and non-switchback group as well as between the AG and generic switchback groups. Time to the “next change” after the initial generic switch from brand to generic were illustrated separately for the AG vs. generic switch groups, following patients for up to 12 months after the initial generic switch. The “next change” was based on the first appearance of brand or the alternate type of generic. Multivariable Cox proportional hazards models were used to evaluate factors associated with the time to switchback, reporting the median estimated hazard ratio (HR) and 95% confidence interval (CI) across 1000 bootstrapped samples. In this analysis patients were assigned to the last generic product they used before a brand switchback (i.e., we allowed movement among generics). We used the COVSANDWICH option in the SAS statement PROC PHREG adjusting the standard errors with robust covariance estimates to control for within individual correlation. The covariates for insurance type and polypharmacy were excluded from this analysis because almost all of the sample had commercial insurance and polypharmacy was similar across the sample.
Because of market fluctuations in AG and generic availability, follow-up time was censored at the earliest time when we stopped observing claims for either the AG or all existing generics. This prevented detection of brand switchbacks that may have been driven by lack of product availability. All analyses were performed using SAS 9.3 (SAS Institute, Inc., Cary, NC) and the statistical significance was set at P<0.05.
RESULTS
In our sample, the majority (84.9%) switched from brand to generic, while only 15.1% switched to an AG. The cohort included the following distribution by drug: 873 (14.7%) alendronate; 1,445 (24.4%) amlodipine; 744 (12.5%) citalopram; 224 (3.8%) gabapentin; 246 (4.1%) glimepiride; 401 (6.8%) losartan; 87 (1.5%) metformin ER; 630 (10.6%) paroxetine; 695 (11.7%) sertraline; and 584 (9.8%) simvastatin.
Among the full cohort, 264 patients (4.8%) switched back to brand, including 67 (8.0%) in the AG group and 197 (4.2%) in the generic group (Table 2). Compared with patients that did not switchback to brand, the patients that switched back to brand tended to be older (mean 64.4 vs. 60.3 years), more commonly female (79.2% vs. 68.6%), and used a greater proportion of brand medications during the pre-index period (mean proportion 62.0 vs. 58.6). Comparing characteristics of patients that switched back to brand from the AG group vs. the generic group, the patients switching to brand from the AG group were more commonly male (31.3% vs. 17.3% male) and used a lower defined daily dose of the medication of interest during the pre-index period (mean 1.1 vs. 1.2 defined daily doses). All other demographics were similar between the switchback and no switchback groups, as well as between the switchback from AG and switchback from generic groups (P>0.05).
Table 2.
Baseline Characteristics of Switchback Cohort among Participants Who Made the Initial Generic Switch
| Baseline Characteristics | Participants who did not Switchback | All Switchbacks* | Switchback Type** | |
|---|---|---|---|---|
| Authorized Generic to Brand | Generic to Brand | |||
| Full Cohort*** | 5278 | 264 | 67/836 (8.0%) | 197/4706 (4.2%) |
| Demographics | ||||
| Age; mean ± SD | 60.3 ± 17.3* | 64.4 ± 18.2* | 64.1 ± 19.6 | 64.5 ± 17.7 |
| Sex; n (%) male | 1657 (31.4%)* | 55 (20.8%)* | 21 (31.3)%** | 34 (17.3%)** |
| Proportion of pre-index brand medication use; mean ± SD | 58.6 ± 24.4* | 62.0 ± 24.0* | 61.8 ± 22.9 | 62.1 ± 24.4 |
| Defined daily dose prior to switching; mean ± SD | 1.3 ± 0.8 | 1.2 ± 0.7 | 1.1 ± 0.7** | 1.2 ± 0.6** |
| Charlson comorbidity index; mean ± SD | 0.7 ± 1.1 | 0.7 ± 1.2 | 0.8 ± 1.3 | 0.7 ± 1.2 |
| Pre-index hospitalization; n (%) | 517 (9.8%) | 26 (9.8%) | 6 (9.0%) | 20 (10.2%) |
| Pre-index ED visit; n (%) | 749 (14.2%) | 38 (14.4%) | 8 (11.9%) | 30 (15.2%) |
| Count of pre-index outpatient visits (median) | 6.0 | 6.0 | 6.0 | 7.0 |
P<0.05 for comparison of participants who switched back to brand versus participants who did not switch back to brand
P<0.05 for comparison of participants who switched back to brand from a generic versus participants who switched back to brand from an authorized generic; the percentage of switchbacks by switchback type are reflected as a percentage of switchers in the authorized generic and the generic groups, respectively.
Some individuals qualified for multiple drug cohorts. In the full cohort the first person-drug combination was selected and subsequent observations for other drugs were excluded. This results in 5542 unique patients in the full cohort, but 5929 unique person-drug combinations (867 on authorized generic and 5062 on generics)
SD = standard deviation; ED = emergency department
For the most part the switchback rates were similar between the AG and the generic groups, but some individual drugs had relatively small sample size and there was high variability in switchback rates across drugs. For example, in unadjusted analyses there was not a statistically significant difference in the proportion of people that switched back to brand from the AG vs. the generic for alendronate, amlodipine, citalopram, gabapentin, glimepiride, losartan, metformin XR, paroxetine, and sertraline (P>0.05). For simvastatin, statistically significantly more patients on AG (28/59 [47.5%]) switched back to brand than patients on generic (22/525 [4.2%]). These data are illustrated in Figure 2.
Figure 2.
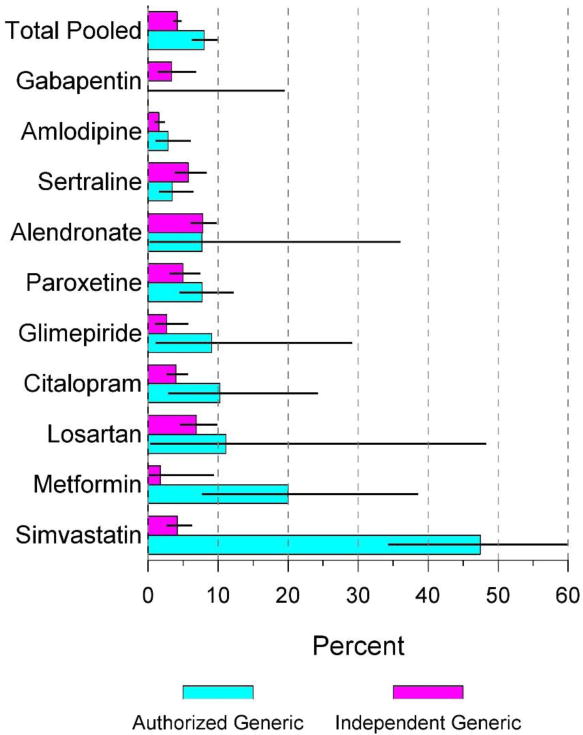
Unadjusted brand switchback from authorized generic vs. generic
In evaluation of unadjusted utilization patterns for each drug, there was a general trend towards a higher percentage of switchbacks for the AG groups compared to the generic groups (e.g., amlodipine, paroxetine, glimepiride, citalopram, losartan, metformin XR, and simvastatin). Part of this trend might be explained by the more volatile usage patterns we observed for AGs (Figure 3). For example, Panel A of Figure 3 illustrates the time to the next medication change after initial switch from brand to generic drug. By 12 months, approximately 50% of the AG users had switched to a different product, and the majority of these switchers were moving to a generic rather than back to the branded product. In contrast, Panel B of Figure 3 illustrates that patients initially switching to the generic were more likely to remain on a generic after 12 months with more than 85% of the generic users continuing on a generic. The greater overall product switching patterns for AG drugs could be involved in the AG to brand switchback trends we observed.
Figure 3.

Time to next change after initial switch from brand to generic drug
In the Cox proportional hazards models (Table 3), the overall rate of AG-to-brand and generic-to-brand switchbacks were similar (HR=0.86; 95% CI 0.65-1.15). Significant covariates included age (HR=1.02; 95% CI 1.01-1.02), sex (reference=female; HR=0.59; 95% CI 0.44-0.80), and proportion of pre-index brand medication use (HR=2.43; 95% CI 1.45-4.07). The proportional hazards model also shows specific drug type to have a conditional effect on generic-to-brand switchback, with simvastatin (HR=1.81; 95% CI 1.30-2.54) and alendronate (HR=1.64; 95% CI 1.20-2.23) showing a higher likelihood of switchback, and amlodipine (HR=0.27; 95% CI 0.17-0.42) a lower likelihood of switchback. Other covariates and individual drugs were not statistically significantly associated with switchback (P>0.05).
Table 3.
Conditional effect of factors associated with generic-to-brand switchback
| Hazard Ratio | 95% Confidence Interval | |
|---|---|---|
| Generic (reference = authorized generic) | 0.86 | 0.65–1.15 |
| Age | 1.02* | 1.01–1.02 |
| Male | 0.59* | 0.44–0.80 |
| Proportion of pre-index brand medication use | 2.43* | 1.45–4.07 |
| Defined daily dose prior to switching | 0.85 | 0.72–1.01 |
| Charlson comorbidity index | 1.02 | 0.90–1.16 |
| Pre-index hospitalization | 0.87 | 0.52–1.48 |
| Pre-index ED visit | 1.02 | 0.67–1.56 |
| Count of pre-index outpatient visits | 1.02 | 1.00–1.02 |
| Drug | ||
| Alendronate | 1.64* | 1.20–2.23 |
| Amlodipine | 0.27* | 0.17–0.42 |
| Citalopram | 1.16 | 0.79–1.70 |
| Gabapentin | 0.74 | 0.34–1.62 |
| Glimepiride | 0.68 | 0.31–1.46 |
| Losartan | 1.29 | 0.80–2.10 |
| Metformin ER | 1.03 | 0.46–2.30 |
| Paroxetine | 1.09 | 0.74–1.60 |
| Sertraline | 1.08 | 0.71–1.62 |
| Simvastatin | 1.81* | 1.30–2.54 |
The eligible sample includes all people that switched from brand to a generic or authorized generic. A series of regression models, each with an indicator for one drug, compared each specific drug with all other drugs combined and results are presented for each drug for the 1000 bootstrapped samples.
P<0.05
DISCUSSION
While generic drugs have high cost-savings, there is ongoing debate in the literature about whether brands and generics have clinically equivalent efficacy and tolerability.1–3 This study identified a cohort of patients that switched from a brand to a generic drug, and then quantified generic-to-brand switchback rates. We minimized study design bias that can be introduced by patient and provider perceptions of generic drugs by comparing these switchback patterns among patients using AGs (brand drug proxy) as opposed to generics. Overall, we found a similar likelihood of generic-to-brand switchbacks between AG and generic users (P>0.05). This finding suggests that after methodologically accounting for generic drug perception biases that may complicate interpretation of generic and brand utilization patterns, and controlling for other factors that could influence the likelihood of switching from a generic back to a brand drug, there is not sufficient evidence to indicate that differences between ANDA-approved products (our generic group) and the reference listed drug (our AG group) are driving generic-to-brand switchbacks. Broadly speaking, the policy implication of this conclusion is that switchbacks from generic to brand are likely not related to specific differences between ANDA- and NDA-approved products.
Overall in our cohort we observed generic-to-brand switchbacks in 4.8% of the population taking one of the study drugs. These results are relatively consistent with those seen in previous, including a 3.4% generic-to-brand switchback for levetiracetam13 and 7.1% generic-to-brand switchback for statin users.20 The Chressanthis et al. statin study also found that the likelihood of generic-to-brand switchback increased with dose (16.1% for the highest simvastatin dose), patient age, and comorbidities, concluding that older and sicker patients may be more sensitive to side effects and efficacy considerations.20 While we also found older age to be related to switchback, we did not find dose or comorbidities (measured by the Charlson score) to be statistically significantly related to switchback in our overall cohort or even in the cohort of just simvastatin users (data not shown). We did, however, find female sex and higher proportions of pre-index brand medication use to be predictive of higher likelihood of generic-to-brand switchback. Our finding of female sex and pre-index brand preferences provides further indication that personal preferences and characteristics are important factors to consider in generic drug use. Although we were unable to measure factors such as income, education, race, or health education background,21 these characteristics also could be important and should be considered in future studies.
While we found overall that generic-to-brand switchback rates were similar for AGs and generics, our finding of differential switchback rates for specific drugs is important to consider. For example, compared with the overall cohort we observed differential switchback rates for alendronate, simvastatin, and amlodipine. This suggests that perhaps universal statements of equivalence between generics marketed under an ANDA as opposed to an NDA (brand proxy) are inadequate. In other words, this may be an indicator that every drug must be considered independently rather than generalizing across heterogeneous products. Replication of our study across larger samples and including additional drugs is one way to further investigate this issue.
The drugs in which we observed a higher (or lower) than average generic-to-brand switchback rate are particularly interesting. Part of the explanation for this may be related to shorter periods of AG availability, although our analyses were censored at the last observed claim date for each drug. We believe that some of the differences may be explained by other factors for which we could not control. For simvastatin, for instance, the higher switchback rate may be an artifact of insurance and market-level dynamics during the time that generic simvastatin was introduced (June, 2006). At this time there were multiple different brand and generic statin products competing, and for some insurance plans the preferred pricing and rebates for the branded product or competing statins may have influenced how the drug was placed in the formulary (e.g., tier 1 vs. tier 2 copayment).22 A non-preferential formulary placement of simvastatin was evident in our sample, as illustrated by a slower than expected brand-generic switching rate following generic entry. This could also have influenced switchback rates. Cost-related factors also could be important, including how products were placed in formulary tiers and the relative difference in cost-sharing across tiers.23 But, we were unable to control for these cost-sharing aspects of individual plan benefit designs, particularly because our retrospective analyses included hundreds of different group plans with annual changes in benefit design. Alternative explanations such as these might explain differences in switchback rates we observed with simvastatin, as well as with alendronate and amlodipine. Further research is needed to explore these areas.
Our results should be interpreted cautiously. The total number of switchbacks for several drugs was small, especially for gabapentin (0 AG and 7 generic switchbacks), glimepiride (2 AG and 6 generic switchbacks), and metformin ER (6 AG and 1 generic switchback). Further, we observed high rates of generic-generic switching and more than 40% of patients initially on an AG had switched to a generic by 12 months. Our analysis accounted for this by assigning patients to the last generic product (AG vs. generic) prior to switching back to brand and we censored analyses if either product was no longer on the market. But, these market-level nuances still could have influenced our results. For instance, while not statistically significant, this is partially evident in that our point estimate for generic type trended towards suggesting that switchbacks were less common with the generic than the AG (HR=0.86; 95% CI 0.65-1.15). Indeed, this comparison reached statistical significance for simvastatin (47.5% switched back from an AG, 4.2% switched back from a generic). One factor that may potentially play a role in these results is drug availability and pharmacy stocking. For example, in a national survey of 170 U.S. institutional pharmacies in 2000, the majority of respondents perceived that wholesaler and manufacturer drug back-orders were increasing in frequency.24 Further studies are needed to determine how product availability, internal pharmacy stocking policies, and patient product cost may play a role in generic-to-brand switchback patterns.
Of note, our approach might inform future research. Namely, we believe selection and perception biases were reduced through the inclusion of both AG and generic groups, and the combined health plan and clinical data were appropriate for studying patients over a long period of time since this population has been shown to have low patient turnover.25 Future studies might expand on our work through a focus on narrow therapeutic index (NTI) drugs since there may be different perceptions of efficacy and tolerability between generic and brand NTI drugs. Another future area for study may be to examine switching patterns for authorized vs. ANDA-approved generics approved via product-specific testing procedures, using an approach similar to a 2016 study by Gagne et al.26
In conclusion, this study compares generic-to-brand switchback rates between AGs and generics for the first time. Results show a similar likelihood of switchback between AGs and generics, indirectly suggesting equivalent efficacy and tolerability between generic and branded drugs. As suggested by the volatile usage patterns seen in the AG group, future studies assessing product switching may explore the role of product availability on utilization patterns. The effects that individual drugs have on switchback likelihood must also be further explored.
Acknowledgments
Lindsey Hohmann, PharmD and Natalie Hohmann, PharmD of the Auburn University Department of Health Outcomes Research and Policy for assistance with manuscript preparation; and Wenlei Jiang, PhD of the U.S. Food and Drug Administration for contributions to study design.
Funding was made possible by the U.S. Food and Drug Administration through grant U01FD005272. Views expressed in written materials or publications and by speakers do not necessarily reflect the official policies of the Department of Health and Human Services; nor does any mention of trade names, commercial practices, or organization imply endorsement by the United States Government.
Footnotes
Disclosures: In the past 3 years, Richard Hansen has provided expert testimony for Boehringer Ingelheim. No other authors declare a potential conflict of interest.
References
- 1.Generic Pharmaceutical Association. Generic drug savings in the U.S. - Fifth Annual Edition. 2013 http://www.gphaonline.org/media/cms/2013_Savings_Study_12.19.2013_FINAL.pdf.
- 2.Crawford P, Feely M, Guberman A, Kramer G. Are there potential problems with generic substitution of antiepileptic drugs? A review of issues. Seizure : the journal of the British Epilepsy Association. 2006;15(3):165–176. doi: 10.1016/j.seizure.2005.12.010. [DOI] [PubMed] [Google Scholar]
- 3.Del Tacca M, Pasqualetti G, Di Paolo A, et al. Lack of pharmacokinetic bioequivalence between generic and branded amoxicillin formulations. A post-marketing clinical study on healthy volunteers. British journal of clinical pharmacology. 2009;68(1):34–42. doi: 10.1111/j.1365-2125.2009.03399.x. [DOI] [PMC free article] [PubMed] [Google Scholar]
- 4.Berg MJ, Gross RA, Haskins LS, Zingaro WM, Tomaszewski KJ. Generic substitution in the treatment of epilepsy: patient and physician perceptions. Epilepsy & behavior : E&B. 2008;13(4):693–699. doi: 10.1016/j.yebeh.2008.06.001. [DOI] [PubMed] [Google Scholar]
- 5.Sewell K, Andreae S, Luke E, Safford MM. Perceptions of and barriers to use of generic medications in a rural African American population, Alabama, 2011. Preventing chronic disease. 2012;9:E142. doi: 10.5888/pcd9.120010. [DOI] [PMC free article] [PubMed] [Google Scholar]
- 6.Keenum AJ, Devoe JE, Chisolm DJ, Wallace LS. Generic medications for you, but brand-name medications for me. Research in social & administrative pharmacy : RSAP. 2012;8(6):574–578. doi: 10.1016/j.sapharm.2011.12.004. [DOI] [PubMed] [Google Scholar]
- 7.Shrank WH, Cox ER, Fischer MA, Mehta J, Choudhry NK. Patients’ perceptions of generic medications. Health Aff (Millwood) 2009;28(2):546–556. doi: 10.1377/hlthaff.28.2.546. [DOI] [PMC free article] [PubMed] [Google Scholar]
- 8.Brennan TA, Lee TH. Allergic to generics. Annals of internal medicine. 2004;141(2):126–130. doi: 10.7326/0003-4819-141-2-200407200-00011. [DOI] [PubMed] [Google Scholar]
- 9.O’Malley AJ, Frank RG, Kaddis A, Rothenberg BM, McNeil BJ. Impact of alternative interventions on changes in generic dispensing rates. Health services research. 2006;41(5):1876–1894. doi: 10.1111/j.1475-6773.2006.00579.x. [DOI] [PMC free article] [PubMed] [Google Scholar]
- 10.Kesselheim AS, Gagne JJ, Franklin JM, et al. Variations in Patients’ Perceptions and Use of Generic Drugs: Results of a National Survey. Journal of general internal medicine. 2016;31(6):609–614. doi: 10.1007/s11606-016-3612-7. [DOI] [PMC free article] [PubMed] [Google Scholar]
- 11.Kesselheim AS, Gagne JJ, Eddings W, et al. Prevalence and Predictors of Generic Drug Skepticism Among Physicians: Results of a National Survey. JAMA Intern Med. 2016;176(6):845–847. doi: 10.1001/jamainternmed.2016.1688. [DOI] [PubMed] [Google Scholar]
- 12.U.S. Food and Drug Administration. Abbreviated new drug application (ANDA): generics. 2014 http://www.fda.gov/Drugs/DevelopmentApprovalProcess/HowDrugsareDevelopedandApproved/ApprovalApplications/AbbreviatedNewDrugApplicationANDAGenerics/default.htm. Accessed May 22, 2014.
- 13.Vari MS, Pinto F, Mencaroni E, et al. Safety of Overnight Switch from Brand-Name to Generic Levetiracetam. Clin Drug Investig. 2016;36(1):87–91. doi: 10.1007/s40261-015-0351-1. [DOI] [PubMed] [Google Scholar]
- 14.Hartung DM, Middleton L, Svoboda L, McGregor JC. Generic substitution of lamotrigine among medicaid patients with diverse indications: a cohort-crossover study. CNS Drugs. 2012;26(8):707–716. doi: 10.2165/11634260-000000000-00000. [DOI] [PMC free article] [PubMed] [Google Scholar]
- 15.Erickson SC, Le L, Ramsey SD, et al. Clinical and pharmacy utilization outcomes with brand to generic antiepileptic switches in patients with epilepsy. Epilepsia. 2011;52(7):1365–1371. doi: 10.1111/j.1528-1167.2011.03130.x. [DOI] [PubMed] [Google Scholar]
- 16.Kim YI, Kim JH, Lee TY, Lee KW. Efficacy and Safety of Glaucoma Patients’ Switch from a 2% Dorzolamide/0.5% Timolol Fixed-Combination Brand-Name Drug to Its Generic Counterpart. J Ocul Pharmacol Ther. 2015;31(6):335–339. doi: 10.1089/jop.2014.0170. [DOI] [PubMed] [Google Scholar]
- 17.U.S. Food and Drug Administration. List of authorized generic drugs. 2014 http://www.fda.gov/drugs/developmentapprovalprocess/howdrugsaredevelopedandapproved/approvalapplications/abbreviatednewdrugapplicationandagenerics/ucm126389.htm. Accessed May 22, 2014.
- 18.World Health Organization. Defined daily dose definition and general considerations. http://www.whocc.no/ddd/definition_and_general_considera/. Accessed January 13, 2016.
- 19.Quan H, Li B, Couris CM, et al. Updating and validating the Charlson comorbidity index and score for risk adjustment in hospital discharge abstracts using data from 6 countries. American journal of epidemiology. 2011;173(6):676–682. doi: 10.1093/aje/kwq433. [DOI] [PubMed] [Google Scholar]
- 20.Chressanthis JA, Khedkar P, Jain N, Poddar P, Seiders MG. Generic-to-branded drug switch-back patterns: exploratory analysis and insights from the statin class. Journal of Pharmaceutical Health Services Research. 2011;2:217–226. [Google Scholar]
- 21.Bronnenberg BJ, Dube JP, Gentzkow M, Shapiro JM. Do pharmacists buy Bayer? Informed shoppers and the brand premium. The Quarterly Journal of Economics. 2015;130(4):1669–1726. [Google Scholar]
- 22.Cox ER, Kulkarni A, Henderson R. Impact of patient and plan design factors on switching to preferred statin therapy. Ann Pharmacother. 2007;41(12):1946–1953. doi: 10.1345/aph.1K253. [DOI] [PubMed] [Google Scholar]
- 23.Hartung DM, Carlson MJ, Kraemer DF, Haxby DG, Ketchum KL, Greenlick MR. Impact of a Medicaid copayment policy on prescription drug and health services utilization in a fee-for-service Medicaid population. Medical care. 2008;46(6):565–572. doi: 10.1097/MLR.0b013e3181734a77. [DOI] [PubMed] [Google Scholar]
- 24.Wellman GS. National supply-chain survey of drug manufacturer back orders. Am J Health Syst Pharm. 2001;58(13):1224–1228. doi: 10.1093/ajhp/58.13.1224. [DOI] [PubMed] [Google Scholar]
- 25.Destefano F, Eaker ED, Broste SK, et al. Epidemiologic research in an integrated regional medical care system: The Marshfield Epidemiologic Study Area. Journal of Clinical Epidemiology. 49(6):643–652. doi: 10.1016/0895-4356(96)00008-x. [DOI] [PubMed] [Google Scholar]
- 26.Gagne JJ, Polinski JM, Jiang W, et al. Switch-backs associated with generic drugs approved using product-specific determinations of therapeutic equivalence. Pharmacoepidemiol Drug Saf. 2016 doi: 10.1002/pds.4009. [DOI] [PubMed] [Google Scholar]