

Abstract
Aims/Introduction
Frequent emergency department (ED) visitors are medically vulnerable individuals. We identified the characteristics of “frequent ED users” among Korean patients with type 2 diabetes mellitus.
Materials and methods
We used the Health Insurance Review and Assessment Service National Patient Sample, which is a nationally representative sample. Patients (n = 109,412) with type 2 diabetes mellitus as a primary or secondary diagnosis at one of their visits were included. Individuals were classified into three groups according to the number of ED visits: frequent (≥4 visits), occasional (<4 visits) and non‐users of the ED. The characteristics of the patients that distinguished frequent users from the other groups were investigated.
Results
Frequent ED users were mainly men (P < 0.001), with longer treatment duration (P < 0.001), more frequent comorbidities (cardiovascular and chronic kidney disease) and primary diagnosis made by surgery (P = 0.0028). They had higher mortality (P = 0.0085), longer hospitalization duration (P < 0.001), higher costs per visit (P < 0.001) and more often required medical protection (P < 0.001). These patients were treated more frequently with sulfonylurea, insulin, meglitinide and alpha‐glucosidase inhibitors (P < 0.05).
Conclusions
The present findings suggest that frequent users of the ED with type 2 diabetes mellitus have serious health conditions, a poor socioeconomic situation and tend to take some medicines (sulfonylurea, etc.), which often are associated with hypoglycemia. Attention should be given to therapy, and to patients with renal and cardiovascular diseases to decrease the dependency of these patients on the ED.
Keywords: Costs, Diabetes, Hypoglycemia
Introduction
Type 2 diabetes mellitus is an increasing problem worldwide. A total of 366 million people suffered from diabetes mellitus in 20111. Whiting et al.2 and the International Diabetes Federation3 estimated that 552 million people could have diabetes mellitus by 2030, and that the number of people affected by type 2 diabetes mellitus could increase to 439 million. However, this increase would depend on the geographic area, as the incidence of type 2 diabetes mellitus is affected by environmental and lifestyle risk factors4. Chan et al.5 suggested that type 2 diabetes mellitus is increasing mainly in developing countries, such as Asia, rather than in developed countries.
Type 2 diabetes mellitus is associated with several complications if not controlled properly, which can potentially lead to other serious diseases. Furthermore, an American Association study6 showed that complications as a result of type 2 diabetes mellitus increase healthcare costs. Vojta et al.7 reported that the mean annual total costs for diabetes complications are approximately $20,700 per patient, which is almost threefold the mean cost for patients without complications as result of diabetes mellitus (i.e. $7,800).
The rate of emergency department (ED) visits by patients with diabetes mellitus in the USA is more than twice that of the general population. Similar results have also been reported in the UK8, 9. ED visits are associated with increased medical costs10. Therefore, frequent ED visitors could be spending a significant proportion of the total healthcare system expenses. However, no study in the Korean population has clarified the common features of frequent ED users with type 2 diabetes mellitus patients.
In the present study, we analyzed frequent ED (FED) users among patients with type 2 diabetes mellitus in the Korean healthcare system. We identified the relevant characteristics of FED users in the Korean healthcare system by comparing the features of these patients with the characteristics of occasional ED (OED) and non‐ED (no ED) users among patients with type 2 diabetes mellitus using a nationally representative dataset.
Methods
Data
National Health Insurance was introduced to South Korea in 1977, and has provided medical insurance to all Koreans since its introduction. It is a compulsory health insurance program that covers >97% of the Korean population.
The Health Insurance Review and Assessment Service (HIRA) is a government organization that reviews National Health Insurance claims for reimbursement. The HIRA database contains claims from a mean of 46 million patients annually, which accounts for 90% of the total Korean population.
Given the enormous number of claims, HIRA has developed national patient samples to simplify accessibility to the data, which are extracted using a stratified randomized sampling method. The data are organized into five sets, including sociodemographic data, diagnostic information, outpatient descriptions, data on healthcare services provided and information on healthcare service providers11.
The data for this analysis were claims extracted from 1 January 2009 to 31 December 2009.
It has been possible to obtain information on patients with type 2 diabetes mellitus in 2009 using the HIRA database, such as demographics (sex and age), mortality, medical costs, care information (days of recovery and treatment) and diseases discovered during visits.
Study participants
We considered two variables that defined the primary and secondary diagnostic codes of the Korean Standard Classification of Disease Version 5 to analyze patients with type 2 diabetes mellitus. In the present study, we did not consider patients with type 1 diabetes mellitus who visited the ED. Because few ED patients had type 1 diabetes mellitus (5% of the total sample), our analysis was not affected by this choice, as we checked explicitly.
We compared FED users, OED users and patients with type 2 diabetes mellitus who did not use the ED during 2009 to identify discriminating characteristics. The FED and OED users were patients with type 2 diabetes mellitus as a main or secondary diagnosis on arrival at the ED. Patients who had type 2 diabetes mellitus during 2009, but declared a different disease as a primary or secondary diagnosis on arrival at the ED, were not considered ED users, because they had not yet been diagnosed with type 2 diabetes mellitus. For example, if a patient made three visits and only one of them was in the ED (the first one) and declared diabetes mellitus in the visits that were not in the ED, the patient was not included in the analysis, as when they went to the ED, they did not have diabetes yet.
Thus, we considered all visits to the ED by patients who already had type 2 diabetes mellitus. The no ED users were patients with type 2 diabetes mellitus as a primary or secondary diagnosis, but who had never visited the ED declaring type 2 diabetes mellitus as a primary or secondary diagnosis during 2009.
We classified patients with type 2 diabetes mellitus as FED users if they visited the ED at least four times, which is the most commonly used threshold12. Patients with fewer than four visits were classified as OED users. Those with type 2 diabetes mellitus who did not visit the ED declaring a diagnosis of type 2 diabetes mellitus were defined as no ED users.
Study design
We carried out a retrospective cross‐sectional study using claims data for the comparisons of FED vs OED users and FED vs no ED users.
We evaluated the following patient factors using the HIRA database: age, sex, comorbidities, death, operation for primary disease, use of other departments, treatment duration, hospitalization duration, health expenses, health self‐expenses, medical protection and usual drugs taken (sulfonylurea, metformin, insulin, dipeptidyl peptidase‐4 inhibitors, meglitinide, thiazolidinedione [TZD], and α‐glucosidase inhibitors [AGI]).
Comorbidities were defined by secondary diagnostic codes. If patients did not have a secondary code at all visits, they were considered not to have comorbidities. Therefore, a patient was classified with comorbidity if in at least one visit during 2009 they declared to have another disease different from the health condition that led the patient to make a visit.
Surgery for primary disease was assigned to patients who underwent surgery after at least one of their visits. An individual who did not have surgery after all visits was considered not to have had an operation for primary disease.
Treatment and hospitalization durations were defined by the mean periods of outpatient care and recovery in the hospital including all visits by each patient. We obtained information on the duration of care (in days) for each visit, and computed the mean number of days of care for all visits for each patient. The same approach was used for hospitalization duration. Regarding care, we also investigated the presence of particular drugs that often are taken by people with type 2 diabetes mellitus; each of these drugs was assigned only to patients who declared taking the drug on at least one visit. We considered these drugs, as hypoglycemia is a common side‐effect for some of them, such as insulin and sulfonylurea.
We defined health expenses as the mean cost per visit, and self‐expense (out‐of‐pocket) as the mean total cost not covered by health insurance.
Patients with high self‐expenses also had high health costs per visit (e.g., patients with a serious health condition), and for this reason insurance was unable to cover the entire amount. It was also possible for a patient not to have a high cost per visit, but with insurance covering only a small part of the total cost (e.g., patient in a bad financial situation).
We also considered medical protection to understand the socioeconomic level of the patient. Indeed, these patients had incomes lower than the poverty level (such as patients who were homeless, had venereal diseases).
Finally, we considered “other departments” to determine if the patients visited departments other than the ED during 2009 to understand the severity of the health and economic statuses of the patient. This variable was considered only in the comparison between frequent and occasional ED users, as patients in the no‐ED group always visited other departments.
Statistical analysis
The χ2‐test was used to estimate the associations between FED users with type 2 diabetes mellitus and categorical variables. One‐way analysis of variance was used to compare the means of the continuous variables among the three groups (no ED, OED and FED users). We applied two multiple logistic models (FED vs OED users and FED vs no ED users) to estimate the statistical association among these variables. Binary variables were used to define the two groups (1: FED users, 0: OED users or no ED users). Discrete variables, such as sex, comorbidities, death, operation for primary disease, other departments, medical protection and drugs taken (sulfonylurea, insulin, etc.) were included in the multiple logistic models along with the binary variables. The remaining variables were treated as continuous predictors in the models. We calculated a frequency table to define the percentages of visits by patients with several diseases for each of the two groups to evaluate the relationship between the number of ED visits and the presence of diseases other than type 2 diabetes mellitus. SAS version 9.3 (SAS Institute, Cary, NC, USA) was used to carry out the analysis.
Results
Overview of study progress
The total number of patients in the HIRA national patient samples was 1,116,040, 11% of whom had diabetes mellitus (n = 117,348). Patients with type 2 diabetes mellitus (code: E11.X, E12.X, E13.X, E14.X) accounted for 93% (n = 109,412) of all individuals with diabetes mellitus. Among all patients with type 2 diabetes mellitus, 92% were “no ED users” (n = 101,185), and 8% were ED users (n = 8,227; Figure 1).
Figure 1.
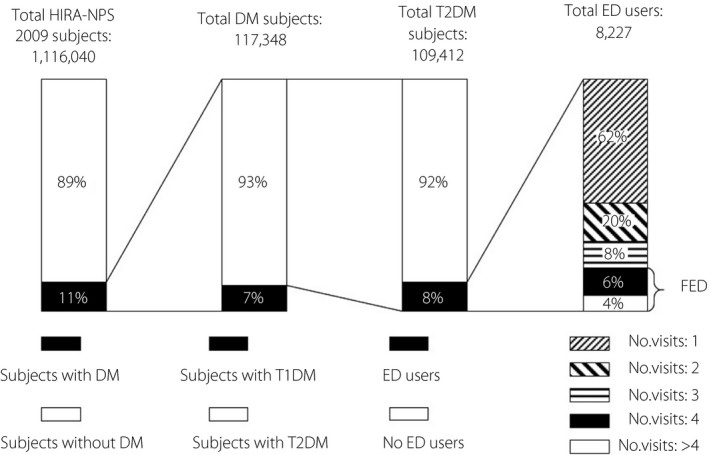
Overall data description. The total number of visits to the emergency department (ED) is the sum of the number of visits of frequent ED (FED) users and occasional ED users, but only considering the visits where the patients were declared to have type 2 diabetes mellitus as a primary or secondary disease. DM, diabetes mellitus; HIRA‐NPS, Health Insurance Review and Assessment Service national patient samples; No ED, non‐emergency department users; T1DM, type 1 diabetes mellitus.
These 8,227 ED users made 10,863 visits to the ED declaring type 2 diabetes mellitus during 2009. FED users accounted for 10% (n = 849 patients) of all ED users, and 24% (2,641 visits) of all visits in ED declaring to have type 2 diabetes mellitus (10,863).
Of the patients with type 2 diabetes mellitus, 59% (n = 64,758) had at information on the drugs they usually take. Of this group, 88% were defined as “no ED users” (n = 56,862), and 12% as “ED users” (n = 7,896).
Characteristics of FED users with type 2 diabetes mellitus by univariate analysis
The FED users with type 2 diabetes mellitus were mainly men (P < 0.0086), who did not often visit departments other than the ED with medical protection (P < 0.001) when we compared FED users with OED users. When we compared FED users with no ED users, we found that FED users had higher frequencies of comorbidities, mortality, surgery for primary diagnosis and more frequent use of prescription type 2 diabetes mellitus drugs; on at least one of the visits, 16% of the no ED users claimed to take sulfonylurea vs 33% in the group of frequent ED users. Insulin use was also more frequent in the group of frequent ED users (58% vs 28%; Table 1).
Table 1.
Characteristics of the frequent emergency department, occasional emergency department and non‐emergency department users among people with type 2 diabetes mellitus (univariate analysis)
| Variable | No ED | OED | FED | P‐value |
|---|---|---|---|---|
| One‐way anova (for continuous variables) | ||||
| Subjects | 101,185 | 7,378 | 849 | |
| Age, years (95% Cl) | 62.1 (61.9–62.2) | 62.9 (62.6–63.2) | 63.1 (62.2–64.1) | <0.001 |
| Treatment duration, days (95% Cl) | 4.8 (4.8–4.9) | 19.1 (18.9–19.4) | 19 (18.3–19.7) | <0.001 |
| Duration of hospitalization, days (95% Cl) | 2.4 (2.3–2.4) | 11.1 (11.0 – 11.3) | 13.9 (13.5–14.3) | <0.001 |
| Health expenses, $ (95% Cl) | 168 (163–174) | 1,765 (1,745–1,784) | 1,879 (1,822– 1,936) | <0.001 |
| Health self‐expenses, $ (95% Cl) | 35 (34–36) | 318 (314–321) | 263 (253–272) | <0.001 |
| Variable | No ED | OED | FED |
P‐value FED vs no ED |
P‐value OED vs no ED |
P‐value ED vs no ED |
|---|---|---|---|---|---|---|
| χ2‐test (for dichotomous variables) | ||||||
| Male, n (%) | 49,524 (49) | 3,943 (53) | 494 (58) | <0.001 | <0.001 | <0.001 |
| Comorbidity, n (%) | 85,264 (84) | 7,145 (97) | 832 (98) | <0.001 | <0.001 | <0.001 |
| Medical protection, n (%) | 24,788 (24) | 1,418 (19) | 362 (43) | <0.001 | <0.001 | <0.001 |
| Death, n (%) | 379 (0.37) | 163 (2.0) | 23 (3.0) | <0.001 | <0.001 | <0.001 |
| Operation for primary diagnosis, n (%) | 8,510 (8) | 1,870 (25) | 226 (27) | <0.001 | <0.001 | <0.001 |
| Other departments, n (%) | – | 6,044 (82) | – | – | – | – |
| Drugsa | ||||||
| Sulfonylurea, n (%) | 8,975 (16) | 1,890 (27) | 266 (33) | <0.001 | <0.001 | <0.001 |
| Metformin, n (%) | 8,661 (15) | 1,859 (26) | 242 (30) | <0.001 | <0.001 | <0.001 |
| Meglitinide, n (%) | 914 (1.6) | 290 (4) | 45 (5.6) | <0.001 | <0.001 | <0.001 |
| Insulin, n (%) | 15,862 (28) | 3,678 (52) | 465 (58) | <0.001 | <0.001 | <0.001 |
| Thiazolidinedione,n (%) | 1,057 (1.9) | 153 (2.2) | 34 (4.2) | <0.001 | 0.081 | 0.002 |
| DPP4‐inhibitor, n (%) | 464 (0.8) | 107 (1.5) | 7 (0.8) | 0.8694 | <0.001 | <0.001 |
| Alpha‐glucosidase inhibitor, n (%) | 3,736 (6.6) | 819 (11.6) | 150 (18.6) | <0.001 | <0.001 | <0.001 |
This part of the analysis included just 64,758 patients (frequent emergency department users [FED] = 806, occasional emergency department users [OED] = 7,090, non‐emergency department users [No ED] = 56,862) with information on the drugs taken. 95% CI, 95% confidence interval; DPP4, dipeptidyl peptidase‐4.
The three groups had significantly different characteristics (P < 0.001; Table 1). FED users with type 2 diabetes mellitus were older, had longer hospitalization durations and had higher healthcare expenses compared with the other groups.
Presence of comorbidities in the ED users with type 2 diabetes mellitus
Table 2 shows the 10 most common primary diagnoses, excluding type 2 diabetes mellitus. Approximately 2.2% of all ED visits (n = 10,863) by patients with type 2 diabetes mellitus were for cerebral infarction, and 2% of these visits (n = 225) were for end‐stage renal disease. Among these visits, 63 were by FED users and 162 by OED users. Among all visits by FED users who declared type 2 diabetes mellitus (n = 2,641), 2.8% (the highest percentage in the table for the FED users group) were for chronic renal failure. The highest proportions of ED visits by FED users were for end‐stage renal disease, hypertension and cerebral infarction.
Table 2.
Top 10 primary diagnoses among frequent and occasional emergency department users with type 2 diabetes
| Disease (KCD5 code) | Total visit frequency (%) | Frequency of visits by FED (%) | Frequency of visits by OED (%) |
|---|---|---|---|
| Cerebral infarction (I63.9) | 244 (2.2) | 51 (2) | 193 (2.3) |
| End‐stage renal disease (N18.6) | 225 (2) | 63 (2.3) | 162 (2) |
| Chronic renal failure (N18.9) | 224 (2) | 74 (2.8) | 150 (1.8) |
| Acute tubulo‐interstitial nephritis (N10) | 193 (1.7) | 18 (0.7) | 175 (2.1) |
| Hypertension (I10) | 185 (1.7) | 60 (2.3) | 125 (1.5) |
| Pneumonia (J18.9) | 161 (1.5) | 28 (1) | 133 (1.6) |
| Hypoglycemia (E16.2) | 142 (1.3) | 12 (0.5) | 130 (1.6) |
| Myocardial infarction (acute) (I21.9) | 113 (1) | 9 (0.3) | 104 (1.3) |
| Angina pectoris (I20.0) | 106 (1) | 12 (0.5) | 94 (1.1) |
| Other cerebral infarction (I63.8) | 89 (0.8) | 25 (0.9) | 64 (0.8) |
FED, frequent emergency department users; OED, occasional emergency department users.
Therefore, some patients went to the ED for problems directly related to type 2 diabetes mellitus (e.g., side‐effects of antidiabetes treatment), and another group comprised people with type 2 diabetes mellitus who went to the ED mainly for other health problems caused by renal and cardiovascular diseases (hypertension, cerebral infarction, chronic renal failure and end‐stage renal disease; Table 2).
Furthermore, we found that FED users with type 2 diabetes mellitus who had cerebral infarction as a primary diagnosis were more likely to have had surgery for a primary disease compared with OED users with the same primary diagnosis (adjusted odds ratio [OR], 4.375; P = 0.043).
Medical costs
Total costs for ED visits by patients confirmed to have type 2 diabetes mellitus as a primary or secondary disease when they arrived in the ED were approximately $18,298,590. FED users with type 2 diabetes mellitus accounted for 22% ($4,043,240) of total expenses.
Medical expenses were approximately $1,879 for FED users, $1,765 for OED users and $168 for no ED users (P < 0.05; Table 1). A significant difference in out‐of‐pocket expenses was also detected by patients among the three groups (P < 0.001; Table 1).
Furthermore, the patient subgroup with renal disease or circulatory system problems other than type 2 diabetes mellitus spent 10% ($1,914,314) of total medical expenses.
Medical protection
Individuals whose income is below the poverty level receive medical benefits from the Korean government. FED users with type 2 diabetes mellitus and medical protection were mainly men (adjusted OR, 0.667; P = 0.0007), and had not visited departments other than the ED (adjusted OR, 0.466; P < 0.001) compared with OED users with the same diagnosis.
Drugs
The group of frequent ED users had a higher frequency of people who took some of the analyzed drugs (Table 1). Frequent ED users took sulfonylurea, TZD, AGI and insulin more often than did occasional ED users (adjusted OR >1; P < 0.05; Table 3). Comparing frequent ED users with no ED users, meglitinide was also taken significantly more often by people who went to the ED repeatedly (adjusted OR >1; P < 0.05; Table 3). However, when we compared frequent ED with no ED users, we did not find a difference in TZD intake.
Table 3.
Characteristics of frequent emergency department users with type 2 diabetes mellitus (multivariate analysis)
| Variables | Estimated OR (type 2 diabetes mellitus FED vs OED users) | 95% CI for OR | P‐value | Estimated OR (type 2 diabetes mellitus FED vs no ED users) | 95% CI for OR | P‐value |
|---|---|---|---|---|---|---|
| Age† | 1.004 | 0.999–1.010 | 0.1037 | 1.003 | 0.997–1.008 | 0.3527 |
| Sex (ref. male)† | 0.779 | 0.668–0.909 | 0.0015 | 0.696 | 0.600–0.808 | <0.001 |
| Treatment duration† | 0.946 | 0.934–0.958 | <0.001 | 1.013 | 1.007–1.019 | <0.001 |
| Comorbidity (ref. no)† | 2.308 | 1.379–3.861 | 0.0015 | 2.097 | 1.290–3.410 | 0.0028 |
| Death (ref. no)† | 0.711 | 0.447–1.133 | 0.1514 | 1.949 | 1.186–3.202 | 0.0085 |
| Operation for primary diagnosis (ref. no)† | 1.099 | 0.907–1.333 | 0.3359 | 1.505 | 1.228–1.844 | <0.001 |
| Hospitalization duration† | 1.070 | 1.056–1.085 | <0.001 | 1.050 | 1.041–1.058 | <0.001 |
| Health expenses†, ‡ | >1 | 1.000–1.000 | 0.1308 | >1 | 1.000–1.000 | <0.001 |
| Health self‐ expenses†, ‡ | >1 | 1.000–1.000 | 0.2484 | >1 | 1.000–1.000 | 0.0049 |
| Other departments (ref. no)† | 0.737 | 0.617–0.880 | 0.0007 | – | – | – |
| Medical protection (ref. no) † | 2.923 | 2.464–3.467 | <0.001 | 2.778 | 2.385–3.236 | <0.001 |
| Sulfonylurea†, § (ref. no) | 1.310 | 1.088–1.577 | 0.004 | 1.473 | 1.216–1.783 | <0.001 |
| Metformin†, § (ref. no) | 1.104 | 0.916–1.330 | 0.301 | 1.202 | 0.990–1.459 | 0.063 |
| Insulin†, § (ref. no) | 1.324 | 1.128–1.554 | <0.001 | 2.722 | 2.323–3.189 | <0.001 |
| DPP4 inhibitor†, § (ref. no) | 0.703 | 0.318–1.557 | 0.385 | 0.669 | 0.311–1.440 | 0.304 |
| Meglitinide†, § (ref. no) | 1.308 | 0.930–1.841 | 0.123 | 1.496 | 1.062–2.107 | 0.021 |
| Thiazolidinedione†, § (ref. no) | 1.890 | 1.264–2.824 | 0.002 | 1.357 | 0.940–1.958 | 0.103 |
| Alpha‐glucosidase inhibitor†, § (ref. no) | 1.524 | 1.232–1.886 | <0.001 | 1.431 | 1.153–1.776 | 0.001 |
†The effect of each variable was corrected for all other variables in the model. ‡For the health expenses and health self‐expenses, the odds ratios (OR) were >1 and very close to it, but the small discrepancy from 1 was significant. §The part of the analysis examining the taken drugs used only part of the initial sample (64,758 patients), as not all patients had information on treatment. 95% CI, 95% confidence interval. FED, frequent emergency department users; no ED, non‐emergency department users; OED, occasional emergency department users.
Sulfonylurea, insulin, metformin, meglitinide, TZD and AGI were associated with a longer treatment duration (adjusted OR >1; P < 0.05); only metformin was associated with a longer hospitalization duration (adjusted OR 1.005; P = 0.003). Insulin was associated with a higher frequency of mortality (adjusted OR 2.987; P < 0.001).
Furthermore, we found that patients who took sulfonylurea or insulin tended to have only type 2 diabetes mellitus when they went to ED; indeed, they had a lower frequency of comorbidity (adjusted OR <1; P < 0.05). Instead, people who took TZD or AGI had pathologies other than type 2 diabetes mellitus when they arrived in the ED (adjusted OR >1; P < 0.05).
Multivariate analysis
Frequent ED users were associated with male sex (adjusted OR, 0.696; P < 0.001), longer period of care (adjusted OR 1.013; P < 0.001), more frequent comorbidities (adjusted OR 2.097; P = 0.0028), higher mortality (adjusted OR 1.949; P = 0.0085), more frequent surgery for the primary diagnosis (adjusted OR 1.505; P < 0.0001), longer period of recovery in the hospital (adjusted OR 1.050; P < 0.001) compared with no ED users. Also, this group was characterized by more expensive visits shown by a significant measure of association very close to 1, but bigger than it (adjusted OR >1; P < 0.001), and higher out‐of‐pocket medical expenses (adjusted OR >1; P = 0.0049) than no ED users. Finally, frequent ED users had more frequently a medical protection (adjusted OR 2.778; P < 0.001) compared with no ED users. Finally, they took some drugs more frequently than did the other group: sulfonylurea, insulin, meglitinide and AGI (adjusted OR >1; P < 0.05; Table 3).
Discussion
Frequent ED users with type 2 diabetes mellitus accounted for 10% of all ED patients with type 2 diabetes mellitus and 24% of all ED visits. This group accounted for 22% of all medical expenses.
Frequent ED users with type 2 diabetes mellitus were more likely to be male, and to have a longer duration of treatment, more frequent comorbidities, more frequent surgeries for the primary diagnosis, higher mortality, visited departments other than the ED less often, a longer duration of hospitalization and more expensive visits with higher out‐of‐pocket expenses per visit. Furthermore, regarding treatment, they more frequently took drugs for type 2 diabetes mellitus: sulfonylurea, insulin, meglitinide and AGI. These patients were also more likely to have medical protection and, therefore, lower socioeconomic status.
Patients with medical protection, such as the homeless (individuals included in the present analysis), tend to require a high level of care, and they are treated at the ED, as pointed out by Padget et al.13 and Hwang14. It is estimated that homeless people are admitted to the hospital up to five times more often than the general population, and tend to stay for a longer period (Martell et al.15, Salit et al.16). The long recovery period leads to increased medical care costs, as discussed by Salit et al.16 Hwang and Bugeja17 estimated that 72% of homeless people with medical protection and diabetes in Toronto have problems managing their health condition, which could explain why patients with medical protection who visited the ED also tended to have serious health conditions.
The reported prevalence of macrovascular disease and peripheral vascular disease were significantly higher in Korean patients with type 2 diabetes mellitus than normal populations18. We found that FED users with type 2 diabetes mellitus often had serious cardiovascular (hypertension and cerebral infarction) and renal (end‐stage renal disease and chronic renal failure) comorbidities, as patients with type 2 diabetes mellitus who visited the ED often had longer hospitalization and care duration, confirming our projections. The FED group had more visits for chronic renal failure, which is reasonable because chronic diseases are more common in this group19.
FED users more frequently took drugs used to treat type 2 diabetes mellitus that are also associated with hypoglycemia: sulfonylurea, insulin and meglitinide.
Furthermore, we found that patients who took sulfonylurea or insulin tended to have only type 2 diabetes mellitus when they went to the ED, showing the possibility that these patients went to the ED for reasons associated with type 2 diabetes mellitus, such as side‐effects of the therapy.
Some studies20, 21 showed that patients with type 2 diabetes mellitus treated with sulfonylurea, if not monitored carefully, have an increased risk of hypoglycemia and mortality. Hypoglycemia is also associated with longer hospital stays, more hospital visits and increased medical expenses22.
People who often visited the ED also more often took an AGI than no ED users, and TZD compared with occasional ED users.
These drugs are known to have a good efficacy in people with type 2 diabetes mellitus and cardiovascular (AGI) and renal (TDZ) problems: TZD has been found to be effective in type 2 diabetes mellitus for avoiding an increase in hypoglycemic episodes in patients with chronic kidney diseases23, and AGI is efficacious for treating type 2 diabetes mellitus without cardiovascular side‐effects24. The present results were in accordance with the literature, as we found that patients who took TZD or AGI had pathologies other than type 2 diabetes mellitus when they arrived in the ED.
Furthermore, AGI are also associated with poor adherence25 because of side‐effects, such as diarrhea and flatulence. Therefore, a lack of adherence to therapy could worsen the health of patients and increase visits to the ED.
The present results, based on data from 2009, seem in accord with the literature, showing the importance of the therapy with more attention to some drugs, such as insulin, sulfonylurea, meglitinide and AGI. Also, it is important to monitor patients with cardiovascular and renal diseases, which seem to increase ED access.
The present study provides the first analysis of the aspects of healthcare in Korean patients despite the presence of some limitations. Indeed, we extracted patients with diabetes using just two diagnosis codes (primary and secondary) provided by HIRA datasets. Unfortunately, having just two variables for the diagnosis, it was possible to exclude some patients with diabetes who went to the ED for a different problem (such as renal stone) and who declared another more serious disease than diabetes during ED visits. Therefore, this limitation led to reducing the sample size by avoiding patients with more than two comorbidities characterized by diabetes as the less important disease. Indeed, patients included in the present analysis were people who had some visits during 2009 year due to problems correlated directly with diabetes or patients with diabetes as the main disease that visited the ED for other illness.
Also, analyzing data for only 1 year did not allow us to consider the time of diabetes onset, which would be useful information to add in the analysis, as it is expected that patients with a diagnosis of diabetes for a longer time could have a worst health situation, and therefore, they would have more visits to the ED. Therefore, this limitation led to analyzing less informative data, and it would be interesting to carry out a population‐based long‐term follow‐up study in order to confirm the present results.
Disclosure
The authors declare no conflict of interest.
Acknowledgments
This study was carried out using HIRA‐NPS‐2009‐0063, a representative subsample of Korea's National Health Insurance Claims Database of the Health Insurance Review and Assessment Service (HIRA) of Korea. This research project did not involve HIRA or the Korean Ministry of Health and Welfare. This work was supported by a grant from Kyung Hee University in 2015 (KHU‐20151823).
J Diabetes Investig 2018;9: 430–437
References
- 1. Olokoba AB, Obateru OA, Olokoba LB. Type 2 diabetes mellitus: review of current trends. Oman Med J 2012; 27: 269–273. [DOI] [PMC free article] [PubMed] [Google Scholar]
- 2. Whiting DR, Guariguata L, Weil C, et al. IDF Diabetes Atlas: Global estimates of the prevalence of diabetes for 2011 and 2030. Diabetes Res. Clin. Pract. 2011; 94: 311–321.22079683 [Google Scholar]
- 3. International Diabetes Federation . The Diabetes Atlas, 4th edn Brussels: International Diabetes Federation, 2009. [Google Scholar]
- 4. Chen L, Magliano DJ, Zimmet PZ. The worldwide epidemiology of type 2 diabetes mellitus‐present and future perspectives. Nat Rev Endocrinol 2012; 8: 228–236. [DOI] [PubMed] [Google Scholar]
- 5. Chan JCN, Malik V, Jia W, et al. Diabetes in Asia: epidemiology, risk factors, and pathophysiology. JAMA 2009; 301: 2129–2140. [DOI] [PubMed] [Google Scholar]
- 6. American Diabetes Association . Economic costs of diabetes in the US in 2012. Diabetes Care 2013; 36: 1033–1046. [DOI] [PMC free article] [PubMed] [Google Scholar]
- 7. Vojta D, De Sa J, Prospect T, et al. Effective interventions for stemming the growing crisis of diabetes and prediabetes: a national payer's perspective. Health Aff 2012; 31: 20–26. [DOI] [PubMed] [Google Scholar]
- 8. Bazargan M, Johnson KH, Stein JA. Emergency department utilization among Hispanic and African‐American under‐served patients with type 2 diabetes. Ethn Dis 2003; 13: 369–375. [PubMed] [Google Scholar]
- 9. Laditka SB, Mastanduno MP, Laditka JN. Health care use of individuals with diabetes in an employer‐based insurance population. JAMA Intern Med 2001; 161: 1301–1308. [DOI] [PubMed] [Google Scholar]
- 10. Galarraga JE, Pines JM. Costs of emergency department episodes of care in the United States [article online] 2015. Available from http://www.ajemjournal.com/article/S0735-6757(15)00465-9/abstract. Accessed 20 September 2015.
- 11. Kim L, Kim J, Kim S. A guide for the utilization of health insurance review and assessment service national patient sample. Epidemiol Health 2014; 36: e2014008. [DOI] [PMC free article] [PubMed] [Google Scholar]
- 12. LaCalle E, Rabin E. Frequent users of emergency departments: the myths, the data, and the policy Implications. Ann Emerg Med 2010; 56: 42–48. [DOI] [PubMed] [Google Scholar]
- 13. Padgett DK, Struening EL, Andrews H, et al. Predictors of emergency room use by homeless adults in New York City: the influence of predisposing, enabling and need factors. Soc Sci Med 1995; 41: 547–56. [DOI] [PubMed] [Google Scholar]
- 14. Hwang SW. Homelessness and health. CMAJ 2001; 164: 229–233. [PMC free article] [PubMed] [Google Scholar]
- 15. Martell JV, Seitz RS, Harada JK, et al. Hospitalization in an urban homeless population: the Honolulu Urban Homeless. Ann. Intern. Med. 1992; 116: 299–303. [DOI] [PubMed] [Google Scholar]
- 16. Salit SA, Kuhn EM, Hartz AJ, et al. Hospitalization costs associated with homelessness in New York City. N Engl J Med 1998; 338: 1734–1740. [DOI] [PubMed] [Google Scholar]
- 17. Hwang SW, Bugeja AL. Barriers to appropriate diabetes management among homeless people in Toronto. CMAJ 2000; 163: 161–165. [PMC free article] [PubMed] [Google Scholar]
- 18. Rhee SY, Chon S, Kwon MK, et al. Prevalence of chronic complications in Korean patients with type 2 diabetes mellitus based on the Korean National Diabetes Program. Diabetes Metab J. 2011; 35: 504–512. [DOI] [PMC free article] [PubMed] [Google Scholar]
- 19. Mandelberg JH, Kuhn RE, Kohn MA. Epidemiologic analysis of an urban, public emergency department's frequent users. Acad Emerg Med 2000; 7: 637–646. [DOI] [PubMed] [Google Scholar]
- 20. Schloot NC, Haupt A, Schutt M, et al. Risk of severe hypoglycemia in sulfonylurea‐treated patients from diabetes centers in Germany/Austria: How big is the problem? Which patients are at risk? Diabetes Metab Res Rev 2016; 32: 316–324. [DOI] [PubMed] [Google Scholar]
- 21. Bodmer M, Meier C, Krahenbuhl S, et al. Metformin, sulfonylurea, or other antidiabetes drugs and the risk of lactic acidosis or hypoglycemia. Diabetes Care 2008; 31: 2086–2091. [DOI] [PMC free article] [PubMed] [Google Scholar]
- 22. Rhee SY, Hong SM, Chon S, et al. Hypoglycemia and Medical expenses in patients with type 2 diabetes mellitus: an analysis based on the Korea National Diabetes Program cohort. PloS One 2016; 11: e0148630. [DOI] [PMC free article] [PubMed] [Google Scholar]
- 23. Sarafidis PA, Bakris GL. Protection of the kidney by thiazolidinediones: an assessment from bench to bedside. Kidney International 2006; 70: 1223–1233. [DOI] [PubMed] [Google Scholar]
- 24. Standl E, Schnell O. Alpha‐glucosidase inhibitors 2012‐cardiovascular considerations and trial evaluation. Diabetes and Vascular Disease Research 2012; 9: 163–169. [DOI] [PubMed] [Google Scholar]
- 25. Holman RR, Cull CA, Turner RC. A randomized double‐blind trial of acarbose in type 2 diabetes shows improved glycemic control over 3 years (U.K. Prospective Diabetes Study 44). Diabetes Care 1999; 22: 960. [DOI] [PubMed] [Google Scholar]