

Abstract
Diabetes has become a major global health problem. The elucidation of characteristic metabolic alterations during the diabetic progression is critical for better understanding its pathogenesis, and identifying potential biomarkers and drug targets. Metabolomics is a promising tool to reveal the metabolic changes and the underlying mechanism involved in the pathogenesis of diabetic complications. The present review provides an update on the application of metabolomics in diabetic complications, including diabetic coronary artery disease, diabetic nephropathy, diabetic retinopathy and diabetic neuropathy, and this review provides notes on the prevention and prediction of diabetic complications.
Keywords: Biomarker, Diabetic complications, Metabolomics
Introduction
Diabetes mellitus is a complex metabolic disorder that is associated with insulin resistance, impaired insulin signaling, β‐cell dysfunction, abnormal glucose levels, altered lipid metabolism, subclinical inflammation and increased oxidative stress1. Diabetes mellitus has become a major global health problem with almost 415 million people affected in 2015, and a projected figure of 642 million by 2040 (International Diabetes Federation, 2015)2.
During the development of diabetes, several mechanisms are involved, including increased blood glucose, islet β‐cell dysfunction, insulin resistance and vascular diseases (Figure 1a). Acute diabetic complications occur in the early stage of diabetes, and include hypoglycemia, diabetic ketoacidosis, hyperosmolar hyperglycemic syndrome and diabetic lactic acidosis (Figure 1b). Chronic diabetic complications that occur in the later developmental stage of diabetes include cerebral vascular disease, diabetic coronary artery disease (CAD), diabetic peripheral neuropathy, diabetic retinopathy (DR), diabetic nephropathy (DN), lower extremity vascular disease and diabetic foot disease (Figure 1b). Type 2 diabetes mellitus leads to long‐term pathogenic diseases, including micro‐ and macrovascular complications, such as peripheral neuropathy, retinopathy, nephropathy, decreased quality of life and increased mortality3, 4, 5. There is no cure once the disease is diagnosed, but early treatment at the subclinical stage can prevent or at least halt disease progression. Thus, it is of critical importance to discover early biomarkers associated with inhibited disease progression.
Figure 1.
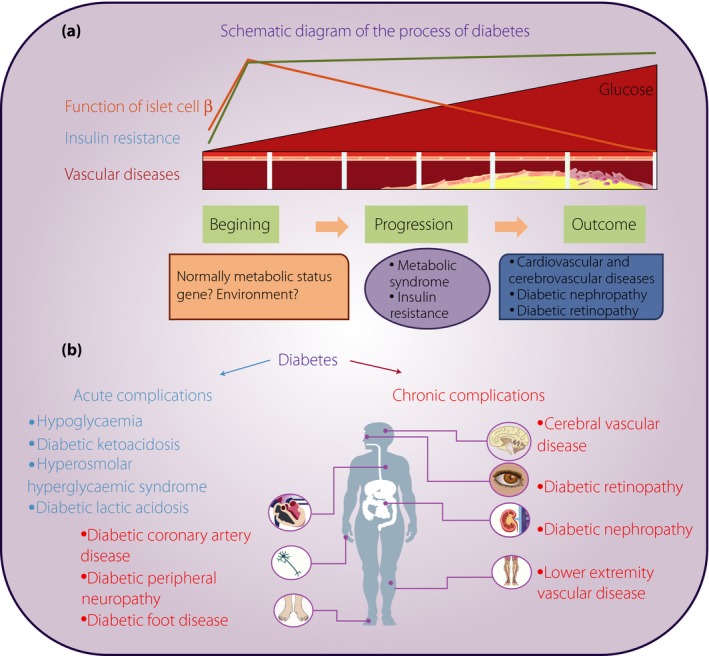
Schematic diagram of the developmental process of diabetes. (a) Different stages of diabetes including the beginning, progression and outcome. Several mechanisms are involved including increased blood glucose, islet β‐cell dysfunction, insulin resistance and vascular diseases. (b) Different diabetic complications, including acute and chronic complications. Acute diabetic complications include hypoglycemia, diabetic ketoacidosis, hyperosmolar hyperglycemic syndrome and diabetic lactic acidosis. Chronic diabetic complications include cerebral vascular disease, diabetic coronary artery disease, diabetic peripheral neuropathy, diabetic retinopathy, diabetic nephropathy, lower extremity vascular disease and diabetic foot disease.
Metabolomics is a systems biology approach that provides global metabolic information about biological samples6. It has been widely used in the diagnosis and treatment of diabetes7, 8. A recent meta‐analysis from eight prospective studies including 8,000 individuals, of whom 1,940 had type 2 diabetes mellitus, reported risk estimates for metabolites and type 2 diabetes mellitus, and showed a 36% greater risk of type 2 diabetes mellitus per study‐specific standard difference for isoleucine, 36% for leucine, 35% for valine, 36% for tyrosine and 26% for phenylalanine, whereas glycine and glutamine were inversely associated with type 2 diabetes mellitus risk8. Many studies have shown elevated plasma levels of branched‐chain amino acids and their derivatives, aromatic amino acids, and α‐hydroxybutyrate before the manifestation of type 2 diabetes mellitus9. However, studies of diabetic complications are scarce. The purpose of the present review was to provide an update on the application of metabolomics in diabetic complications, and to provide some guidance about the prevention and prediction of the development of diabetic complications.
Methods
Literature searches of PubMed/MEDLINE for relevant articles were carried out from 1999 to January 2017 with the key term combinations of ‘metabolomics’ or ‘metabonomics’ with ‘diabetic complication’ or ‘coronary artery disease’ or ‘coronary heart disease’ or ‘diabetic nephropathy’ or ‘diabetic kidney disease’ or ‘diabetic retinopathy’ or ‘diabetic peripheral neuropathy.’ Additional articles were identified by searching the reference lists from the included studies. Articles that applied metabolomics in diabetic complications, including clinical studies and animal studies, were included.
Application of Metabolomics in Diabetic Complications
Diabetic CAD
The mortality and morbidity for CAD in type 2 diabetes mellitus patients is two‐ to fourfold greater than in non‐diabetic individuals10, making cardiovascular disease the leading cause of death and disability among this population. The major types of cardiovascular disease seen in diabetes are accelerated atherosclerosis, myocardial infarction, stroke and cardiac dysfunction11. Nevertheless, traditional risk factors could not fully explain the level of cardiovascular risk in these patients, and CAD is often undetected in diabetes patients. Recent attention has focused on identifying cardiovascular biomarkers that would provide a better non‐invasive method to detect subclinical cardiovascular disease and prevent cardiovascular events12. These are summarized in Table 1.
Table 1.
The main characteristics of metabolomics studies on diabetic coronary artery disease
| Reference | Group | Type | Platform | Altered metabolites | Conclusion |
|---|---|---|---|---|---|
| Kirschenlohr et al. (2006) | 244 male patients, 44 of coronary arteries (NCAs), 56 with 1‐VD, 69 with 2‐VD and 75 with 3‐VD | Serum | 1H NMR | Detection of CAD by 1H NMR with >99% confidence was very weak compared with angiography | |
| Zhang et al. (2014) | 21 patients in glipizide group and 23 patients in metformin group | Serum | LC‐QTOFMS | The differential therapeutic effects of metformin and glipizide on comprehensive lipidomics were comparable with their different long‐term effects on cardiovascular outcomes | |
| Badeau et al. (2014) | 26 placebo and 25 rosiglitazone treatment groups | Serum | NMR | Glutamine↑; lactate↓ | Serum lactate and glutamine concentrations changed after short‐term rosiglitazone treatment in T2DM patients with CHD, reflecting improvements in insulin sensitivity. Circulating lactate concentrations were inversely correlated with increases in myocardial glucose uptake |
| Wu et al. (2015) | 292 T2DM with HBP, T2DM with NAFLD, T2DM with HBP and NAFLD, T2DM with HBP and CHD, and T2DM with HBP, NAFLD, and CHD | Serum | UPLC‐QTOFMS | 4‐hydroxy‐3‐methoxymandelic acid ↑ in T2DM with HBP, NAFLD, and CHD compared with T2DM with HBP and NAFLD | The broad‐spectrum metabolic changes emphasize the complex abnormalities present among these complications with elevated blood glucose levels |
CAD, coronary artery disease; CHD, coronary heart disease; 1H NMR, proton nuclear magnetic resonance; HBP, high blood pressure; LC‐QTOFMS, liquid chromatography‐quadrupole time of flight mass spectrometry; NAFLD, non‐alcoholic fatty liver disease; NCAs, normal coronary arteries; T2DM, type 2 diabetes mellitus; TCA, tricarboxylic acid; UPLC‐QTOFMS, ultra‐performance liquid chromatography‐quadrupole time of flight mass spectrometry; VD, vascular disease.
It was reported that multivariate analysis of the proton nuclear magnetic resonance (1H NMR) spectra of sera was previously used to predict angiographically‐defined advanced CAD with >90% accuracy and specificity13. Nevertheless, Kirschenlohr et al.13 concluded that the detection of CAD by 1H NMR with >99% confidence was very weak compared with angiography using similar methodology for angiographically defined diabetes mellitus with CAD using plasma samples from groups of 244 male patients including 44 with normal coronary arteries, 56 with one vascular disease, 69 with two vascular diseases and 75 with three vascular diseases patients, classified by statin treatment. Statin treatment caused substantial decreases in cholesterol, low‐density lipoprotein and triglycerides, and affected the contribution of these lipid components to the main lipid chain (CH2, methylene) and terminal CH3, methyl peaks in the 1H NMR spectra. They found that predictions for the normal coronary arteries and CAD groups were just 80.3% correct for patients not treated with statins, and just 61.3% correct for treated patients, compared with random correct predictions of 50%. A confidence limit of >99% was achieved for 36.2% of predictions for the untreated groups, and 6.2% for the treated groups.
Badeau et al.14 analyzed patients with both type 2 diabetes mellitus and coronary heart disease (CHD) that were separated into placebo (n = 26) and treatment (rosiglitazone 4–8 mg; n = 25) groups for 16 weeks. They carried out serum NMR metabolomics to measure circulating low molecular weight metabolites. Compared with the placebo, the treatment significantly increased circulating glutamine and decreased lactate concentrations, both of which reflected improvements in insulin sensitivity. After rosiglitazone treatment, circulating lactate concentrations showed a significant inverse association with myocardial glucose uptake. They concluded that in type 2 diabetes mellitus patients with CHD, short‐term rosiglitazone treatment caused minor improvements in metabolism; serum lactate and glutamine concentrations changed, reflecting improvements in insulin sensitivity, whereas circulating lactate concentrations inversely correlated with increased myocardial glucose uptake.
Our previous study reported a metabolomics study based on ultra‐performance liquid chromatography (UPLC)‐quadrupole time of flight (TOF) mass spectrometry (MS) that was designed to identify the distinct metabolic changes associated with several complications of type 2 diabetes mellitus. The 292 patients recruited in the study were divided into five groups, including type 2 diabetes mellitus with high blood pressure (HBP), type 2 diabetes mellitus with non‐alcoholic fatty liver disease (NAFLD), type 2 diabetes mellitus with HBP and NAFLD, type 2 diabetes mellitus with HBP and CHD, and type 2 diabetes mellitus with HBP, NAFLD and CHD. Serum differential metabolites were identified in type 2 diabetes mellitus complications, including bile acids, fatty acids, amino acids, lipids, carbohydrates, steroid metabolism and tricarboxylic acid cycle15. In brief, the serum level of selenocysteine in type 2 diabetes mellitus with HBP and CHD was higher than type 2 diabetes mellitus with NAFLD, but these patients had significantly lower stearoyl carnitine and leucine compared with type 2 diabetes mellitus with HBP and NAFLD. Type 2 diabetes mellitus with HBP, NAFLD and CHD had higher serum levels of elaidic acid than type 2 diabetes mellitus with HBP, higher xanthine and lower aldosterone than type 2 diabetes mellitus with NAFLD, higher 4‐hydroxy‐3‐methoxymandelic acid than type 2 diabetes mellitus with HBP and NAFLD, and higher proline, uridine, cis‐2‐methyl aconitic acid and cytidine than type 2 diabetes mellitus with HBP and CHD.
Diabetic Nephropathy
As the number of patients with diabetes increases, DN, also known as diabetic kidney disease, has become a growing public health problem. Elucidation of the characteristic metabolic alterations during the diabetic progression is critical to better understand its pathogenesis, and to identify potential biomarkers and drug targets. Nevertheless, there are only a handful of studies on human DN, most of which were based on serum or urine samples. Most studies of DN are in animal models. Both human and animal DN studies are shown in Table 2.
Table 2.
Main characteristics of the metabolomics studies on diabetic nephropathy
| Reference | Group | Type | Platform | Altered metabolites | Conclusion |
|---|---|---|---|---|---|
| Makinen et al. (2006) | 182 T1DM and 21 non‐T1DM | Serum | 1H NMR | 1H NMR metabolomics appears nearly as good for diagnosing DN from serum as an advanced set of biochemical variables | |
| Makinen et al. (2008) | 251 normoalbuminuric, 137 microalbuminuria, 225 macroalbuminuria | Serum | 1H NMR | The biochemical information obtained by serum 1H NMR metabolomics allowed the complete distinction of T1DM patients and non‐T1DM individuals | |
| Van et al. (2012) | 26 T1DM with microalbuminuria and 26 non‐progressive AER subjects | Urine | GC–MS, LC–MS | Acyl‐carnitines, acyl‐glycines and metabolites related to ryptophan metabolism | Based on LC‐MS measurements of urine. A statistically significant multivariate model could be constructed to distinguish between progressive and non‐progressive subjects within the normal AER group with an accuracy of 75% |
| Zhang et al. (2009) | 25 healthy controls, 8 DN, 33 T2DM patients | Serum | UPLC‐oaTOFMS | Leucine, dihydrosphingosine and phytosphingosine | Significant changes in the serum level of leucine, dihydrosphingosine and phytosphingosine were noted, indicating that perturbations in amino acid metabolism and phospholipid metabolism in diabetic diseases have implications in clinical diagnosis and treatment |
| Zhu et al. (2011) | 30 control, 30 T2DM, 52 DN subjects | Plasma | NPLC‐TOF/MS, ion trap‐MS/MS | 3 DM‐specific biomarkers, 8 DN‐specific biomarkers and 7 common biomarkers to DM and DN | 2 novel biomarkers, PI C18:0/22:6 and SM dC18:0/20:2, can be used to discriminate healthy individuals, T2DM cases and DN cases from each other |
| Han et al. (2011) | 30 control, 30 DM, and 90 DN (30DNIII, 30DNIV, 30DNV) | Plasma | GC‐MS | NEFAs and EFAs | The relationship between FA levels and DM, as well as DN pathology was speculated on, and different stages were distinguished according to metabolic features |
| Sharma et al. (2013) | 94 healthy controls, DM with CKD, DM without CKD | Urine | GC‐MS | 13 metabolites in mitochondrial metabolism↓ | Urine metabolomics is a reliable source for biomarkers of diabetic complications, and renal organic ion transport and mitochondrial function are dysregulated in DN |
| Huang et al. (2013) | 50 healthy controls, 33 T2DM and 99 DN (DNIII, n = 33) | Plasma | UPLC‐MS/MS, HPLC‐DAD‐MS/MS, HPLC‐MS/MS, Normal phase HPLC‐MS, GC‐MS | Inosine ↑ | Inosine with a cut‐off of 0.086 mg L (–1) was combined with estimated GFR to differentiate DN stages 1 and 2 from diabetes |
| Niewczas et al. (2014) | 40 with ESRD and 40 without ESRD | Plasma | GC‐MS | Certain amino acid‐derived acylcarnitines ↑; essential amino acids and their derivatives ↓ | Abnormal plasma concentrations of putative uremic solutes and essential amino acids either contribute to the progression to ESRD or are a manifestation of early stages of the disease process that lead to ESRD in T2DM |
| Pena et al. (2014) | 90 T2DM and 150 HBP | Plasma, urine | LC/MS, LC‐MS/MS, HILIC‐MS/MS | Higher plasma butenoylcarnitine in patients with T2DM with microalbuminuria than controls↑; lower urine hexose, glutamine and tyrosine in patients with T2DM with microalbuminuria than controls↓; lower plasma histidine in patients with T2DM with microalbuminuria than controls↓ | T2DM‐specific plasma and urine metabolites were discovered that predict the development of macroalbuminuria beyond established renal risk markers |
| Zhao et al. (2012) | Control, DN and ZDP‐treated DN male rats | Serum, urine | 1H NMR | Lactate in serum↑; glucose, 3‐hydrobutyrate and lactate in kidney↑; lipids and 3‐hydrobutyrate in serum↓; betaine in kidney ↓ | Some dominating metabolic pathways, such as inhibiting glucose and lipid metabolism, as well as methylamine metabolism are involved in DN. |
| Zhao et al. (2012) | Diabetic rats induced by STZ and treated with or without fosinopril | Renal cortex | GC‐TOF MS, UPLC‐TOF MS | Uremic toxins, glucuronides and glucotoxicity‐associated metabolites ↑ | Intrarenal accumulation of organic toxins may be significant for the development of DKD |
| Liu et al. (2013) | DN monkeys | Serum, urine | 1H NMR |
Serum: lipids and unsaturated lipids↑alanine, glutamate and pyruvate↓(DN vs DM) Urine: citrate, allantoin, fumarate, phenylalanine, hippurate and histidine↑benzoate, formate and NAD+ ↓(DN vs DM) |
NMR‐based metabonomics provides insight into the underlying pathways in the pathogenesis and progression of DN at the metabolic level |
| Wei et al. (2015) | db/db diabetic mice and age‐matched wild‐type mice | Urine, renal | 1H NMR | Cis‐aconitate↑ and allantoin↓ in urine | Age‐dependent and correlated metabolite analysis identified that cis‐aconitate and allantoin could serve as biomarkers for the diagnosis of DN |
| Zhao et al. (2015) | DKD rat model by uninephrectomy and STZ for >20 weeks | Renal cortex | GC‐TOF MS, UPLC‐TOF MS | Uremic toxins and glucuronides and phospholipids↓ | Improved abnormal metabolic and lipidomic disorders, such as the accumulation of uremic toxins, glucuronides and phospholipids, may be mechanisms by which treatment of CHYS inhibits DN |
| Liu et al. (2015) | Control and STZ‐induced DN rats | Serum, urine, renal | 1H NMR | Urine allantoin↑and serum UA↑ | Disturbed purine metabolism and its related XO pathway were involved in the development of DN, while UA and allantoin may be used as potential markers for oxidative stress in DN |
| You et al. (2016) | DKD mice | Urine | MS | TCA cycle‐related urinary metabolites↑ | Fumarate is a key link connecting metabolic pathways to DKD pathogenesis, and measuring urinary fumarate levels may have application for monitoring renal NOX4 activity |
AER, albumin excretion rate; CHYS, Chaihuang‐Yishen formula; DKD, diabetic kidney disease; DM, diabetes mellitus; DN, diabetic nephropathy; ESRD, end‐stage renal disease; GC‐MS, gas chromatography‐mass spectrometry; GC‐TOF MS, gas chromatography–time of flight mass spectrometry; GFR, glomerular filtration rate; HBP, high blood pressure; HILIC‐MS/MS, hydrophilic interaction liquid chromatography mass spectrometry/mass spectrometry; 1H NMR, proton nuclear magnetic resonance; HPLC‐DAD‐MS/MS, ultra‐performance liquid chromatography diode array detection tandem mass spectrometry; ion trap‐MS/MS, ion trap‐tandem mass spectrometry; LC‐MS, liquid chromatography‐mass spectrometry; MS, mass spectrometry; NOX4, nicotinamide adenine dinucleotide phosphate oxidase 4; NPLC‐TOF/MS, normal phase liquid chromatography coupled with time of flight mass spectrometry; STZ, streptozotocin; T1DM, type 1 diabetes mellitus; T2DM, type 2 diabetes mellitus; TCA, tricarboxylic acids; UA, uric acid; UPLC‐OATOFMS, ultra‐performance liquid chromatography‐quadrupole time of flight mass spectrometry; UPLC‐TOF MS, ultra‐performance liquid chromatography time of flight mass spectrometry; XO, xanthine oxidase; ZDP, Zhi Bai Di Huang pill.
Clinical Studies
Mäkinen et al.16 studied 182 type 1 diabetes mellitus and 21 non‐diabetic (non‐type 1 diabetes mellitus) individuals using 1H NMR of serum at 500 MHz. Type 1 diabetes mellitus patients and non‐type 1 diabetes mellitus individuals were exclusively separated. For DN diagnosis in type 1 diabetes mellitus patients, 1H NMR data (and clinical biochemistry data) gave a sensitivity of 87.1% (83.9%) and a specificity of 87.7% (95.9%). The authors concluded that the use of serum 1H NMR metabolomics was a good method to diagnose DN as an advanced set of biochemical variables16. They further measured 1H NMR data from the serum of 613 patients with type 1 diabetes mellitus, 251 of which were normoalbuminuric, 137 had microalbuminuria and 225 had macroalbuminuria17. They showed how a single 1H NMR protocol can identify the polydiagnostic metabolite manifold of type 1 diabetes mellitus, and how its alterations connect with clinical phenotypes, the clustering of micro‐ and macrovascular complications, and mortality after several years of follow up.
Zhang et al.18 distinguished the global serum profiles of eight DN patients, 33 type 2 diabetes mellitus patients and 25 healthy volunteers using UPLC coupled with orthogonal acceleration TOFMS (UPLC quadrupole TOFMS). Distinct clustering between the patients and controls was observed, as well as between DN and type 2 diabetes mellitus patients. Significant changes in the serum level of leucine, dihydrosphingosine and phytosphingosine were detected18.
Zhu et al.19 carried out metabolic profiling based on normal phase liquid chromatography coupled with TOFMS to characterize the human plasma phospholipids (PLs) in type 2 diabetes mellitus and DN in order to identify potential biomarkers of type 2 diabetes mellitus and DN. The plasma samples from control participants (n = 30), type 2 diabetes mellitus patients (n = 30) and DN patients (n = 52) were analyzed. Potential biomarkers were successfully screened out using partial least squares discriminate analysis, and then were further identified through ion trap MS/MS and quantified. As a result, 18 significantly regulated compounds in seven PL classes in patients compared with healthy controls were regarded as potential biomarkers for type 2 diabetes mellitus or DN. Among them, there were three diabetes mellitus‐specific biomarkers, eight DN‐specific biomarkers and seven common biomarkers to diabetes mellitus and DN. Finally, two novel biomarkers, PI C18:0/22:6 and SM dC18:0/20:2, can be used to discriminate between healthy individuals, type 2 diabetes mellitus patients and DN patients19.
Han et al.20 analyzed 150 individuals from five groups: control (n = 30), type 2 diabetes mellitus without nephropathy (diabetes mellitus, n = 30) and type 2 diabetes mellitus with nephropathy (including DN III, n = 30; DN IV, n = 30; and DN V, n = 30, according to the Mogensen classification), and carried out metabolic profiling using gas chromatography MS (GC‐MS) to assess the plasma levels of non‐esterified fatty acids and esterified fatty acids. Finally, the relationship between fatty acid levels and diabetes mellitus, as well as DN pathology, was speculated on, and different stages were distinguished according to their metabolic features20.
Huang et al.21 carried out a metabolomics study in order to discover plasma biomarkers for the early diagnosis of type 2 diabetic nephropathy stage 1 and stage 2, as well as to separate them from diabetes. Their study recruited 182 participants, including 50 healthy controls, 33 type 2 diabetes mellitus patients and 99 type 2 diabetic nephropathy patients (33 of these were stage 3). An integrated biomarker system incorporating six clinical indicators, 40 metabolites and five genes was established. The developed integrated biomarker system gave the highest total predictive accuracy (98.9%), while inosine had the highest sensitivity (0.889), specificity (1.000), positive predictive rate (1.000) and negative predictive rate (0.900) among the 48 potential biomarkers when separating patients with diabetes from patients with DN stage 3. Finally, inosine with a cut‐off of 0.086 mg/L was combined with estimated glomerular filtration rate to differentiate DN stages 1 and 2 from diabetes.
Niewczas et al.22 studied plasma metabolomics profiles as determinants of progression to end‐stage renal disease (ESRD) in type 2 diabetes mellitus patients. This nested case–control study evaluated 40 cases that progressed to ESRD during 8–12 years of follow up, and 40 controls who remained alive without ESRD. They detected 262 by MS‐based global metabolomics profiling in at least 80% of the study patients of the named plasma metabolites in the library. The metabolomics platform recognized 78 metabolites that were previously reported to be elevated in ESRD (uremic solutes). A total of 16 metabolites were already elevated in the baseline plasma before ESRD development. Other uremic solutes were either not different or not commonly detectable. Essential amino acids and their derivatives were significantly depleted, whereas certain amino acid‐derived acylcarnitines were increased. They concluded that abnormal plasma concentrations of putative uremic solutes and essential amino acids either contribute to the progression to ESRD or are a manifestation of an early stage of the disease process that leads to ESRD in type 2 diabetes mellitus.
Van der et al.23 analyzed the urine profiles of 52 type 1 diabetes mellitus patients who were clinically defined as having a normal albumin excretion rate (<30 mg/24 h) using GC‐MS and LC‐MS. The discriminating metabolites mainly included acyl‐carnitines, acyl‐glycines and metabolites related to tryptophan metabolism.
Sharma et al.24 used GC‐MS to quantify 94 urine metabolites to screen and validate cohorts of patients with diabetes mellitus and chronic kidney disease (CKD), patients with diabetes mellitus without CKD, and healthy controls. Compared with healthy controls, 13 metabolites were significantly reduced in the diabetes mellitus with CKD cohorts, and 12 of the 13 remained significant when compared with the diabetes mellitus without CKD cohort. Many of the differentially expressed metabolites were water‐soluble organic anions. Further analysis showed that 12 of the 13 differentially expressed metabolites were correlated with mitochondrial metabolism, and suggested global suppression of mitochondrial activity in diabetes mellitus and CKD. Further human diabetic kidney sections expressed less mitochondrial protein; urine exosomes from patients with diabetes and CKD had less mitochondrial deoxyribonucleic acid, and kidney tissues from patients with diabetic kidney disease had lower gene expression of peroxisome proliferator‐activated receptor gamma coactivator 1‐alpha (a master regulator of mitochondrial biogenesis). The authors concluded that renal organic ion transport and mitochondrial function were dysregulated in DN.
Pena et al.25 attempted to discover plasma and urine metabolites that predict the development of micro‐ or macroalbuminuria, and selected patients with type 2 diabetes mellitus (n = 90) and HBP (n = 150). In patients with type 2 diabetes mellitus with normoalbuminuria, no plasma metabolites discriminated cases from controls. In patients with type 2 diabetes mellitus with microalbuminuria, plasma histidine was lower but enoylcarnitine was higher than controls. Urine hexose, glutamine and tyrosine levels were lower in cases versus controls. Adding the metabolites to a model of baseline albuminuria and estimated glomerular filtration rate, the metabolites improved risk prediction for the macroalbuminuria transition (plasma integrated discrimination index = 0.28, P < 0.001; urine integrated discrimination index = 0.43, P < 0.001). These metabolites did not differ between HBP cases and controls without type 2 diabetes mellitus. They concluded that type 2 diabetes mellitus‐specific plasma and urine metabolites were discovered that could predict the development of macroalbuminuria beyond established renal risk markers. Amino acids are handled by B0AT1, a novel member of the Na+ dependent neurotransmitter transporter family (SLC6, also named slc6a19) that is a cotransporter responsible for luminal influx, the heterodimeric exchanger, the facilitated diffusion transporter TAT1 in charge of basolateral efflux and possibly other transporters26, 27. Kidney protein turnover is characterized by the highest rates of protein synthesis and amino acid oxidation, mainly in the tubulointerstitium. However, until now, it has been unclear how different amino acids derivatives play important roles during the progression of DN. An increasing number of studies are required to show the detailed mechanisms underlying the formation of DN.
Animal Studies
Zhi Bai Di Huang pill (ZDP), an ancient traditional Chinese medicine, has been frequently used for the treatment of kidney deficiency for thousands of years in China. Diabetes always presents with kidney deficiency syndrome. Male rats were divided into three groups: control, DN and ZDP‐treated DN. Based on the 1H NMR spectra of sera, urine and kidney extracts from the rats, it was shown that the cluster of DN rats was separated from control rats, whereas some ZDP‐treated DN rats were close to control rats. Higher levels of lipids and 3‐hydrobutyrate were found, and a lower level of lactate was observed in sera, as well as the upregulation of glucose, 3‐hydrobutyrate and lactate, and the downregulation of betaine in the kidney tissues of DN rats compared with controls. The authors concluded that ZDP ameliorates DN symptoms by regulating several dominant metabolic pathways, such as inhibiting glucose and lipid metabolism, and enhancing methylamine metabolism28.
Zhao et al.29 designed a metabolomics study based on GC‐TOFMS and UPLC‐TOFMS to explore the related mechanisms of DN development and fosinopril treatment. Fosinopril is a pharmacological inhibitor of angiotensin II‐converting enzyme, which has been confirmed to have apparent renoprotective effects on patients with CKD. They collected perfused renal cortex samples from diabetic rats induced by streptozocin (STZ), treated with or without fosinopril, and then identified a number of abnormal metabolites in the diabetic kidney, including groups of amino acids, carbohydrates, polyols, lysophospholipids, glucuronides and other unidentified metabolites. Of these, an increase in intrarenal organic toxins, including uremic toxins, glucuronides and glucotoxicity‐associated metabolites, were highly correlated with diabetic kidney injury, including 24‐h urinary protein levels and tubulointerstitial injury index. Fosinopril significantly attenuated diabetic kidney injury and simultaneously blocked the intrarenal accumulation of these organic toxins, especially hippurate and glucuronides. These results show that intrarenal accumulation of organic toxins could play a significant part in the development of DN.
Liu et al.30 carried out a 1H NMR‐based metabolomics study to analyze serum and urine obtained from DN monkeys. Higher levels of very low‐density lipoprotein/low‐density lipoprotein, lipids, unsaturated lipids, uric acid, allantoin, fumarate and hippurate, as well as lower levels of high‐density lipoprotein, alanine, glutamate, pyruvate, formate, tyrosine, histidine and nicotinamide adenine dinucleotide were detected in DN models. The disturbed metabolic pathways mainly involved nicotinamide adenine dinucleotide metabolism, purine metabolism, oxidative stress, lipid metabolism and renal tubular reabsorption30.
Wei et al.31 carried out 1H NMR‐based metabolomics with correlative analysis to find characteristic metabolites, as well as the related pathways in urine and kidney samples of db/db diabetic mice compared with age‐matched wild‐type mice. Age‐dependent and correlated metabolite analysis identified that urinary cis‐aconitate and allantoin could serve as biomarkers for the diagnosis of DN. Further, they showed that the enzymes dimethylarginine‐dimethyl aminohydrolase, guanosine triphosphate cyclohydrolase I, and 3‐hydroxy‐3‐methylglutaryl‐CoA lyase were involved in dimethylamine metabolism, ketogenesis and guanosine‐5′‐triphosphate metabolism pathways, respectively, and could be potential therapeutic targets for DN31.
Chaihuang‐yishen formula (CHYS) is a Chinese herbal formula that has been clinically shown to effectively treat DN. Zhao et al.32 carried out an integrated metabolomic and lipidomic analysis to examine whether CHYS could attenuate the development of DN by regulating the disordered metabolic pathways in a DN rat model by uninephrectomy and a single intraperitoneal injection of STZ for >20 weeks32. Like fosinopril, the positive control, treatment with CHYS, produced a renoprotective effect against DN. The analyses showed that the therapeutic effect of CHYS on DN was significantly associated with the inhibition of elevated organic toxins, including several uremic toxins and glucuronides, as well as the normalization of diminished PLs, especially sphingomyelins. The authors suggested that the mechanisms of CHYS inhibition of DN occur by improving abnormal metabolic and lipidomic disorders, such as the accumulation of uremic toxins, glucuronides and PLs.
To show the metabolic changes associated with DN, Liu33 analyzed the serum, urine, and renal extracts obtained from control and STZ‐induced DN rats by 1H NMR‐based metabolomics and multivariate data analysis. A significant difference between control and DN rats was shown in their metabolic profiles, and several important DN‐related metabolites, including increased levels of urine allantoin and serum uric acid, in the DN rats were identified, suggesting that disturbed purine metabolism might be involved in DN. They further showed that xanthine oxidase (XO), a key enzyme for purine catabolism, was abnormally activated in the kidney of diabetic rats by hyperglycemia. The highly activated XO increased the level of intracellular reactive oxygen species, which caused renal injury by direct oxidative damage to renal cells and indirectly induced inflammatory responses by activating the nuclear factor‐κB signaling pathway. Disturbed purine metabolism and its related XO pathway were involved in the development of DN; UA and allantoin might be used as potential markers for oxidative stress in DN.
You et al.34 reported that tricarboxylic acid cycle‐related urinary metabolites were increased in DN mice, but fumarate levels were uniquely reduced by the nitric oxide (NOX)1/NOX4 inhibitor. NOX4 is a nicotinamide adenine dinucleotide phosphate oxidase (NOX) isoform that has been linked to DN. They concluded that fumarate was a key link connecting metabolic pathways to DN pathogenesis, and that measuring urinary fumarate levels might have application for monitoring renal NOX4 activity.
The aforementioned studies highlighted that metabolomics is a promising tool to show metabolic changes, screen biomarkers and explore the underlying mechanism involved in the pathogenesis of DN. A recent systematic review summarized that several specific metabolite groups, such as amino acids including branched‐chain amino acids, aromatic amino acids and lipids, such as PLs and non‐esterified fatty acids, were either elevated or reduced in patients with DN compared with controls35. In the present review, we found that in clinical studies, the perturbations in amino acid metabolism, fatty acid metabolism and PL metabolism were shown in serum or plasma, whereas tryptophan metabolism and mitochondrial metabolism were shown in urine from DN patients. In animal studies, abnormal glucose, lipid metabolism and methylamine metabolism, intrarenal accumulation of organic toxins, disturbed purine metabolism, and its related XO pathway, as well as the tricarboxylic acid cycle, were found in DN based on the urine, serum or kidney. However, further studies are required because of the observed inconsistent alterations in some of the biomarkers, and the potential confounding influence of different study populations and methods. Future mechanistic studies are required to show how clinical therapies, such as rosiglitazone on type 2 diabetes mellitus patients with CHD and CHYS on DN, improve symptoms, and how the metabolites changed and took part in the development of DN.
Diabetic Retinopathy
DR is the leading cause of acquired blindness in diabetes mellitus patients, and includes the following stages: a preclinical stage, non‐proliferative DR (NPDR) and proliferative DR (PDR). The preclinical stage refers to patients with diagnosed diabetes mellitus, but no apparent DR. NPDR is characterized by venous dilatation, microaneurysms, retinal hemorrhages, retinal edema and hard exudates. PDR presents as either neovascularization or vitreous/preretinal hemorrhages, or both36, 37. Several studies have carried out metabolomics on the altered metabolites in DR patients, as shown in Table 3.
Table 3.
Main characteristics of metabolomics studies on diabetic retinopathy and diabetic peripheral neuropathy
| Reference | Group | Type | Platform | Altered metabolites | Conclusion |
|---|---|---|---|---|---|
| Munipally et al. (2011) | 35 control subjects, 22 NPDR patients and 24 PDR patients | Serum | HPLC | Greater expression of kynurenine, kynurenic acid and 3‐hydroxykynurenine in NPDR and PDR↑ | Results indicate a probable association of IDO and tryptophan metabolites with DR |
| Barba et al. (2010) | 22 patients with T1DM with PDR and 22 non‐diabetic patients with a macular hole | Vitreous | 1H NMR | Lactate and glucose↑; galactitol and ascorbic acid↓ | Apart from the greater abundance of lactate and glucose, significant deficits of galactitol and ascorbic acid are the main metabolic fingerprints of vitreous fluid from PDR patients |
| Li et al. (2011) | 2 perspectives studies | Serum | GC‐MS | Fatty acids, amino acids and glucose | Results showed the usefulness and validity of combining both Western and Chinese medicine to study the subtypes of DR and the mechanisms involved |
| Freeman et al. (2011) | STZ‐diabetic and healthy control rats | SN, DRG, TG | GC‐MS, UHPLC‐MS | Increase in glucose and polyol pathway intermediates in diabetes; upregulation of mitochondrial oxidative phosphorylation and perturbation of lipid metabolism were found in the distal SN that were not present in the corresponding cell bodies of the DRG or the cranial TG↑ | Spatial metabolic dysfunction suggests a failure of energy homeostasis and/or oxidative stress, specifically in the distal axon/Schwann cell‐rich SN |
DR, diabetic retinopathy; DRG, lumbar 4/5 dorsal root ganglia; GC‐MS, gas chromatography‐mass spectrometry; HPLC, high‐performance liquid chromatography; IDO, indoleamine 2, 3‐dioxygenase; NPDR, non‐proliferative diabetic retinopathy; PDR, proliferative diabetic retinopathy; STZ, streptozotocin; SN, sciatic nerve; T1DM, type 1 diabetes mellitus; TG, the trigeminal ganglia; UHPLC‐MS, ultra‐high‐performance liquid chromatography‐mass spectrometry.
Munipally et al.38 detected the expression of indoleamine 2, 3‐dioxygenase, and the levels of tryptophan metabolites in serum samples of DR patients using high‐performance liquid chromatography and semi‐quantitative reverse transcription polymerase chain reaction. They collected 35 control subjects, 22 NPDR patients and 24 PDR patients. Elevated expression of indoleamine 2, 3‐dioxygenase and the levels of tryptophan metabolites, including kynurenine, kynurenic acid and 3‐hydroxykynurenine, were observed in NPDR and PDR, but no significant change was found for the levels of tryptophan. These results show that indoleamine 2, 3‐dioxygenase and tryptophan metabolites might participate in the pathology of DR38.
To explore the metabolic profile of the vitreous fluid of patients with PDR, Barba et al.39 carried out 1H NMR‐based metabolomic analysis. 1H NMR spectra were acquired from vitreous samples obtained during vitrectomy from 22 patients with type 1 diabetes with PDR, and from 22 non‐diabetes patients with a macular hole as controls. Lactate and glucose were significantly higher in samples from PDR patients than non‐diabetes patients. A partial least squares discriminant analysis model was obtained that was able to correctly classify 19 of 22 patients with PDR and 18 of 22 controls, with a sensitivity of 86% and a specificity of 81%. The main metabolites involved in this specific pattern recognition were galactitol and ascorbic acid; the levels of both were significantly lower in PDR patients. They concluded that apart from the higher abundance of lactate and glucose, significant deficits of galactitol and ascorbic acid were the main metabolic fingerprints of vitreous fluid from PDR patients.
Li et al.40 carried out a plasma metabolomics study of DR using GC‐MS including 25 patients at the preclinical stage, 39 NPDR patients and 25 PDR patients. They discovered 10 metabolites (i.e., pyruvic acids, l‐aspartic acid, b‐hydroxybutyric acid, methymaleic acid, citric acid, glucose, stearic acid, trans‐oleic acid, linoleic acid, arachidonic acid) that could be used to discriminate between the three stages (pre‐clinic, NPDR, PDR). That study emphasized the alternative modes of metabolites and metabolic pathways in DR; for example, the disturbance in fatty acids, amino acids, glucose and so on40.
The aforementioned studies showed that metabolomics can reflect the metabolic patterns, development and differentiation of DR, and especially abnormal fatty acids, amino acids and glucose metabolism involve the mechanism of DR. However, more and more studies are required for better analysis.
Diabetic Peripheral Neuropathy
High glucose levels in the peripheral nervous system have been implicated in the pathogenesis of diabetic peripheral neuropathy. However, an understanding of the molecular mechanisms that cause the marked distal pathology is incomplete.
Freeman et al.41 carried out a comprehensive, system‐wide analysis of the peripheral nervous system through integrated proteomics and metabolomics of the sciatic nerve (SN), the lumbar 4/5 dorsal root ganglia, and the trigeminal ganglia of STZ‐diabetic and healthy control rats41. Even though all tissues showed a dramatic upregulation in glucose and polyol pathway intermediates in diabetes, a striking increase in mitochondrial oxidative phosphorylation and perturbed lipid metabolism were found in the distal SN, which were not present in the corresponding cell bodies of the dorsal root ganglia or the cranial trigeminal ganglia. They suggested that the most severe molecular consequences of diabetes in the nervous system are present in the SN, which is the area most affected by neuropathy. The spatial metabolic dysfunction suggests a failure of energy homeostasis and/or oxidative stress, especially in the distal axon/Schwann cell‐rich SN (Table 3).
Problems
Although an increasing number of studies focus on diabetic complications, their underlying mechanisms have yet to be elucidated. The study of diabetic complications is still underrepresented in metabolomics research, as are prospective studies of human samples. Several points are suggested as below.
First, it is important to pay more attention not only to the control of blood glucose, but also to the control of diabetic complications. The earlier the complications are detected, the better the patient prognosis is. Second, there are relatively few studies on the detection of new biomarkers for diabetic complications, and there are also relatively few studies on the application of metabolomics in this field. Third, many variables, including sex and drug treatment, can affect metabolites and are thus potential confounders. The standardization of metabolomics data is always absent, but should be considered before research. We believe that the investigation of potential biomarkers for type 2 diabetes mellitus and its complications will facilitate the prediction and prevention of diabetes in the near future.
Disclosure
The authors declare no conflict of interest.
Acknowledgments
This work was supported by grants from the National Natural Science Foundation of China (81620108030), the 3‐Year Action Plan of Shanghai Municipal Committee of Health and Family Planning (ZY3‐CCCX‐2‐1002) and the Shanghai Rising‐Star Project (15QA1403500).
J Diabetes Investig 2018;9: 244–255
References
- 1. Testa R, Bonfigli AR, Genovese S, et al The possible role of flavonoids in the prevention of diabetic complications. Nutrients 2016; 8: 1–13. [DOI] [PMC free article] [PubMed] [Google Scholar]
- 2. Hugill AJ, Stewart ME, Yon MA, et al Loss of arylformamidase with reduced thymidine kinase expression leads to impaired glucose tolerance. Biol Open 2015; 4: 1367–1375. [DOI] [PMC free article] [PubMed] [Google Scholar]
- 3. Santaguida PL, Balion C, Hunt D, et al Diagnosis, prognosis, and treatment of impaired glucose tolerance and impaired fasting glucose. Evid Rep Technol Assess (Summ) 2005; 128: 1–11. [PMC free article] [PubMed] [Google Scholar]
- 4. Evans JL, Goldfine ID, Maddux BA, et al Oxidative stress and stress‐activated signaling pathways: a unifying hypothesis of type 2 diabetes. Endocr Rev 2002; 23: 599–622. [DOI] [PubMed] [Google Scholar]
- 5. Spranger J, Kroke A, Mohlig M, et al Inflammatory cytokines and the risk to develop type 2 diabetes: results of the prospective population‐based European Prospective Investigation into Cancer and Nutrition (EPIC)‐Potsdam Study. Diabetes 2003; 52: 812–817. [DOI] [PubMed] [Google Scholar]
- 6. Nicholson JK. Global systems biology, personalized medicine and molecular epidemiology. Mol Syst Biol 2006; 2: 52. [DOI] [PMC free article] [PubMed] [Google Scholar]
- 7. Psihogios NG, Gazi IF, Elisaf MS, et al Gender‐related and age‐related urinalysis of healthy subjects by NMR‐based metabonomics. NMR Biomed 2008; 21: 195–207. [DOI] [PubMed] [Google Scholar]
- 8. Guasch‐Ferre M, Hruby A, Toledo E, et al Metabolomics in prediabetes and diabetes: a systematic review and meta‐analysis. Diabetes Care 2016; 39: 833–846. [DOI] [PMC free article] [PubMed] [Google Scholar]
- 9. Klein MS, Shearer J. Metabolomics and type 2 diabetes: translating basic research into clinical application. J Diabetes Res 2016; 2016: 3898502. [DOI] [PMC free article] [PubMed] [Google Scholar]
- 10. Wei M, Gaskill SP, Haffner SM, et al Effects of diabetes and level of glycemia on all‐cause and cardiovascular mortality. The San Antonio Heart Study. Diabetes Care 1998; 21: 1167–1172. [DOI] [PubMed] [Google Scholar]
- 11. Filla LA, Edwards JL. Metabolomics in diabetic complications. Mol BioSyst 2016; 12: 1090–1105. [DOI] [PMC free article] [PubMed] [Google Scholar]
- 12. Nandish S, Wyatt J, Bailon O, et al Implementing cardiovascular risk reduction in patients with cardiovascular disease and diabetes mellitus. Am J Cardiol 2011; 108: 42B–51B. [DOI] [PubMed] [Google Scholar]
- 13. Kirschenlohr HL, Griffin JL, Clarke SC, et al Proton NMR analysis of plasma is a weak predictor of coronary artery disease. Nat Med 2006; 12: 705–710. [DOI] [PubMed] [Google Scholar]
- 14. Badeau RM, Honka MJ, Lautamaki R, et al Systemic metabolic markers and myocardial glucose uptake in type 2 diabetic and coronary artery disease patients treated for 16 weeks with rosiglitazone, a PPARgamma agonist. Ann Med 2014; 46: 18–23. [DOI] [PubMed] [Google Scholar]
- 15. Wu T, Xie G, Ni Y, et al Serum metabolite signatures of type 2 diabetes mellitus complications. J Proteome Res 2015; 14: 447–456. [DOI] [PubMed] [Google Scholar]
- 16. Mäkinen VP, Soininen P, Forsblom C, et al Diagnosing diabetic nephropathy by 1H NMR metabonomics of serum. MAGMA 2006; 19: 281–296. [DOI] [PubMed] [Google Scholar]
- 17. Mäkinen VP, Soininen P, Forsblom C, et al 1H NMR metabonomics approach to the disease continuum of diabetic complications and premature death. Mol Syst Biol 2008; 4: 167. [DOI] [PMC free article] [PubMed] [Google Scholar]
- 18. Zhang J, Yan L, Chen W, et al Metabonomics research of diabetic nephropathy and type 2 diabetes mellitus based on UPLC‐oaTOF‐MS system. Anal Chim Acta 2009; 650: 16–22. [DOI] [PubMed] [Google Scholar]
- 19. Zhu C, Liang QL, Hu P, et al Phospholipidomic identification of potential plasma biomarkers associated with type 2 diabetes mellitus and diabetic nephropathy. Talanta 2011; 85: 1711–1720. [DOI] [PubMed] [Google Scholar]
- 20. Han LD, Xia JF, Liang QL, et al Plasma esterified and non‐esterified fatty acids metabolic profiling using gas chromatography‐mass spectrometry and its application in the study of diabetic mellitus and diabetic nephropathy. Anal Chim Acta 2011; 689: 85–91. [DOI] [PubMed] [Google Scholar]
- 21. Huang M, Liang Q, Li P, et al Biomarkers for early diagnosis of type 2 diabetic nephropathy: a study based on an integrated biomarker system. Mol BioSyst 2013; 9: 2134–2141. [DOI] [PubMed] [Google Scholar]
- 22. Niewczas MA, Sirich TL, Mathew AV, et al Uremic solutes and risk of end‐stage renal disease in type 2 diabetes: metabolomic study. Kidney Int 2014; 85: 1214–1224. [DOI] [PMC free article] [PubMed] [Google Scholar]
- 23. van der Kloet FM, Tempels FW, Ismail N, et al Discovery of early‐stage biomarkers for diabetic kidney disease using ms‐based metabolomics (FinnDiane study). Metabolomics 2012; 8: 109–119. [DOI] [PMC free article] [PubMed] [Google Scholar]
- 24. Sharma K, Karl B, Mathew AV, et al Metabolomics reveals signature of mitochondrial dysfunction in diabetic kidney disease. J Am Soc Nephrol 2013; 24: 1901–1912. [DOI] [PMC free article] [PubMed] [Google Scholar]
- 25. Pena MJ, Lambers Heerspink HJ, Hellemons ME, et al Urine and plasma metabolites predict the development of diabetic nephropathy in individuals with Type 2 diabetes mellitus. Diabet Med 2014; 31: 1138–1147. [DOI] [PubMed] [Google Scholar]
- 26. Furmanek A, Hofsteenge J. Protein C‐mannosylation: facts and questions. Acta Biochim Pol 2000; 47: 781–789. [PubMed] [Google Scholar]
- 27. Verrey F, Singer D, Ramadan T, et al Kidney amino acid transport. Pflugers Arch 2009; 458: 53–60. [DOI] [PubMed] [Google Scholar]
- 28. Zhao L, Gao H, Zhao Y, et al Metabonomic analysis of the therapeutic effect of Zhibai Dihuang Pill in treatment of streptozotocin‐induced diabetic nephropathy. J Ethnopharmacol 2012; 142: 647–656. [DOI] [PubMed] [Google Scholar]
- 29. Zhao T, Zhang H, Zhang X, et al Intrarenal metabolomics reveals the association of local organic toxins with the progression of diabetic kidney disease. J Pharm Biomed Anal 2012; 60: 32–43. [DOI] [PubMed] [Google Scholar]
- 30. Liu J, Wang D, Chen Y, et al 1H NMR‐based metabonomic analysis of serum and urine in a nonhuman primate model of diabetic nephropathy. Mol BioSyst 2013; 9: 2645–2652. [DOI] [PubMed] [Google Scholar]
- 31. Wei T, Zhao L, Jia J, et al Metabonomic analysis of potential biomarkers and drug targets involved in diabetic nephropathy mice. Sci Rep 2015; 5: 11998. [DOI] [PMC free article] [PubMed] [Google Scholar]
- 32. Zhao T, Zhang H, Zhang X, et al Metabolomic and lipidomic study of the protective effect of Chaihuang‐Yishen formula on rats with diabetic nephropathy. J Ethnopharmacol 2015; 166: 31–41. [DOI] [PubMed] [Google Scholar]
- 33. Liu J, Wang C, Liu F, et al Metabonomics revealed xanthine oxidase‐induced oxidative stress and inflammation in the pathogenesis of diabetic nephropathy. Anal Bioanal Chem 2015; 407: 2569–2579. [DOI] [PubMed] [Google Scholar]
- 34. You YH, Quach T, Saito R, et al Metabolomics reveals a key role for fumarate in mediating the effects of NADPH oxidase 4 in diabetic kidney disease. J Am Soc Nephrol 2016; 27: 466–481. [DOI] [PMC free article] [PubMed] [Google Scholar]
- 35. Zhang Y, Zhang S, Wang G. Metabolomic biomarkers in diabetic kidney diseases – a systematic review. J Diabetes Complications 2015; 29: 1345–1351. [DOI] [PubMed] [Google Scholar]
- 36. Ciulla TA, Amador AG, Zinman B. Diabetic retinopathy and diabetic macular edema: pathophysiology, screening, and novel therapies. Diabetes Care 2003; 26: 2653–2664. [DOI] [PubMed] [Google Scholar]
- 37. Yam JC, Kwok AK. Update on the treatment of diabetic retinopathy. Hong Kong Med J 2007; 13: 46–60. [PubMed] [Google Scholar]
- 38. Munipally PK, Agraharm SG, Valavala VK, et al Evaluation of indoleamine 2,3‐dioxygenase expression and kynurenine pathway metabolites levels in serum samples of diabetic retinopathy patients. Arch Physiol Biochem 2011; 117: 254–258. [DOI] [PubMed] [Google Scholar]
- 39. Barba I, Garcia‐Ramirez M, Hernandez C, et al Metabolic fingerprints of proliferative diabetic retinopathy: an 1H‐NMR‐based metabonomic approach using vitreous humor. Invest Ophthalmol Vis Sci 2010; 51: 4416–4421. [DOI] [PubMed] [Google Scholar]
- 40. Li X, Luo X, Lu X, et al Metabolomics study of diabetic retinopathy using gas chromatography‐mass spectrometry: a comparison of stages and subtypes diagnosed by Western and Chinese medicine. Mol BioSyst 2011; 7: 2228–2237. [DOI] [PubMed] [Google Scholar]
- 41. Freeman OJ, Unwin RD, Dowsey AW, et al Metabolic dysfunction is restricted to the sciatic nerve in experimental diabetic neuropathy. Diabetes 2016; 65: 228–238. [DOI] [PubMed] [Google Scholar]