

Abstract
Aims/Introduction
To investigate whether the ratio of visceral fat area (VFA) to subcutaneous fat area (SFA; V/S ratio) could be predictive of cardiovascular disease (CVD) as compared with VFA or SFA in patients with diabetes.
Materials and Methods
A total of 682 patients with type 2 diabetes (mean age 64 ± 13 years; 41% women) were enrolled. VFA (cm2) and SFA (cm2) were assessed by a dual bioelectrical impedance analyzer. The patients were divided into four groups according to the quartiles of the V/S ratio. The study end‐point was the first occurrence or recurrence of CVD.
Results
Over a median follow up of 2.5 years, 21 patients reached the end‐point. The number of patients who reached the end‐point was increased along with the increasing of the V/S ratio quartiles. The V/S ratio was significantly associated with incident or recurrent CVD (hazard ratio [HR] 1.82, 95% CI: 1.09–3.04, P = 0.021) after adjusting for estimated glomerular filtration rate (HR 0.98, 95% CI: 0.96–1.00), brain‐type natriuretic peptide (HR 1.00, 95% CI: 1.00–1.01), use of antiplatelet agents (HR 4.26, 95% CI: 1.63–11.13), coefficient of variation of R‐R intervals (HR 0.85, 95% CI: 0.69–1.10) and glycated hemoglobin (HR 1.37, 95% CI: 1.05–1.79). The addition of the V/S ratio to age, estimated glomerular filtration rate, brain‐type natriuretic peptide, antiplatelet agents and glycated hemoglobin significantly improved classification performance for CVD using net reclassification improvement (0.60, 95% CI: 0.21–1.00) and the integrated discrimination improvement (0.02, 95% CI: 0.00–0.05).
Conclusions
The V/S ratio measured by dual bioelectrical impedance analyzer is an independent predictor of CVD in patients with type 2 diabetes.
Keywords: Cardiovascular disease, Type 2 diabetes, Visceral‐to‐subcutaneous fat ratio
Introduction
Obesity contributes to the development of insulin resistance1, type 2 diabetes2, dyslipidemia3 and hypertension4, therefore increasing the risk of cardiovascular disease (CVD)5. Notably, visceral fat accumulation is strongly associated with metabolic abnormalities and CVD6, 7. Even in non‐obese individuals, visceral fat accumulation increases the risk of cardiovascular mortality8, and the significant association between visceral fat and the burden of arterial stiffness has been reported in non‐obese patients with type 2 diabetes as well9. Several studies have reported that Asian people including Japanese are susceptible to type 2 diabetes and CVD despite a relatively low body mass index (BMI)10, 11, 12. The reason for Asian people having a predisposition to diabetes and CVD is speculated to be that they have a greater amount of abdominal visceral fat relative to abdominal subcutaneous fat compared with Caucasians13, 14. Consequently, a direct measure of visceral fat is important to investigate the risk of CVD, particularly in Asian patients with diabetes.
In contrast to visceral fat, it is reported that subcutaneous fat might even be beneficial against metabolic abnormalities15, 16. Considering independent effects of both visceral and subcutaneous fat on cardiometabolic risks and CVD, the relative distribution of body fat might be more important than visceral fat area (VFA) or subcutaneous fat area (SFA) per se. Actually, the ratio of VFA to SFA (V/S ratio) has been reported to be more strongly associated with cardiometabolic risks than VFA17, 18, 19, 20. Narumi et al.20 proposed that the V/S ratio is a better predictor of the calcium score of the whole aorta, as a marker of atherosclerosis, than SFA or VFA. In addition, we have recently reported in a cross‐sectional study that high VFA with low SFA is an important determinant of carotid atherosclerosis in patients with type 2 diabetes21. However, direct evidence is not available as to whether a higher V/S ratio contributes to CVD events in patients with diabetes. We therefore carried out a multicenter, retrospective observational study to examine the relationships between the V/S ratio measured by a dual bioelectrical impedance analyzer (BIA) and the incidence or recurrence of CVD in Japanese patients with type 2 diabetes.
Methods
Study design and patients
Patients with type 2 diabetes who regularly visited the Tokyo Medical and Dental University Hospital, Tokyo, Japan; Soka Municipal Hospital, Soka, Saitama, Japan; or Shinjyuku Kaijo Biru Clinic, Shibuya, Tokyo, Japan, participated in the present retrospective observational study. Patients aged ≥20 years, who measured VFA and SFA by a dual BIA, were enrolled. We excluded patients with estimated glomerular filtration rate (eGFR) <15 mL/min/1.73 m2, those who were receiving hemodialysis, those who were pregnant and those with cancer. Diagnosis of type 2 diabetes was made using the diagnostic criteria of the Japan Diabetes Society22. The present study was carried out in accordance with the Declaration of Helsinki. The protocol for this multicenter collaborative research was collectively reviewed by the ethical review committee of Tokyo Medical and Dental University and was approved.
Clinical and biochemical analysis
Standardized questionnaires were used to obtain information on medication and medical history. Smoking history was defined as current smoker or non‐current smoker. These data were collected on the date closest to the day when dual BIA was carried out. VFA and SFA were calculated at the umbilical level using a dual BIA (DUALSCAN; Omron Healthcare Co., Kyoto, Japan). Although the gold standard for the quantitative assessment of adipose tissue distribution is computed tomography (CT), this technique is expensive, has radiation issues and it is difficult to repeat an inspection. VFA and SFA measured by dual BIA was reported to be as accurate as those measured by CT;23, 24 therefore, we used dual BIA to evaluate abdominal fat distribution. The determination of glycated hemoglobin (HbA1c) was based on a latex agglutination inhibition assay. HbA1c levels were expressed in accordance with the National Glycohemoglobin Standardization Programs recommended by the Japan Diabetes Society22. GFR was estimated using the equation for the Japanese;25 GFR = 194 × serum creatinine−1.094 × age−0.287 ([if female] × 0.739). Weight and height were measured, and the BMI was calculated based on the following formula: weight in kg divided by height in meters squared. The coefficient of variation of R‐R intervals was used for the assessment of diabetic neuropathy.
Definition of cardiovascular events
CVD was defined as stroke, unstable angina, myocardial infarction, percutaneous coronary intervention, coronary bypass grafting, angioplasty or major amputation as a result of peripheral arterial disease or cardiovascular death. The study end‐point was the first occurrence or recurrence of CVD, and cases were reviewed based on the medical record.
Statistical analysis
Statistical analysis was carried out using SPSS (version 21.0; IBM Corp, Armonk, New York, USA) and statistical package R (version 3.3.2; available from http://www.r-project.org). The data were expressed as mean ± standard deviation, median with interquartile range and percentages. Participants were divided into four groups according to the quartiles of the V/S ratio as follows: Q1 0.05–0.41, Q2 0.42–0.52, Q3 0.53–0.62 and Q4 0.63–1.12. anova was used to analyze continuous variables, and the χ2‐test or Fisher's exact test were used to analyze categorical variables. The Cox proportional hazards model based on time to the end‐point was used to calculate the hazard ratio (HR) with 95% confidence interval (CI). An increase in the standard deviation of markers for adiposity (V/S ratio, VFA, SFA and BMI) was used to estimate the risk for the end‐point. The following variables were incorporated as covariates in the multivariate Cox regression analysis with a stepwise procedure: age, sex, duration of diabetes, history of CVD, smoking, systolic blood pressure, triglycerides, high‐density lipoprotein cholesterol, low‐density lipoprotein cholesterol, HbA1c, urine albumin excretion, eGFR, brain‐type natriuretic peptide (BNP), and the use of insulin, calcium channel blockers, angiotensin receptor blockers, statins, beta‐blockers, fibrates, eicosapentaenoic acids and antiplatelet agents at baseline. Cumulative incidence of the end‐point of each quartile of the V/S ratio was calculated by the Kaplan–Meier method, and log–rank tests were used for comparison among the four groups. Receiver operating characteristic (ROC) analysis was carried out in order to calculate the areas under the curve (AUC) of the V/S ratio, VFA, SFA and BMI to identify a discriminatory power for the end‐point. We further calculated net reclassification improvement (NRI) and the integrated discrimination improvement (IDI) for examining the ability of the V/S ratio, VFA, SFA and BMI to predict the endpoint26. Age, eGFR, BNP, use of antiplatelet agents and HbA1c were incorporated into the model. P < 0.05 was regarded as statistically significant.
Results
A total of 682 Japanese patients with type 2 diabetes (mean age 64 ± 13 years; 41% female) were enrolled in the present study. Table 1 shows the clinical characteristics of study participants according to the quartiles of the V/S ratio at baseline. The proportion of men and smoking, VFA, and triglycerides were increased, along with the increase of the V/S ratio quartiles. There were no significant differences in age, duration of diabetes, history of CVD, systolic blood pressure, logarithmically transformed urine albumin excretion, prevalence of proliferative diabetic retinopathy, coefficient of variation of R‐R intervals, HbA1c, low‐density lipoprotein cholesterol, alanine transaminase and BNP. Medications are listed in Table 2. Compared with patients with a low V/S ratio, patients with a high V/S ratio were more frequently receiving fibrates and uric acid‐lowering agents.
Table 1.
Clinical characteristics at baseline according to the ratio of visceral fat to subcutaneous fat area
| V/S ratio | P‐value | ||||
|---|---|---|---|---|---|
| Q1 (n = 170) | Q2 (n = 171) | Q3 (n = 171) | Q4 (n = 170) | ||
| Age (years) | 62 ± 15 | 63 ± 13 | 65 ± 11 | 65 ± 11 | 0.145 |
| Sex (%male) | 45 | 53 | 68 | 72 | <0.001 |
| VFA (cm2) | 57 (52–63) | 97 (91–103) | 113 (106–119) | 131 (123–139) | <0.001 |
| VFA of over all patients (cm2) | 99 ± 50 | ||||
| SFA (cm2) | 183 (168–197) | 211 (198–223) | 198 (187–209) | 182 (171–192) | 0.002 |
| SFA of over all patients (cm2) | 193 ± 82 | ||||
| V/S ratio | 0.30 ± 0.10 | 0.46 ± 0.03 | 0.57 ± 0.03 | 0.73 ± 0.10 | <0.001 |
| V/S ratio of over all patients | 0.51 ± 0.17 | ||||
| Body mass index (kg/m2) | 24.2 ± 4.8 | 26.6 ± 4.9 | 26.8 ± 4.7 | 26.7 ± 5.2 | <0.001 |
| Duration of diabetes (years) | 12 ± 11 | 13 ± 10 | 12 ± 10 | 12 ± 10 | 0.637 |
| History of CVD (%) | 9 | 18 | 17 | 16 | 0.069 |
| Smoking (%) | 19 | 20 | 26 | 29 | 0.009 |
| SBP (mmHg) | 128 ± 20 | 131 ± 19 | 128 ± 18 | 132 ± 19 | 0.054 |
| DBP (mmHg) | 74 ± 12 | 76 ± 11 | 75 ± 12 | 77 ± 12 | 0.019 |
| Log UAE (mg/day) | 1.34 ± 0.63 | 1.33 ± 0.61 | 1.40 ± 0.64 | 1.38 ± 0.61 | 0.726 |
| eGFR (mL/min/1.73 m2) | 77.7 ± 27.2 | 72.0 ± 25.8 | 68.8 ± 23.5 | 71.7 ± 25.6 | 0.013 |
| PDR (%) | 9 | 16 | 16 | 9 | 0.081 |
| CV‐RR (%) | 4.6 (3.8–5.4) | 3.7 (3.4–4.1) | 4.1 (3.7–4.5) | 3.9 (3.6–4.3) | 0.126 |
| HbA1c (%) | 8.7 ± 2.0 | 8.9 ± 1.8 | 8.8 ± 1.7 | 9.0 ± 1.8 | 0.510 |
| HbA1c (mmol/mol) | 71.9 ± 22.3 | 74.1 ± 20.2 | 72.4 ± 19.1 | 74.8 ± 20.0 | 0.510 |
| Triglycerides (mmol/L) | 1.44 (1.25–1.63) | 1.60 (1.46–1.73) | 1.68 (1.53–1.82) | 2.00 (1.77–2.22) | <0.001 |
| HDL cholesterol (mmol/L) | 1.40 ± 0.47 | 1.29 ± 0.38 | 1.19 ± 0.31 | 1.22 ± 0.34 | <0.001 |
| LDL cholesterol (mmol/L) | 2.83 ± 0.89 | 3.01 ± 0.95 | 2.91 ± 0.88 | 2.87 ± 0.89 | 0.272 |
| ALT (U/L) | 29 (25–34) | 32 (28–37) | 28 (25–31) | 33 (29–36) | 0.277 |
| BNP (pg/mL) | 33 (27–40) | 40 (26–53) | 44 (32–56) | 35 (24–45) | 0.528 |
ALT, alanine transaminase; CVD, cardiovascular disease; CV‐RR, coefficient of variation of R‐R intervals; DBP, diastolic blood pressure; eGFR, estimated glomerular filtration ratio; GTP, glutamyl transpeptidase; HDL, high‐density lipoprotein; LDL, low‐density lipoprotein; PDR proliferative diabetic retinopathy; Q, quartile; SBP, systolic blood pressure; SFA, subcutaneous fat area; UAE, urinary albumin excretion; VFA, visceral fat area; V/S, ratio of visceral to subcutaneous fat area.
Table 2.
Medications according to the ratio of visceral fat to subcutaneous fat area
| V/S ratio | P‐value | ||||
|---|---|---|---|---|---|
| Q1 (n = 170) | Q2 (n = 171) | Q3 (n = 171) | Q4 (n = 170) | ||
| Insulin (%) | 75 | 67 | 64 | 72 | 0.145 |
| Sulfonylureas (%) | 6 | 8 | 11 | 9 | 0.340 |
| Metformin (%) | 18 | 23 | 29 | 27 | 0.094 |
| Alpha‐GIs (%) | 11 | 7 | 5 | 11 | 0.121 |
| Glinides (%) | 4 | 6 | 5 | 4 | 0.528 |
| TZDs (%) | 2 | 5 | 3 | 6 | 0.318 |
| DPP4 inhibitors (%) | 32 | 29 | 30 | 29 | 0.935 |
| SGLT2 inhibitors (%) | 2 | 2 | 2 | 0 | 0.255 |
| GLP1‐RAs (%) | 4 | 6 | 8 | 7 | 0.257 |
| ACEIs (%) | 4 | 5 | 5 | 3 | 0.693 |
| ARBs (%) | 31 | 42 | 42 | 51 | 0.003 |
| CCBs (%) | 27 | 38 | 30 | 39 | 0.055 |
| Alpha‐blockers (%) | 2 | 1 | 1 | 2 | 0.710 |
| Beta‐blockers (%) | 6 | 9 | 13 | 6 | 0.039 |
| Diuretics (%) | 5 | 9 | 11 | 11 | 0.193 |
| Statins (%) | 35 | 44 | 46 | 42 | 0.163 |
| Fibrates (%) | 1 | 2 | 2 | 7 | 0.002 |
| Ezetimib (%) | 2 | 4 | 2 | 5 | 0.373 |
| EPAs (%) | 2 | 1 | 0 | 6 | <0.001 |
| UA‐lowering agents (%) | 4 | 4 | 10 | 12 | 0.015 |
| Anti‐platelet agents (%) | 9 | 21 | 23 | 15 | 0.004 |
ACEIs, angiotensin‐converting enzyme inhibitors; ARBs, angiotensin receptor blockers; DPP4, dipeptidyl peptidase 4; EPAs, eicosapentaenoic acids; GIs, glycosidase inhibitors; GLP1‐RA, glucagon‐like peptide‐1 receptors agonist; SGLT2, sodium–glucose cotransporter 2; TZDs, thiazolidinediones; UA, uric acid.
During the median follow‐up period of 2.50 years (range 0.02–4.18 years), 21 patients reached the end‐point including 14 events of coronary artery disease, four events of stroke and three events of peripheral arterial disease. Figure 1 shows the Kaplan–Meier curve of the time to the end‐point according to the quartiles of the V/S ratio from Q1 to Q4. The number of patients who reached the end‐point were 0 for Q1, five for Q2, six for Q3 and 10 for Q4. The 2‐year cumulative incidences of the end‐point were 0% for Q1, 3.0% for Q2, 3.2% for Q3 and 4.1% for Q4 (log–rank test, P = 0.085). In the univariate Cox regression analysis, a standard deviation increase in the V/S ratio was significantly associated with an increased risk for the end‐point, with a HR of 1.71 (95% CI: 1.12–2.63, P = 0.013; Table 3). The association between the V/S ratio and the end‐point remained significant, even after adjustment for covariates (HR 1.82, 95% CI: 1.09–3.04, P = 0.021). In this model, BNP, use of antiplatelet agents and HbA1c were also identified as significant risk factors for the end‐point. In contrast, either VFA (HR 1.70, 95% CI: 0.97–2.98, P = 0.066) or SFA (HR 1.07, 95% CI: 0.63–1.83, P = 0.802) were not significantly associated with the end‐point in the multivariate model.
Figure 1.
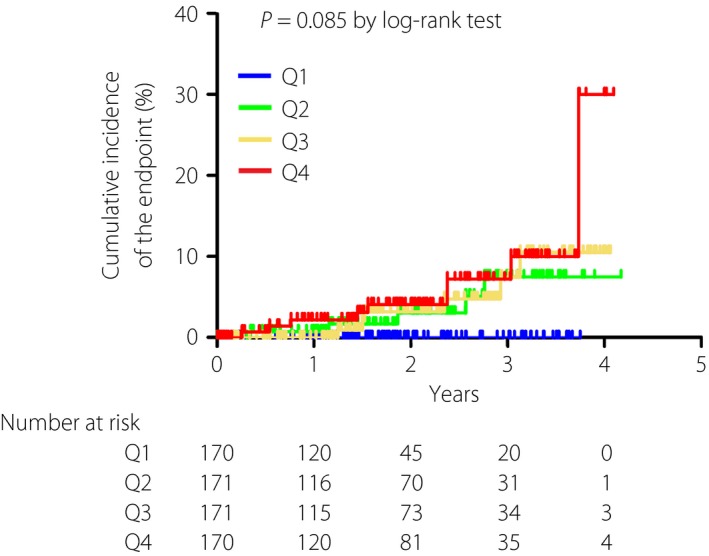
Kaplan–Meier curve of the time to the incident or recurrent cardiovascular disease according to the quartiles (Q) of the ratio of visceral fat area to subcutaneous fat area. P = 0.085 by log–rank test. Blue, Q1; green, Q2; yellow, Q3; red, Q4.
Table 3.
Hazard ratios of incident or recurrent cardiovascular disease in type 2 diabetes patients
| V/S ratio | VFA | SFA | |||||||
|---|---|---|---|---|---|---|---|---|---|
| HR | (95% CI) | P‐value | HR | (95% CI) | P‐value | HR | (95% CI) | P‐value | |
| Univariate model | |||||||||
| V/S ratio (+1SD) | 1.71 | (1.12–2.63) | 0.013 | NA | NA | ||||
| VFA (+1SD) | NA | 1.40 | (0.90–2.16) | 0.136 | NA | ||||
| SFA (+1SD) | NA | NA | 0.97 | (0.60–1.56) | 0.881 | ||||
| Multivariate model | |||||||||
| V/S ratio (+1SD) | 1.82 | (1.09–3.04) | 0.021 | NA | NA | ||||
| VFA (+1SD) | NA | 1.70 | (0.97–2.98) | 0.066 | NA | ||||
| SFA (+1SD) | NA | NA | 1.07 | (0.63–1.83) | 0.802 | ||||
| eGFR (mL/min/1.73 m2) | 0.98 | (0.96–1.00) | 0.066 | 0.97 | (0.95–1.00) | 0.027 | 0.98 | (0.96–1.00) | 0.043 |
| BNP (pg/mL) | 1.00 | (1.00–1.01) | 0.020 | 1.00 | (1.00–1.01) | 0.012 | 1.00 | (1.00–1.01) | 0.007 |
| Antiplatelet agents | 4.26 | (1.63–11.13) | 0.003 | 4.56 | (1.73–12.04) | 0.002 | 3.60 | (1.41–9.12) | 0.007 |
| CV‐RR (%) | 0.85 | (0.69–1.10) | 0.215 | 0.88 | (0.68–1.13) | 0.303 | 0.87 | (0.68–1.11) | 0.266 |
| HbA1c (%) | 1.37 | (1.05–1.79) | 0.021 | 1.39 | (1.05–1.84) | 0.021 | 1.37 | (1.05–1.77) | 0.019 |
| CCBs | NA | 0.42 | (0.15–1.18) | 0.100 | NA | ||||
BNP, brain‐type natriuretic peptide; CCB, calcium channel blocker; CI, confidence interval; CV‐RR, coefficient of variation of R‐R intervals; eGFR, estimated glomerular filtration rate; HR, hazard ratio; NA, not available; SFA, subcutaneous fat area; VFA, visceral fat area.
Figure 2 shows the performance for predicting the end‐point among the markers for adiposity. The AUC of the markers were as follows: V/S ratio 0.66 (95% CI: 0.57–0.76), VFA 0.62 (95% CI: 0.51–0.74), SFA 0.52 (95% CI: 0.40–0.64) and BMI 0.50 (95% CI: 0.39–0.62). In order to precisely assess and quantify the improvement of risk prediction for the end‐point by the markers for adiposity, we created statistical models in which NRI and IDI for V/S ratio, VFA, SFA or BMI were evaluated adjusting for independent variables including age, eGFR, BNP, use of antiplatelet agents and HbA1c, all of which were identified as significant predictors for the end‐point in a multivariate logistic regression model. In the analyses, the discrimination effects of adding the V/S ratio, VFA, SFA or BMI were examined. As shown in Table 4, the addition of the V/S ratio to the model significantly increased the predictive accuracy for the end‐point (NRI 0.60, 95% CI: 0.21–1.00, P = 0.003; IDI 0.02, 95% CI: 0.00–0.05, P = 0.048); by contrast, VFA (NRI 0.41, 95% CI: 0.01–0.82, P = 0.046; IDI 0.00, 95% CI: −0.01–0.01, P = 0.83), SFA (NRI 0.12, 95% CI: −0.29–0.53, P = 0.57; IDI 0.00, 95% CI: 0.00–0.00, P = 0.54) and BMI (NRI 0.13, 95% CI: −0.29–0.54, P = 0.55; IDI 0.00, 95% CI: 0.00–0.01, P = 0.48) did not increase the predictive accuracy for the end‐point.
Figure 2.
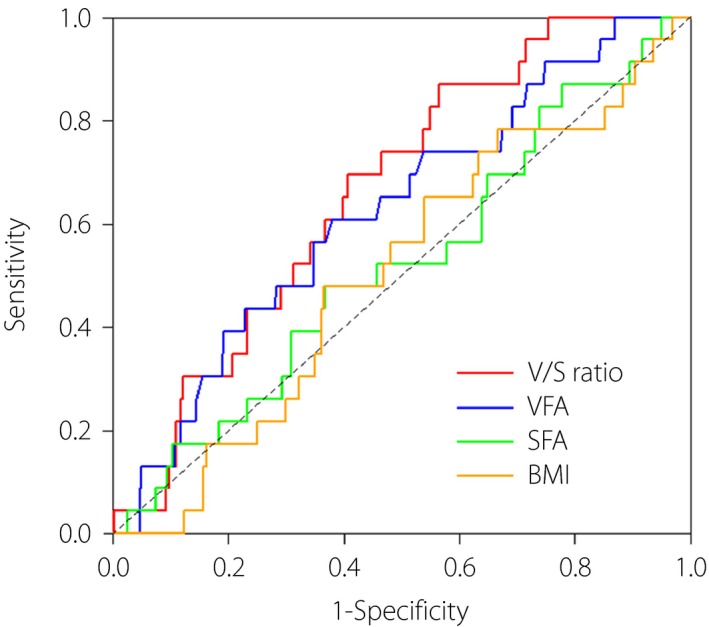
Comparison of the area under the curves (AUC) of the ratio of visceral fat area (VFA) to subcutaneous fat area (SFA; V/S ratio), VFA, SFA and body mass index (BMI). Red, V/S ratio; blue, VFA; green, SFA; yellow, BMI.
Table 4.
Net reclassification improvement and integrated discrimination improvement of the markers for adiposity to predict incident or recurrent cardiovascular disease
| NRI | IDI | |||||
|---|---|---|---|---|---|---|
| Index | 95% CI | P‐value | Index | 95% CI | P‐value | |
| V/S ratio | 0.60 | 0.21–1.00 | 0.003 | 0.02 | 0.00–0.05 | 0.048 |
| VFA | 0.41 | 0.01–0.82 | 0.046 | 0.00 | –0.01–0.01 | 0.83 |
| SFA | 0.12 | –0.29–0.53 | 0.57 | 0.00 | 0.00–0.00 | 0.54 |
| BMI | 0.13 | –0.29–0.54 | 0.55 | 0.00 | 0.00–0.01 | 0.48 |
BMI, body mass index; CI, confidence interval; IDI, integrated discrimination improvement; NRI, net reclassification improvement; SFA, subcutaneous fat area; VFA, visceral fat area; V/S ratio, ratio of visceral fat area to subcutaneous fat area.
Discussion
The present retrospective observational study showed for the first time that the V/S ratio is an independent predictor of incident or recurrent CVD among Japanese patients with type 2 diabetes. A high V/S ratio was significantly associated with an increased risk of CVD, even after adjusting for confounding factors, whereas VFA, SFA and BMI were no longer associated with incident or recurrent CVD. BMI has long been widely used as a marker for excess body fat, but it is difficult to precisely evaluate visceral fat accumulation by BMI27, 28. In the present study, we showed that BMI is inferior to the V/S ratio with regard to estimating the risk for incident or recurrent CVD in patients with type 2 diabetes. These data show that direct measurement of both visceral and subcutaneous fat accumulation, and the relative distribution of body fat (balance of visceral and subcutaneous fat accumulation) are clinically important to assess the risk of incident or recurrent CVD in patients with type 2 diabetes.
Although VFA was a significant predictor of cardiometabolic risks, several recent studies reported that the V/S ratio shows a better performance of predicting cardiometabolic risks than VFA. In a population‐based cross‐sectional study from Korea, participants with a high level of the ratio of the SFA‐to‐VFA ratio (inverse of the V/S ratio) showed higher high‐density lipoprotein cholesterol and lower fasting glucose, resulting in a lower prevalence of metabolic syndrome than those with a low level of the SFA‐to‐VFA ratio17. In the survey of 3,223 participants from the Framingham Heart Study, a higher V/S ratio was significantly associated with cardiovascular risk factors including blood pressure, dyslipidemia and insulin resistance independently of BMI18. Katsuyama et al.19 reported in a cross‐sectional study comprising obese participants that the V/S ratio was significantly and positively associated with fasting triglyceride levels and brachial‐ankle pulse wave velocity, a marker of arterial stiffness, but VFA was not associated with brachial‐ankle pulse wave velocity. Additionally, we previously reported that high visceral fat with low subcutaneous fat accumulation is an important determinant of carotid intima‐media thickness, a surrogate marker of atherosclerosis, in patients with type 2 diabetes21. However, no data are available on the longitudinal associations of the V/S ratio with incident or recurrent CVD in patients with diabetes. In the present retrospective observational study, we clarified for the first time that diabetes patients with a higher V/S ratio are more likely to develop CVD, and the accuracy of prediction in incident or recurrent CVD is higher in the V/S ratio than those in VFA, SFA or BMI.
ROC analysis and AUC have been widely used to estimate the performance of binary classification. In the present study, performance of the V/S ratio to predict the end‐point assessed by ROC analysis seemed to be higher than that of VFA, SFA or BMI. However, it has been pointed out in recent years that AUC might not be suitable to quantify improvements in diagnostic accuracy of the added value to an existing model as a new predictor26, 29. Cook30 reported that the change in AUC can appear small even for new markers that are strongly associated with outcomes. To conquer the disadvantages of ROC analysis, NRI and IDI have been proposed by Pencina et al.25 as a novel criteria based on reclassification to directly evaluate the extent to which a new predictor improves classification performance. In the present study, NRI for the V/S ratio was 0.60, which shows 60% improvement in the prediction accuracy of the end‐point, and which is higher than that for the other markers for adiposity including VFA, SFA and BMI (Table 4). These results suggest the superiority of the V/S ratio to other markers for adiposity including VFA with regard to the risk prediction of incident or recurrent CVD in patients with type 2 diabetes.
The present study had several limitations. First, the follow‐up period was relatively short, and the number of CVD events was small. We included five to six variables in the Cox proportional hazard analysis in the present study. As 5–10 events per variable might be satisfactory for the analysis, the small number of cardiovascular events in this study might reduce the reliability of the analysis. Second, dual BIA was used for the assessment of visceral and subcutaneous adiposity. Although abdominal CT is a reliable standard, dual BIA is non‐invasive, has high accuracy23, 24 and is uncomplicated to examine at a much lower cost than CT. We showed in the present study that the V/S ratio measured by dual BIA was valuable to estimate the risk for CVD in patients with diabetes. Taken together, it is conceivable that dual BIA instead of abdominal CT can be used to evaluate visceral and subcutaneous adiposity. Third, the characteristics of patients in the present study were homogenous, limiting the generalization of the findings. Fourth, we were unable to obtain information on the change of markers for fat distribution during the follow‐up period. Fifth, we were unable to carry out the sensitivity analysis by sex. It is well known that women have a higher amount of body fat and store a greater amount of fat in the glutal‐femoral region than men, whereas men store a greater amount of fat in the visceral depot. Therefore, the sensitivity analysis by sex should determine whether the V/S ratio could be associated with incident or recurrent CVD. However, we could not develop valid statistical models of each sex because of the small sample size and relatively small number of female patients who reached the end‐point (six female patients reached the end‐point). Sixth, the present study had a retrospective design, and there might be some selection bias. Further large prospective studies are required to confirm the impact of the V/S ratio for incident or recurrent CVD. Finally, future studies will investigate whether the V/S ratio could predict cardiovascular events in the non‐diabetes population or in ethnic groups other than Japanese.
In summary, the present data suggest that a high V/S ratio significantly increases the risk of cardiovascular events, and the predictive performance of the V/S ratio for incident or recurrent CVD is higher than that of VFA, SFA and BMI.
Disclosure
The authors declare no conflict of interest.
Acknowledgments
The authors thank all the staff of the Department of Molecular Endocrinology and Metabolism, Tokyo Medical and Dental University. This work was partially supported by Grants‐in‐Aid for Scientific Research from the Ministry of Education, Culture, Sports, Science and Technology of Japan; Grants‐in‐Aid from the Ministry of Health, Labor and Welfare of Japan (Comprehensive Research on Lifestyle‐Related Diseases Including Cardiovascular Diseases and Diabetes Mellitus); and Grants‐in‐Aid from Astellas Foundation for Research on Metabolic Disorders.
J Diabetes Investig 2018;9: 396–402
References
- 1. Van Gaal LF, Mertens IL, De Block CE. Mechanisms linking obesity with cardiovascular disease. Nature 2006; 444: 875–880. [DOI] [PubMed] [Google Scholar]
- 2. Resnick HE, Valsania P, Halter JB, et al Relation of weight gain and weight loss on subsequent diabetes risk in overweight adults. J Epidemiol Community Health 2000; 54: 596–602. [DOI] [PMC free article] [PubMed] [Google Scholar]
- 3. Howard BV, Ruotolo G, Robbins DC. Obesity and dyslipidemia. Endocrinol Metab Clin North Am 2003; 32: 855–867. [DOI] [PubMed] [Google Scholar]
- 4. Rahmouni K, Correia ML, Haynes WG, et al Obesity‐associated hypertension: new insights into mechanisms. Hypertension 2005; 45: 9–14. [DOI] [PubMed] [Google Scholar]
- 5. Kaess BM, Jozwiak J, Mastej M, et al Association between anthropometric obesity measures and coronary artery disease: a cross‐sectional survey of 16,657 subjects from 444 Polish cities. Heart 2010; 96: 131–135. [DOI] [PubMed] [Google Scholar]
- 6. Hayashi T, Boyko EJ, Leonetti DL, et al Visceral adiposity and the prevalence of hypertension in Japanese Americans. Circulation 2003; 108: 1718–1723. [DOI] [PubMed] [Google Scholar]
- 7. Chiba Y, Saitoh S, Takagi S, et al Relationship between visceral fat and cardiovascular disease risk factors: the Tanno and Sobetsu study. Hypertens Res 2007; 30: 229–236. [DOI] [PubMed] [Google Scholar]
- 8. Sahakyan KR, Somers VK, Rodriguez‐Escudero JP, et al Normal‐weight central obesity: implications for total and cardiovascular mortality. Ann Intern Med 2015; 163: 827–835. [DOI] [PMC free article] [PubMed] [Google Scholar]
- 9. Bouchi R, Minami I, Ohara N, et al Impact of increased visceral adiposity with normal weight on the progression of arterial stiffness in Japanese patients with type 2 diabetes. BMJ Open Diabetes Res Care 2015; 3: e000081. [DOI] [PMC free article] [PubMed] [Google Scholar]
- 10. Fujimoto WY, Bergstrom RW, Boyko EJ, et al Preventing diabetes–applying pathophysiological and epidemiological evidence. Br J Nutr 2000; 84(Suppl 2): 173–176. [DOI] [PubMed] [Google Scholar]
- 11. World Health Organization . The Asia‐Pacific Perspective Redefining Obesity and its Treatment. Available from: http://www.wpro.who.int/nutrition/documents/docs/Redefiningobesity.pdf; 2000 Accessed May 28, 2017.
- 12. WHO Expert Consultation . Appropriate body‐mass index for Asian populations and its implications for policy and intervention strategies. Lancet 2004; 363: 157–163. [DOI] [PubMed] [Google Scholar]
- 13. Tanaka S, Horimai C, Katsukawa F. Ethnic differences in abdominal visceral fat accumulation between Japanese, African‐Americans, and Caucasians: a meta‐analysis. Acta Diabetol 2003; 40(Suppl 1): 302–304. [DOI] [PubMed] [Google Scholar]
- 14. Park YW, Allison DB, Heymsfield SB, et al Larger amounts of visceral adipose tissue in Asian Americans. Obes Res 2001; 9: 381–387. [DOI] [PubMed] [Google Scholar]
- 15. Snijder MB, Visser M, Dekker JM, et al Health ABC Study: low subcutaneous thigh fat is a risk factor for unfavourable glucose and lipid levels, independently of high abdominal fat. The Health ABC Study. Diabetologia 2005; 48: 301–308. [DOI] [PubMed] [Google Scholar]
- 16. Porter SA, Massaro JM, Hoffmann U, et al Abdominal subcutaneous adipose tissue: a protective fat depot? Diabetes Care 2009; 32: 1068–1075. [DOI] [PMC free article] [PubMed] [Google Scholar]
- 17. Kim S, Cho B, Lee H, et al Distribution of abdominal visceral and subcutaneous adipose tissue and metabolic syndrome in a Korean population. Diabetes Care 2011; 34: 504–506. [DOI] [PMC free article] [PubMed] [Google Scholar]
- 18. Kaess BM, Pedley A, Massaro JM, et al The ratio of visceral to subcutaneous fat, a metric of body fat distribution, is a unique correlate of cardiometabolic risk. Diabetologia 2012; 55: 2622–2630. [DOI] [PMC free article] [PubMed] [Google Scholar]
- 19. Katsuyama H, Kawaguchi A, Yanai H. Not visceral fat area but the ratio of visceral to subcutaneous fat area is significantly correlated with the marker for atherosclerosis in obese subjects. Int J Cardiol 2015; 179: 112–113. [DOI] [PubMed] [Google Scholar]
- 20. Narumi H, Yoshida K, Hashimoto N, et al Increased subcutaneous fat accumulation has a protective role against subclinical atherosclerosis in asymptomatic subjects undergoing general health screening. Int J Cardiol 2009; 135: 150–155. [DOI] [PubMed] [Google Scholar]
- 21. Bouchi R, Takeuchi T, Akihisa M, et al High visceral fat with low subcutaneous fat accumulation as a determinant of atherosclerosis in patients with type 2 diabetes. Cardiovasc Diabetol 2015; 14: 136. [DOI] [PMC free article] [PubMed] [Google Scholar]
- 22. Committee of the Japan Diabetes Society on the Diagnostic Criteria of Diabetes Mellitus , Seino Y, Nanjo K, et al Report of the committee on the classification and diagnostic criteria of diabetes mellitus. J Diabetes Investig 2010; 1: 212–228. [DOI] [PMC free article] [PubMed] [Google Scholar]
- 23. Yamakage H, Ito R, Tochiya M, et al The utility of dual bioelectrical impedance analysis in detecting intra‐abdominal fat area in obese patients during weight reduction therapy in comparison with waist circumference and abdominal CT. Endocr J 2014; 61: 807–819. [DOI] [PubMed] [Google Scholar]
- 24. Ida M, Hirata M, Odori S, et al Early changes of abdominal adiposity detected with weekly dual bioelectrical impedance analysis during calorie restriction. Obesity (Silver Spring) 2013; 21: E350–E353. [DOI] [PubMed] [Google Scholar]
- 25. Matsuo S, Imai E, Horio M, et al Collaborators developing the Japanese equation for estimated GFR: revised equations for estimated GFR from serum creatinine in Japan. Am J Kidney Dis 2009; 53: 982–992. [DOI] [PubMed] [Google Scholar]
- 26. Pencina MJ, D'Agostino RB Sr, D'Agostino RB Jr, et al Evaluating the added predictive ability of a new marker: from area under the ROC curve to reclassification and beyond. Stat Med 2008; 27: 157–172. [DOI] [PubMed] [Google Scholar]
- 27. Gómez‐Ambrosi J, Silva C, Galofré JC, et al Body mass index classification misses subjects with increased cardiometabolic risk factors related to elevated adiposity. Int J Obes (Lond) 2012; 36: 286–294. [DOI] [PubMed] [Google Scholar]
- 28. Okorodudu DO, Jumean MF, Montori VM, et al Diagnostic performance of body mass index to identify obesity as defined by body adiposity: a systematic review and meta‐analysis. Int J Obes (Lond) 2010; 34: 791–799. [DOI] [PubMed] [Google Scholar]
- 29. Pepe MS, Janes H, Longton G, et al Limitations of the odds ratio in gauging the performance of a diagnostic, prognostic, or screening marker. Am J Epidemiol 2004; 159: 882–890. [DOI] [PubMed] [Google Scholar]
- 30. Cook NR. Use and misuse of the receiver operating characteristic curve in risk prediction. Circulation 2007; 115: 928–935. [DOI] [PubMed] [Google Scholar]