

Abstract
Aims/Introduction
To establish that the ficolin‐3/adiponectin ratio is a predictor for gestational diabetes mellitus (GDM) and is eligible for screening tests for GDM.
Materials and Methods
A prospective cohort study of 86 pregnant women who developed GDM and 273 normal glucose tolerance participants was carried out. Maternal serum ficolin‐3, adiponectin levels were investigated at 16–18 weeks of gestation using enzyme‐linked immunosorbent assay.
Results
Compared with the normal glucose tolerance group, the GDM group showed significantly higher levels of ficolin‐3 and the ratio of ficolin‐3/adiponectin; and decreased levels of adiponectin between 16–18 weeks of gestation (P < 0.05 or P < 0.01). The cut‐off values for the ratio of ficolin‐3/adiponectin (≥1.06; sensitivity 90.9%, specificity 96.5%) to discriminate the pregnant women who developed GDM from the non‐diabetic cases were identified using receiver operating characteristic analysis. Using binary logistic regression analysis, ficolin‐3, retinol‐binding protein‐4 and adiponectin, but not C‐reactive protein, triglyceride and free fatty acids were shown as predictive factors for GDM.
Conclusions
The ratio of ficolin‐3/adiponectin at 16–18 weeks of gestation was changed in pregnant women who subsequently developed GDM, and might provide effective early predicting and screening for GDM.
Keywords: Biological marker, Ficolin‐3, Gestational diabetes mellitus
Introduction
Gestational diabetes mellitus (GDM) might contribute to an increasing global epidemic of type 2 diabetes mellitus, which is characterized by new‐onset of glucose intolerance during pregnancy. A high risk of developing type 2 diabetes mellitus for both mother and possibly for the child caused by GDM is associated with the epidemic of type 2 diabetes mellitus1. Validating pregnant women at risk of GDM is critical to effective prevention and management of this complication2. Being epidemiologically and biochemically similar to type 2 diabetes mellitus, GDM shows an overlap with risk factors and predictive markers for type 2 diabetes mellitus. As predictors for type 2 diabetes mellitus, some inflammatory markers and adipokines are also used to assess the risk of GDM3, 4, 5.
Ficolin‐3 is an activator of the lectin pathway of the complement system, which has recently been linked to insulin resistance and the development of type 2 diabetes mellitus6. The elevated ficolin‐3 levels were found both in the serum of type 2 diabetes mellitus patients, and in the vitreous fluid and serum of patients with proliferative diabetic retinopathy, as described previously7, 8. However, low levels of ficolin‐3 were subsequently reported to be associated with the incidence of type 2 diabetes mellitus and diabetic peripheral neuropathy by a prospective study and cross‐sectional studies6, 9. Furthermore, pregnant women with pre‐eclampsia (PE) or GDM outcome show significantly decreased levels of ficolin‐3 compared with normal participants, as assessed by enzyme‐linked immunosorbent assay (ELISA) and quantitative proteomic analysis, respectively10, 11.
In contrast with other adipokines, such as retinol‐binding protein 4 (RBP‐4) and visfatin, adiponectin is inversely correlated to type 2 diabetes mellitus and GDM12, 13, 14. However, fewer studies show that low adiponectin levels have no association with the risk of GDM15, 16.
Given contradictory ficolin‐3 levels in type 2 diabetes mellitus patients, and insistent adiponectin levels with the risk of GDM, we carried out a prospective cohort study to identify the alteration of ficolin‐3, adiponectin and other parameters at 16–18 weeks of gestation. Furthermore, we also identified the potential predictors with or without combination for screening GDM using receiver operating characteristic (ROC) curve analysis.
Methods
Patient recruitment and blood collection
We carried out a prospective cohort study,which was approved by the ethics committee of Changzhou Women and Children Health Hospital affiliated to Nanjing Medical University (no. ZD201203). Between April 2013 and July 2014, a total of 526 consecutively pregnant women received their first prenatal examination at 16–18 weeks of gestation at Changzhou Maternity and Child Health Hospital, and were enrolled to the present study. Written informed consent was obtained from each participant. The study participants were given a routine diagnosis of GDM by an oral glucose tolerance test at 24–28 weeks of gestation. We diagnosed GDM patients with the International Association of Diabetic Pregnancy Study Group criteria by a 75‐g oral glucose tolerance test17. GDM was defined if one or more glucose level was not less than fasting 5.1 mmol/L, 1‐h glucose 10.0 mmol/L or 2‐h glucose 8.5 mmol/L. A total of 97 of the 526 participants were diagnosed as GDM. For achieving euglycemia, the GDM patients were given low‐sugar and low‐fat diet intake without any antidiabetic drugs. The criteria for exclusion was as follows: (i) missed collection of programmed blood specimens; (ii) age <18 or >40 years; (iii) multifetal pregnancy; (iv) gestational age <37 weeks; (v) illicit drug and/or alcohol use; and (vi) pre‐existing illnesses including pregestational diabetes mellitus (type 1 or 2), active or chronic liver diseases and renal failure, PE, thyroid or other endocrine disease, and chronic hypertension. No participants smoked during pregnancy. A total of 127 of the 429 NGT participants and five of the 97 GDM patients were excluded, as they rejected the screen test for Down syndrome at 16–18 weeks of gestation and delivery in our hospital, and thus did not provide blood samples and the outcome of pregnancy. Also excluded were six GDM patients and 29 NGT cases for pregestational diabetes mellitus (n = 1), multiple pregnancy (n = 2), PE (n = 8), premature delivery (n = 12) and rejection of the study (n = 12). A total of 86 GDM and 273 NGT participants with singleton pregnancy constituted the study (Figure 1). The diagnosis of pregestational diabetes mellitus depended on self‐report and medical records information. The outcome parameters of eligible participants were investigated at 16–18 weeks of gestation. The aliquots of serum from participants were frozen at −80°C until the measurements.
Figure 1.
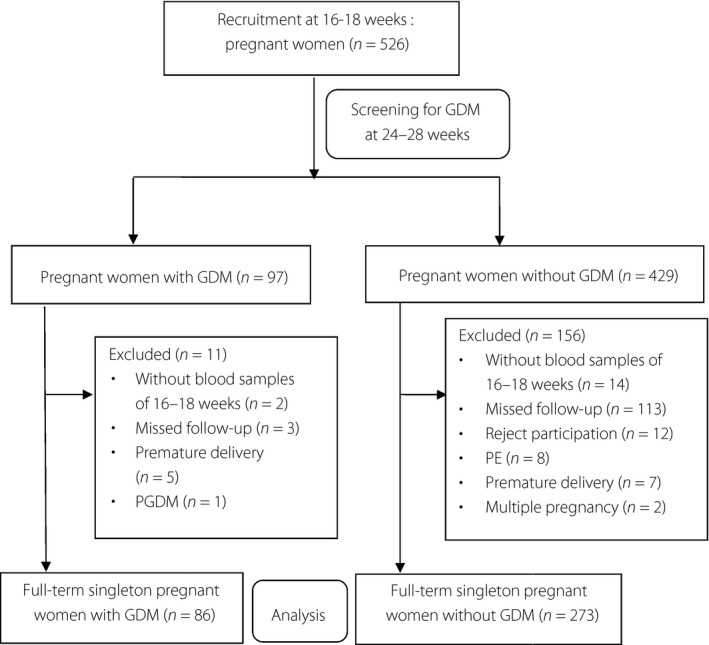
Flow chart. GDM, gestational diabetes mellitus; PE, pre‐eclampsia; PGDM, pre‐gestational diabetes mellitus.
Laboratory analysis
Standard laboratory methods were established to determined clinical parameters of chemistry. Fasting glucose, lipids, free fatty acids (FFAs), C‐reactive protein (CRP) and RBP‐4 were measured by an automatic biochemical analyzer (Hitachi 7180; Hitachi, Ibaraki‐ken, Japan) using commercial kits (Wako Pure Chemical Industries, Osaka, Japan). Ficolin‐3 and adiponectin were tested by an automated enzyme immunoassay analyzer (Hamilton‐Medical, Bonaduz, Switzerland) using ELISA kits (Shanghai Bio‐Sh Biotechnology, Shanghai, China) following the manufacturers’ protocol. Specimens with arbitrary order were detected in duplicate by the staff members, who were unaware of the study design. All of inter‐ and intra‐assay variability for ficolin‐3 and adiponectin were <6%.
Statistical analysis
All data are presented as medians (interquartile range [IQR]) and statistically analyzed by Spss 19.0 software (SPSS, Chicago, Illinois, USA). The Mann–Whitney U‐test was applied to assess the differences between the two groups. To identify the correlation among different variables, Spearman's correlation and partial correlation analysis were used. ROC curves were constructed to evaluate the sensitivity and specificity of different tests, and to determine the cut‐off values. Using binary logistic regression analyses, the influence of possible predictors on GDM outcome with odds ratios (OR) and 95% confidence intervals (CI) were test. At a level of P‐value <0.05 was considered statistically significant.
Results
Demographic and pregnancy characteristics
Characteristics of the total 359 participants with chemistry at 16–18 weeks of gestation are presented in Table 1. In the group that developed GDM compared with the control group, the maternal age, body mass index, fasting glucose and triglyceride levels were higher, and gestational weeks at delivery were lower. No statistically significant difference in neonatal birthweight and other lipids between groups was observed.
Table 1.
Comparison of clinical parameters between women who developed gestational diabetes mellitus and normal glucose tolerance
| GDM | NGT | P‐value | |
|---|---|---|---|
| Participants (n) | 86 | 273 | |
| Maternal age (years) | 29.00 (27.00–33.00) | 26.00 (24.00–28.25) | <0.001 |
| Body mass index (kg/m2) | 24.58 (21.72–26.93) | 22.32 (20.66–24.39) | <0.001 |
| Fasting glucose (mmol/L) | 4.68 (4.37–5.03) | 4.12 (3.94–4.28) | <0.001 |
| Triglyceride (mmol/L) | 2.05 (1.78–2.81) | 1.85 (1.51–2.13) | <0.001 |
| LDL‐C (mmol/L) | 2.50 (2.11–2.85) | 2.45 (2.09–2.83) | 0.870 |
| HDL‐C (mmol/L) | 1.51 (1.26–1.79) | 1.55 (1.37–1.80) | 0.518 |
| Total cholesterol (mmol/L) | 5.08 (4.59–5.49) | 4.92 (4.49–5.36) | 0.291 |
| Gestation at delivery (weeks) | 38.00 (38.00–39.00) | 39.00 (39.00–40.00) | <0.001 |
| Fetal birthweight | 3.45 (3.10–3.82) | 3.44 (3.26–3.75) | 0.459 |
Data was presented as medians (interquartile range). GDM, gestational diabetes mellitus; HDL‐C, high‐density lipoprotein cholesterol; LDL‐C, low‐density lipoprotein cholesterol; NGT, normal glucose tolerance.
Differences in possible predictors
The levels of ficolin‐3, CRP, and adipokines at the early second trimester are summarized in Table 2 and shown in Figure 2. The group that developed GDM had statistically significantly higher concentrations of ficolin‐3, CRP, RBP‐4 and FFAs than the control group (for ficolin‐3: 10.64 μg/mL, IQR 7.50–11.25, vs 8.24 μg/mL, IQR 6.34–9.57, P < 0.001; for CRP: 3.60 μg/mL, IQR 1.80–6.45, vs 1.90 μg/mL, IQR 1.10–4.40, P = 0.004; for RBP‐4: 31.70 μg/mL, IQR 28.7–35.03, vs 28.25 μg/mL, IQR 25.6–30.45, P < 0.001; for FFAs: 0.60 mmol/L, IQR 0.50–0.70, vs 0.53 mmol/L, IQR 0.44–0.63, P = 0.009). However, the levels of adiponectin in participants who developed GDM were significantly decreased compared with NGT (8.60 μg/mL, IQR 5.03–9.76, vs 10.68 μg/mL, IQR 9.24–12.86, P < 0.001). The elevated ratios of CRP/adiponectin, RBP‐4/adiponectin and ficolin‐3/adiponectin were also observed in participants who developed GDM.
Table 2.
Summary of maternal serum levels of predictors in the outcome groups
| Screening test | GDM | NGT | P‐value | Adjust P‐value |
|---|---|---|---|---|
| CRP (μg/mL) | 3.60 (1.80–6.45) | 1.90 (1.10–4.40) | 0.004 | 0.28 |
| RBP‐4 (μg/mL) | 31.70 (28.70–35.03) | 28.52 (25.60–30.45) | <0.001 | <0.001 |
| Adiponectin (μg/mL) | 8.60 (5.03–9.76) | 10.68 (9.24–12.86) | <0.001 | <0.001 |
| Ficolin‐3 (μg/mL) | 10.64 (7.50–11.25) | 8.24 (6.34–9.57) | <0.001 | <0.001 |
| FFAs (mmol/L) | 0.60 (0.50–0.70) | 0.53 (0.44–0.63) | 0.009 | 0.111 |
| CRP/adiponectin | 0.55 (0.29–0.93) | 0.21 (0.11–0.65) | <0.001 | 0.002 |
| RBP‐4/adiponectin | 4.07 (3.26–6.20) | 2.72 (2.29–3.20) | <0.001 | <0.001 |
| Ficolin‐3/adiponectin | 1.26 (1.17–1.48) | 0.93 (0.84–1.03) | <0.001 | <0.001 |
Data are presented as medians (interquartile range). GDM, gestational diabetes mellitus; CRP, C‐reactive protein; FFAs, free fatty acids; NGT, normal glucose tolerance; RBP‐4, retinol‐binding protein‐4.
Figure 2.
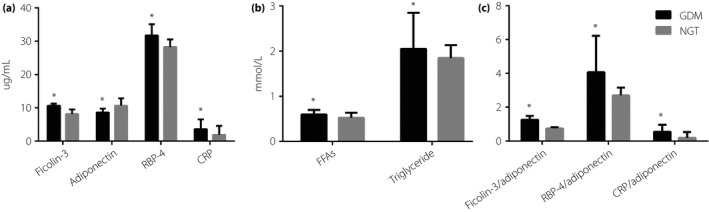
The levels of predictors in pregnant women with gestational diabetes mellitus (GDM) and normal glucose tolerance (NGT) at 16–18 weeks of gestation. *P < 0.01 vs NGT. CRP, C‐reactive protein; FFAs, free fatty acids; RBP‐4, retinol‐binding protein‐4.
Efficiency of screening
ROC curves containing ficolin‐3 and other markers for screening GDM are shown in Figure 3 from data at 16–18 weeks of gestation. The cut‐off values and performance of these tests are generalized in Table 3. With the ficolin‐3/adiponectin cut‐off value of 1.06, the highest performance was obtained (sensitivity 90.9%, specificity 96.5%, area under ROC curve 0.968, 95% CI 0.940–0.995).
Figure 3.
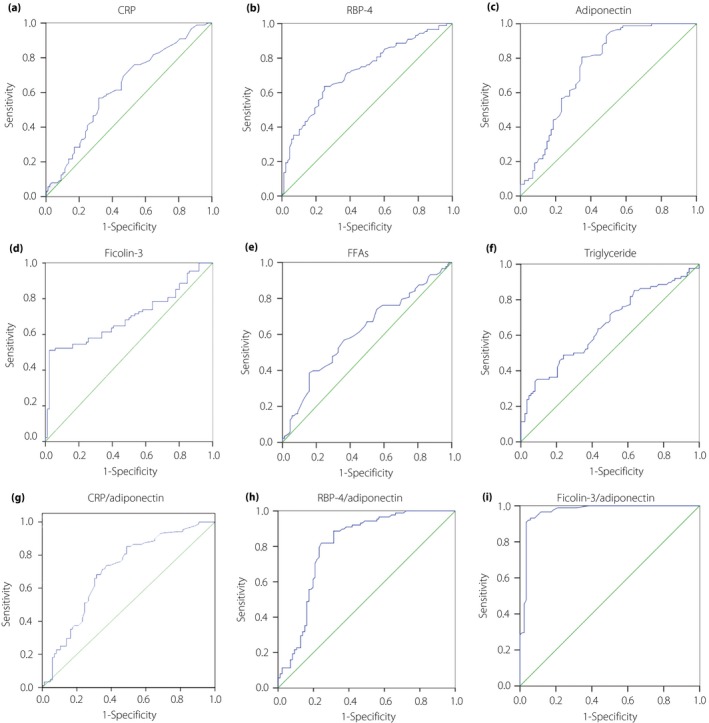
(a–i) Receiver operating characteristic curves were presented for different screen tests with the date derived at 16–18 weeks of gestation. CRP, C‐reactive protein; FFAs, free fatty acids; RBP‐4, retinol‐binding protein‐4; ROC, receiver operating characteristic.
Table 3.
Efficiency of screening for gestational diabetes mellitus by different markers and their combinations at 16–18 weeks of gestation with receiver operating characteristic curve analysis
| Screening test | Cut‐off value | Sensitivity (specificity) | AUROC (95% CI) |
|---|---|---|---|
| CRP (μg/mL) | ≥3.25 | 56.8% (68.2%) | 0.626 (0.544–0.709) |
| RBP‐4 (μg/mL) | ≥30.45 | 63.6% (75.0%) | 0.721 (0.646–0.796) |
| Adiponectin (μg/mL) | ≤9.93 | 80.7% (65.1%) | 0.751 (0.677–0.825) |
| Ficolin‐3 (μg/mL) | ≥10.55 | 51.1% (97.7%) | 0.697 (0.617–0.777) |
| FFAs (mmol/L) | ≥0.58 | 56.8% (63.6%) | 0.614 (0.531–0.697) |
| Triglyceride (mmol/L) | ≥2.53 | 35.2% (90.9%) | 0.655 (0.574–0.635) |
| CRP/adiponectin | ≥0.37 | 68.2% (68.6%) | 0.704 (0.626–0.752) |
| RBP‐4/adiponectin | ≥3.17 | 81.8% (75.6%) | 0.801 (0.732–0.870) |
| Ficolin‐3/adiponectin | ≥1.06 | 90.9% (96.5%) | 0.968 (0.940–0.995) |
AUROC, area under receiver operating characteristic curve; CI, confidence intervals; CRP, C‐reactive protein; FFAs, free fatty acids; GDM, gestational diabetes mellitus; RBP‐4, retinol‐binding protein‐4.
Predictors and risk of GDM
Table 4 showed an association between the concentrations of possible predictors at 16–18 weeks of gestation and the risk of GDM with logistic regression analysis. Using binary logistic regression analysis, ficolin‐3, adiponectin and RBP‐4 were shown as significant predictive factors of GDM, with odds ratios of 2.47, 3.57 and 2.82, respectively. Also, age and body mass index were shown as predictors with borderline significance, whereas CRP, FFAs and triglyceride were not.
Table 4.
Binary logistic regression analysis using different markers and their combinations at 16–18 weeks of gestation to predict gestational diabetes mellitus
| Predictors at 16–18 weeks gestation | Univariate | Multivariate | ||||
|---|---|---|---|---|---|---|
| OR | 95% CI | P‐value | OR | 95% CI | P‐value | |
| Maternal age (years) | 2.30 | 1.57–3.38 | <0.001 | 2.37 | 1.46–3.87 | 0.001 |
| Body mass index (kg/m2) | 1.93 | 1.31–2.82 | 0.001 | 2.10 | 1.26–3.49 | 0.004 |
| CRP (μg/mL) | 1.72 | 1.18–2.51 | 0.005 | 1.23 | 0.73–2.06 | 0.441 |
| RBP‐4 (μg/mL) | 2.25 | 1.52–3.33 | <0.001 | 2.82 | 1.63–4.90 | 0.004 |
| Adiponectin, μg/mL (per μg/mL decrease) | 2.90 | 1.92–4.39 | <0.001 | 3.57 | 2.13–6.00 | <0.001 |
| Ficolin‐3 (μg/mL) | 2.34 | 1.58–3.48 | <0.001 | 2.47 | 1.52–4.00 | <0.001 |
| FFAs (mmol/L) | 1.70 | 1.17–2.48 | 0.006 | 1.31 | 0.81–2.12 | 0.179 |
| Triglyceride (mmol/L) | 1.93 | 1.31–2.82 | 0.001 | 1.13 | 0.67–1.92 | 0.644 |
CI, confidence intervals; CRP, C‐reactive protein; FFAs, free fatty acids; RBP‐4, retinol‐binding protein‐4; GDM, gestational diabetes mellitus; OR, odds ratio.
Relationship of ficolin‐3 levels to other predictors
To identify the influencing factors of ficolin‐3, Spearman's and partial correlation analysis between ficolin‐3 and other clinical parameters at 16–18 weeks of gestation were carried out (Table 5). Ficolin‐3 showed a statistical positive correlation with CRP in participants who developed GDM (r = 0.241 and P = 0.026). There was a significant negative association between serum ficolin‐3 and adiponectin in the GDM group (r = −0.371 and P < 0.01).
Table 5.
Spearman's correlation between ficolin‐3 levels and other predictors at 16–18 weeks of gestation
| Predictors at 16–18 weeks gestation | GDM | NGT | ||
|---|---|---|---|---|
| Unadjusted | Adjusted for age and BMI | Unadjusted | Adjusted for age and BMI | |
| r (P‐value) | r (P‐value) | r (P‐value) | r (P‐value) | |
| Maternal age (years) | 0.061 (0.572) | – | −0.033 (0.766) | – |
| Body mass index (kg/m2) | 0.002 (0.988) | – | −0.100 (0.361) | – |
| CRP (μg/mL) | 0.166 (0.122) | 0.241 (0.026)* | −0.158 (0.147) | −0.090 (0.414) |
| RBP‐4 (μg/mL) | 0.110 (0.309) | 0.191 (0.078) | −0.095 (0.382) | −0.036 (0.744) |
| Adiponectin (μg/mL) | −0.316 (0.012)* | −0.371 (0.009)* | −0.152 (0.167) | −0.149 (0.251) |
| FFA (mmol/L) | 0.140 (0.192) | 0.121 (0.268) | −0.119 (0.275) | −0.169 (0.125) |
| Triglyceride (mmol/L) | 0.142 (0.188) | 0.122 (0.262) | 0.049 (0.657) | −0.013 (0.904) |
Data was presented as medians (interquartile range). *Statistically significant. BMI, body mass index; GDM, gestational diabetes mellitus; NGT, normal glucose tolerance; CRP, C‐reactive protein; RBP‐4, retinol‐binding protein‐4; FFAs, free fatty acids.
Discussion
To our knowledge, there have been few published reports on the ratio of maternal serum ficolin‐3/adiponectin and GDM. Herein, we investigated serum levels of ficolin‐3, adiponectin and other biomarkers at 16–18 weeks of gestation in women who developed GDM and NGT participants. Compared with the NGT group, the GDM group showed significantly higher levels of ficolin‐3, RBP‐4, CRP, Triglyceride, FFAs, the ratios of ficolin‐3/adiponectin and RBP‐4/adiponectin; and decreased levels of adiponectin between 16–18 weeks of gestation. We then showed the early predictive and diagnostic value of GDM with the ratio of ficolin‐3/adiponectin, and obtained high sensitivity and specificity to this pregnancy complication using ROC curve analysis. There is an increasing demand to predict and diagnose pregnancy‐induced diabetes earlier if the short‐term and long‐term risks to the mother and fetus are to be minimized. As hyperglycemia induced by pregnancy is often unnoticeable at 16–18 weeks of gestation, it is not appropriate to diagnose GDM by 75‐g oral glucose tolerance test at this stage. The present findings might provide an alternative early predictive and diagnostic method for GDM.
The complement system activated by classical pathway, alternative pathway and lectin pathway is an important branch of innate immunity and inflammation. The activation of the complement system has been identified to play an important role in the pathogenesis of type 2 diabetes mellitus and PE18, 19. High concentrations of ficolin‐3 and CRP triggered the lectin pathway and classical pathway, respectively, were found in pregnant women who developed GDM in present study. Furthermore, we observed that ficolin‐3 had a positive relationship with CRP in pregnant women who developed GDM. The present findings suggest that ficolin‐3 and CRP show a synergistic action by the activation of the complement system and thus extend the importance to GDM. However, the present study was contrary to the previous report that the participants who developed GDM showed downregulated ficolin‐3, as assessed by multiplexed isobaric tandem mass tag labeling combined with liquid chromatography mass spectrometry and Western blot analysis. The inconsistency was also reported in type 2 diabetes mellitus6, 7. The major differences in these studies was the utilization of different sample sizes, various types of specimens (plasma, serum) and different test methods (e.g., liquid chromatography mass spectrometry, Western blot analysis, ELISA). Furthermore, using different commercial ELISA kits with different units (μg/mL or ng/mL) without comparability might have contributed to variability8, 9, which was also observed in the studies on adiponectin. Thus, standardization of the analysis, and reports on ficolin‐3, adiponectin and other biomarkers is particularly important for the future studies on GDM.
The relationships between adipokines and GDM have been widely studied in the past 10 years. The available studies contributed relatively inconsistent results across different populations. Among these adipokines, it is widely accepted that the upregulation of visfatin and leptin, and the downregulation of adiponectin might predict GDM during the first or early second trimester of pregnancy, whereas RBP‐4 and resistin show debatable results20, 21, 22. The present results confirmed previous prospective findings on the relationship between a lower concentration of adiponectin and GDM development23, 24. Increasing levels of RBP‐4 in the present study was significantly associated with the development of GDM consistent with a recent meta‐analysis report25. The report suggests that GDM patients only limited to Asian women show significantly higher circulating RBP‐4 levels than the participants. Prospective studies show that the alterations of lipid metabolism, especially serum triglyceride and FFAs, are correlated with neonatal growth and thus are significant predictors of fetal birthweight26, 27. However, the present study did not suggest that triglyceride and FFAs during the early second trimester of pregnancy had a relationship to birthweight. Using a single biomarker to predict GDM, it is difficult to obtain the high sensitivity and specificity simultaneously16, 28. Here, we provided the ratio between elevated biomarkers and reduced adiponectin (RBP‐4/adiponectin and ficolin‐3/adiponectin), which might enhance the performance of the screening tests for GDM.
In addition, some limitations of the current prospective study should also be mentioned. First, we excluded a certain number of participants, those with no blood samples at 16–18 weeks of gestation and unknown outcome of pregnancy, which can contribute to a statistical bias. We could not exclude some participants in the study who might have had undiagnosed diabetes in early pregnancy. Second, the present study lacked well‐matched control participants to GDM patients with regard to maternal age and body mass index. Also, unmeasured variables might result in confounding, even after controlling for the potential confounders. Finally, the present study also lacked the levels of those biomarkers during pre‐ and early pregnancy, and thus cannot establish whether some alterations were observed before pregnancy or during the first trimester of gestation. Therefore, to further identify the development of ficolin‐3 and other variables levels in a longer observation period of pregnancy and to investigate their predictive value in GDM, better designed prospective cohort studies with larger populations will be crucial.
In summary, we showed that a high ratio of ficolin‐3/adiponectin in maternal serum at 16–18 weeks of gestation is an alternative early screening method for GDM.
Disclosure
The authors declare no conflict of interest.
Acknowledgments
This study was funded by Changzhou Municipal Bureau of Science And technology (no. CJ20130041 and CJ20159055). The funders did not play a role in study design, samples collection and analysis, date statistics or manuscript preparation.
J Diabetes Investig 2018;9: 403–410
References
- 1. Zhu Y, Zhang C. Prevalence of Gestational Diabetes and Risk of Progression to Type 2 Diabetes: a Global Perspective. Curr Diab Rep 2016; 16: 7. [DOI] [PMC free article] [PubMed] [Google Scholar]
- 2. Correa PJ, Vargas JF, Sen S, et al Prediction of gestational diabetes early in pregnancy: targeting the long‐term complications. Gynecol Obstet Investig 2014; 77: 145–149. [DOI] [PubMed] [Google Scholar]
- 3. Abell SK, Courten BD, Boyle JA, et al Inflammatory and Other Biomarkers: role in Pathophysiology and Prediction of Gestational Diabetes Mellitus. Int J Mol Sci 2015; 16: 13442–13473. [DOI] [PMC free article] [PubMed] [Google Scholar]
- 4. Bao W, Baecker A, Song Y, et al Adipokine levels during the first or early second trimester of pregnancy and subsequent risk of gestational diabetes mellitus: a systematic review. Metabolism 2015; 64: 756–764. [DOI] [PMC free article] [PubMed] [Google Scholar]
- 5. Korkmazer E, Solak N. Correlation between inflammatory markers and insulin resistance in pregnancy. J Obstet Gynaecol 2015; 35: 142–145. [DOI] [PubMed] [Google Scholar]
- 6. Chen HB, Lu JX, Chen X, et al Low serum levels of the innate immune component ficolin‐3 is associated with insulin resistance and predicts the development of type 2 diabetes. J Mol Cell Biol 2012; 4: 256–257. [DOI] [PubMed] [Google Scholar]
- 7. Li RX, Chen HB, Tu K, et al Localized‐statistical quantification of human serum proteome associated with type 2 diabetes. PLoS One 2008; 3: e3224. [DOI] [PMC free article] [PubMed] [Google Scholar]
- 8. Zheng B, Li T, Chen H, et al Correlation between ficolin‐3 and vascular endothelial growth factor‐to‐pigment epithelium‐derived factor ratio in the vitreous of eyes with proliferative diabetic retinopathy. Am J Ophthalmol 2011; 152: 1039–1043. [DOI] [PubMed] [Google Scholar]
- 9. Zhang X, Hu Y, Shen J, et al Low levels of ficolin‐3 are associated with diabetic peripheral neuropathy. Acta Diabetol 2016; 53: 295–302. [DOI] [PubMed] [Google Scholar]
- 10. Zhao C, Wang F, Wang P, et al Early second‐trimester plasma protein profiling using multiplexed isobaric tandem mass tag (TMT) labeling predicts gestational diabetes mellitus. Acta Diabetol 2015; 52: 1103–1112. [DOI] [PubMed] [Google Scholar]
- 11. Halmos A, Rigo J, Szijarto J Jr, et al Circulating ficolin‐2 and ficolin‐3 in normal pregnancy and pre‐eclampsia. Clin Exp Immunol 2012; 169: 49–56. [DOI] [PMC free article] [PubMed] [Google Scholar]
- 12. Li S, Shin HJ, Ding EL, et al Adiponectin levels and risk of type 2 diabetes: a systematic review and met analysis. JAMA 2009; 302: 179–188. [DOI] [PubMed] [Google Scholar]
- 13. Zhang Y, Zhang HH, Lu JH, et al Changes in serum adipocyte fatty acid‐binding protein in women with gestational diabetes mellitus and normal pregnant women during mid‐and late pregnancy. J Diabetes Investig 2016; 7: 797–804. [DOI] [PMC free article] [PubMed] [Google Scholar]
- 14. Fasshauer M, Blüher M, Stumvoll M. Adipokines in gestational diabetes. Lancet Diabetes Endocrinol 2014; 2: 488–499. [DOI] [PubMed] [Google Scholar]
- 15. Paradisi G, Ianniello F, Tomei C, et al Longitudinal changes of adiponectin, carbohydrate and lipid metabolism in pregnant women at high risk for gestational diabetes. Gynecol Endocrinol 2010; 26: 539–545. [DOI] [PubMed] [Google Scholar]
- 16. Savvidou M, Nelson SM, Makgoba M, et al First trimester prediction of gestational diabetes mellitus: examining the potential of combining maternal characteristics and laboratory measures. Diabetes 2010; 59: 3017–3022. [DOI] [PMC free article] [PubMed] [Google Scholar]
- 17. Metzger BE, Gabbe SG, Persson B, et al International association of diabetes and pregnancy study groups recommendations on the diagnosis and classification of hyperglycemia in pregnancy. Diabetes Care 2010; 33: 676–682. [DOI] [PMC free article] [PubMed] [Google Scholar]
- 18. Ghosh P, Sahoo R, Vaidya A, et al Role of complement and complement regulatory proteins in the complications of diabetes. Endocr Rev 2015; 36: 272–288. [DOI] [PMC free article] [PubMed] [Google Scholar]
- 19. Derzsy Z, Prohaszka Z, Rigo J Jr, et al Activation of the complement system in normal pregnancy and preeclampsia. Mol Immunol 2010; 47: 1500–1506. [DOI] [PubMed] [Google Scholar]
- 20. Ferreira AF, Rezende JC, Vaikousi E, et al Maternal serum visfatin at 11–13 weeks of gestation in gestational diabetes mellitus. Clin Chem 2011; 57: 609–613. [DOI] [PubMed] [Google Scholar]
- 21. Nanda S, Poon LC, Muhaisen M, et al Maternal serum resistin at 11 to 13 weeks’ gestation in normal and pathological pregnancies. Metab, Clin Exp 2012; 61: 699–705. [DOI] [PubMed] [Google Scholar]
- 22. McManus R, Summers K, de Vrijer B, et al Maternal, umbilical arterial and umbilical venous 25‐hydroxyvitamin d and adipocytokine concentrations in pregnancies with and without gestational diabetes. Clin Endocrinol (Oxf) 2014; 80: 635–641. [DOI] [PubMed] [Google Scholar]
- 23. Ianniello F, Quagliozzi L, Caruso A, et al Low adiponectin in overweight/obese women: association with diabetes during pregnancy. Eur Rev Med Pharmacol Sci 2013; 17: 3197–3205. [PubMed] [Google Scholar]
- 24. Lacroix M, Battista MC, Doyon M, et al Lower adiponectin levels at first trimester of pregnancy are associated with increased insulin resistance and higher risk of developing gestational diabetes mellitus. Diabetes Care 2013; 36: 1577–1583. [DOI] [PMC free article] [PubMed] [Google Scholar]
- 25. Huang QT, Huang Q, Luo W, et al Circulating retinol‐binding protein 4 levels in gestational diabetes mellitus: a meta‐analysis of observational studies. Gynecol Endocrinol 2015; 31: 337–344. [DOI] [PubMed] [Google Scholar]
- 26. Herrera E, Ortega‐Senovilla H. Lipid metabolism during pregnancy and its implications for fetal growth. Curr Pharm Biotechnol 2014; 15: 24–31. [DOI] [PubMed] [Google Scholar]
- 27. Schaefer‐Graf UM, Graf K, Kulbacka I, et al Maternal lipids as strong determinants of fetal environment and growth in pregnancies with gestational diabetes mellitus. Diabetes Care 2008; 31: 1858–1863. [DOI] [PMC free article] [PubMed] [Google Scholar]
- 28. Kane SC, da Silva Costa F, Brennecke S. First trimester biomarkers in the prediction of later pregnancy complications. BioMed Re Int 2014; 2014: 807196. [DOI] [PMC free article] [PubMed] [Google Scholar]