

Abstract
Aims/Introduction
The aim of the present study was to evaluate the efficacy and safety of ipragliflozin in treating Japanese type 2 diabetes patients with inadequate glycemic control by investigating diurnal variations of blood glucose and body composition.
Materials and Methods
This was an investigator‐initiated, multicenter, prospective study with a 6‐month treatment period. The primary outcome investigated was change in hemoglobin A1c levels from baseline. Secondary outcomes included changes in fasting plasma glucose, insulin resistance, variations in 24‐h glucose levels detected by continuous glucose monitoring, bodyweight, body composition, waist circumference and serum lipids. Adverse events were evaluated throughout the study.
Results
A total of 98 patients completed the study. Over the 6‐month period, ipragliflozin‐treated patients showed reduction in hemoglobin A1c levels by 0.3%, fasting plasma glucose levels by 13.0 mg/dL, bodyweight by 2.1 kg, body fat mass by 1.5 kg and extracellular water by 0.3 kg, as well as a decrease in systolic/diastolic blood pressures. Significant reductions from baseline in mean amplitude of glucose excursions and standard deviation, and the reduced frequency of hyperglycemia were confirmed. High‐density lipoprotein cholesterol was also significantly improved. Notably, the subgroup analysis of hemoglobin A1c levels, bodyweight, waist circumference, and body composition based on age, sex and body mass index showed similar reductions within each subgroup. The incidences of adverse events and adverse drug reactions were 20.0% and 1.0%, respectively, over the 6‐month period.
Conclusions
Ipragliflozin is a useful oral antidiabetic medication for patients with a wide range of background characteristics.
Keywords: Continuous glucose monitoring, Sodium–glucose cotransporter 2 inhibitor, Type 2 diabetes mellitus
Introduction
Sodium–glucose cotransporter 2 (SGLT2) inhibitors lower blood glucose independent of insulin action in patients with type 2 diabetes mellitus by facilitating the excretion of glucose into the urine, resulting in reduction in bodyweight because of urinary calorie loss1, 2. As the mechanism of action of SGLT2 inhibitors involves neither interference with endogenous glucose production in response to hypoglycemia, nor insulin release, SGLT2 inhibitors provide benefits, such as a lower risk of hypoglycemia, when used as a monotherapy or in combination with other oral antidiabetic medications (OAMs) that have different mechanisms of action3, 4, 5. Furthermore, a recent study has shown that SGLT2 inhibitors are associated with reduced rates of death from cardiovascular causes (38% relative risk reduction), hospitalization for heart failure (35%) and death from any cause (32%)6, suggesting a possible anti‐atherosclerotic effect.
Ipragliflozin is the first SGLT2 inhibitor to be approved for the treatment of patients with type 2 diabetes mellitus in Japan, as monotherapy or in combination with other OAM. Previous randomized placebo‐controlled studies have shown that administration of ipragliflozin to patients with type 2 diabetes mellitus improved glycemic control and had low rates of adverse events7, 8, 9, 10, 11. Although treatment with SGLT2 inhibitors has been recommended for patients with type 2 diabetes mellitus who are relatively young and obese in daily clinical practice in Japan, the efficacy and safety of ipragliflozin for elderly or non‐obese patients are less clear12, and there is a need to evaluate the drug based on patient background in a clinical setting. Furthermore, just a few studies that examined the impact of ipragliflozin as add‐on therapy to other OAM on 24‐h blood glucose profiles have been reported so far13, 14.
The present study aimed to evaluate the efficacy and safety of ipragliflozin as monotherapy or as add‐on therapy to other OAM in Japanese type 2 diabetes mellitus patients with inadequate glycemic control by measuring diurnal variations in blood glucose and body composition. Our objective was to show the clinical features of patients in whom ipragliflozin induces favorable effects on glycemic control, body composition and other metabolic parameters.
Methods
Study design
This was a 6‐month, investigator‐initiated, open‐label, prospective intervention study carried out at Naka Kinen Clinic, Naka Kinen MITO Clinic, and Nakamoto Naika Clinic Medical Association in Japan to assess the efficacy and safety of ipragliflozin in Japanese patients with type 2 diabetes mellitus. The patients were prescribed 50 mg of ipragliflozin once daily before or after breakfast for 6 months. The clinical protocol was approved in May 2014 by the ethics committees of the participating centers, and designed in compliance with the principles embodied by the Declaration of Helsinki (2013). The study period was between June 2014 and December 2015. The present study was carried out in accordance with ethical guidelines for medical and health research involving human subjects (31 March 2015), as well as applicable local laws and regulations. All patients provided written informed consent before all procedures related to this study. This study is registered with UMIN‐CTR (UMIN000014306).
Study patients
Patients with type 2 diabetes mellitus aged ≥20 years at the time of consent, with a hemoglobin A1c (HbA1c) level ≥6.5% and ≤8.5%, and who were on a diet and exercise therapy or conventional antihyperglycemic therapy for >8 weeks, were eligible for the present study.
Exclusion criteria were as follows: type 1 diabetes mellitus or secondary diabetes caused by a pancreatic disorder, contraindications described in the package insert of ipragliflozin; severe renal dysfunction; patients with body mass index (BMI) <22 kg/m2; current use of insulin; glucagon‐like peptide‐1 analogs or SGLT2 inhibitors; women who are currently pregnant, breast‐feeding or of child‐bearing potential; or patients considered otherwise inappropriate to participate in the study by the principal investigator.
The concomitant medications that had been used before the study were continued for the entire 6‐month period without changing the dosage. Only α‐glucosidase inhibitors (α‐GI), biguanides (BG) and dipeptidyl peptidase 4 inhibitors (DPP‐4i) were selected as concomitant OAM, which have little influence on bodyweight or fluid balance.
Efficacy and safety outcomes
The primary outcome investigated over 6 months was the change in HbA1c levels from baseline. The iPro™ 2 (Medtronic, Northridge, CA, USA) continuous glucose monitoring (CGM) devices were used for 3 days to monitor subcutaneous glucose levels at 5‐min intervals, in order to determine and compare glycemic control on day 0 and at the end of month 3. The primary outcome was also evaluated by stratifying patients according to sex, age (<65 or ≥65 years), BMI (<25 kg/m2 or ≥25 kg/m2) and OAM (ipragliflozin as monotherapy or as add‐on therapy to α‐GI, BG, DPP‐4i, α‐GI + BG, DPP‐4i + BG and α‐GI + DPP‐4i).
Key secondary outcomes included changes from baseline in body composition (body fat mass, extracellular water, intracellular water, protein levels and minerals), total bodyweight, waist circumference, serum lipids, fasting plasma glucose (FPG), homeostasis model assessment‐estimated insulin resistance (HOMA‐IR) index and other clinical laboratory tests. Bodyweight and body composition were measured using the INBODY3.2 body composition analyzer (InBody Japan Inc., Tokyo, Japan). Body composition was also evaluated by stratifying patients in the same way described above.
Safety outcomes studied were adverse events (AEs), adverse drug reactions, vital signs, laboratory tests and bodyweight, which were recorded throughout the study. AEs were reported in terms of the preferred term according to MedDRA version 19.0 (The International Conference on Harmonisation of Technical Requirements for Registration of Pharmaceuticals for Human Use [ICH], Geneva, Switzerland), and classified in terms of severity, seriousness and causal relationship to the study drug.
Statistical analysis
Efficacy variables were analyzed in 98 patients after excluding two patients because of study discontinuation. The safety analysis set included all patients who started treatment, except those who did not receive the study medication or those for whom safety data were not collected after treatment initiation. Efficacy variables were presented descriptively as changes over time in terms of the mean ± standard deviation (SD). The skewness and kurtosis were measured for the degree of symmetry and the degree of peakedness in the variable distributions of frequency histograms. For graphic presentation of changes from baseline in HbA1c levels and body composition over the 6‐month treatment period, the Dunnett–Hsu multiple comparison method was used to determine changes from baseline to those various time‐points within a stratum. The subgroup analysis was carried out by using a mixed‐effects model for repeated‐measurement (MMRM) analysis, with treatment period and the variables (sex, age or BMI) as the fixed effect, baseline measurement as a covariate, and treatment period × classification variable interaction. As for the subgroup analysis of age and BMI, age was stratified into <65 years and ≥65 years, and BMI was stratified into <25 kg/m2 and ≥25 kg/m2.
All statistical analyses were carried out using SAS® version 9.4 (SAS Institute Inc., Cary, NC, USA). All tests for significance were two‐sided, and the level of significance was set as P < 0.05.
Results
Patients
A total of 100 patients were enrolled in the study. Of these, two patients were withdrawn because of treatment‐related AE and consent withdrawal, and they were excluded from the full analysis set. The remaining 98 patients were evaluated for efficacy. The safety analysis set consisted of all 100 patients. Patient demographics and baseline characteristics are summarized in Table 1. Overall, 52 patients were men and the rest were women, mean age was 59.9 years (63.0% <65 years, 37.0% ≥65 years) and mean duration of diabetes was 6.5 years. At baseline, the mean HbA1c level was 7.2 ± 0.6% and mean FPG level was 137.3 mg/dL, which were definitely lower values as compared with those values obtained from previous studies7, 10, 15, 16, 17. The mean bodyweight was 66.2 kg and mean BMI was 26.1 kg/m2, with 56.0% of patients classified as obese (BMI ≥ 25 kg/m2) according to the definition of obesity and visceral fat obesity in Japan18. The following OAMs were being concomitantly given to patients during the treatment period: α‐GI (16.0%), BG (15.0%), DPP‐4i (15.0%), α‐GI + BG (15.0%), DPP‐4i + BG (10.0%) and α‐GI + DPP‐4i (7.0%). The remaining 22% of study patients were drug‐naive. The percentage of patients with hypertension was 57.0%, and the percentage of patients with dyslipidemia was 76.0%.
Table 1.
Baseline patient characteristics
| Variable | |
|---|---|
| Sex (male/female) | 52/48 |
| Age (years) | 59.9 ± 9.4 |
| <65, n (%) | 63 (63.0) |
| ≥65, n (%) | 37 (37.0) |
| HbA1c (%) | 7.2 ± 0.6 |
| FPG (mg/dL) | 137.3 ± 26.2 |
| TBW (kg) | 66.2 ± 11.1 |
| BMI (kg/m2) | 26.1 ± 2.9 |
| <25 kg/m2, n (%) | 44 (44.0) |
| ≥25 kg/m2, n (%) | 56 (56.0) |
| WC (cm) | 92.5 ± 7.6 |
| Duration of T2DM (years) | 6.5 ± 4.6 |
| Antidiabetic treatment, n (%) | |
| Drug‐naive | 22 (22.0) |
| α‐GI | 16 (16.0) |
| Biguanides | 15 (15.0) |
| DPP4i | 15 (15.0) |
| α‐GI and biguanides | 15 (15.0) |
| DPP4i and biguanides | 10 (10.0) |
| α‐GI and DPP4i | 7 (7.0) |
| Diabetic complications, n (%) | |
| Retinopathy | 17 (17.0) |
| Nephropathy | 11 (11.0) |
| Neuropathy | 9 (9.0) |
| Non‐diabetic complications, n (%) | |
| Hypertension | 57 (57.0) |
| Dyslipidemia | 76 (76.0) |
The number of patients was 100, except for waist circumference (WC; n = 99). Values are shown as n (%) or mean ± standard deviation. α‐GI, α‐glucosidase inhibitors; BMI, body mass index; DPP4i, dipeptidyl peptidase 4 inhibitors; FPG, fasting plasma glucose; HbA1c, hemoglobin A1c; SD, standard deviation; TBW, total body weight; T2DM, type 2 diabetes mellitus; WC, waist circumference.
Efficacy
Glycemic efficacy end‐points
Changes in glycemic control from baseline to the end of the treatment period are shown in Figure 1. As shown in Figure 1a, the mean HbA1c level gradually decreased until month 3, and was sustained at this lower level until month 6, resulting in an overall change of −0.3 ± 0.5% (mean ± SD) from baseline (P < 0.001). Figure 1b,c show the time‐course of the mean FPG and HOMA‐IR levels. By month 6, the FPG level was significantly less than the baseline level (P < 0.001). HOMA‐IR value also decreased significantly from baseline to month 6 (P < 0.01).
Figure 1.

Effects of ipragliflozin on the time‐course of changes in glycemic control. Mean changes from baseline in (a) hemoglobin A1c (HbA1c) levels (%; n = 98) and (b) fasting plasma glucose (FPG) levels (mg/dL; n = 98). (c) The columns represent the homeostasis model assessment‐insulin resistance (HOMA‐IR) before/after 6 months of ipragliflozin administration (n = 97). Data are expressed as mean ± standard deviation. P‐values denote differences between baseline data and month 1, 3, and 6 data. ***P < 0.001; **P < 0.01.
Mean 24‐h glucose levels determined by CGM at baseline and after 3 months of treatment with ipragliflozin are shown in Figure 2a, and the CGM‐derived indices are also shown. The 3‐month administration of ipragliflozin resulted in lower mean plasma glucose levels throughout the day, as well as lower preprandial (before each meal) and midnight (Figure 2a) levels. The 24‐h mean glucose level was reduced from 160.75 mg/dL at baseline to 146.33 mg/dL by the end of the study (P < 0.001; n = 82). In addition, daily glucose fluctuations for mean amplitude of glucose excursion (MAGE) and for SD also decreased from 90.3 mg/dL to 78.1 mg/dL, and from 35.9 mg/dL to 30.9 mg/dL respectively (P < 0.001; n = 82). The proportion of time spent in the ≥70 to <140 mg/dL blood glucose range increased from 40.7% to 51.5%, whereas the proportions of time spent in the ≥140 and <70 mg/dL blood glucose ranges decreased from 58.5% to 47.8%, and from 0.9% to 0.7%, respectively (Figure 2b). The frequency histograms of blood glucose levels, generated by CGM data obtained at baseline and after 3 months of treatment with ipragliflozin, showed that the peak and distribution of the histogram pattern shifted to the left, and that ipragliflozin as add‐on therapy decreased the frequency of hyperglycemia when compared with prior therapy (Figure 2c). Furthermore, the skewness and kurtosis for histogram shapes derived from before/after treatment with ipragliflozin were determined. The 3‐month administration of ipragliflozin increased skewness and kurtosis from 1.03 to 1.51 and from 1.30 to 4.08, respectively (Figure 2c).
Figure 2.
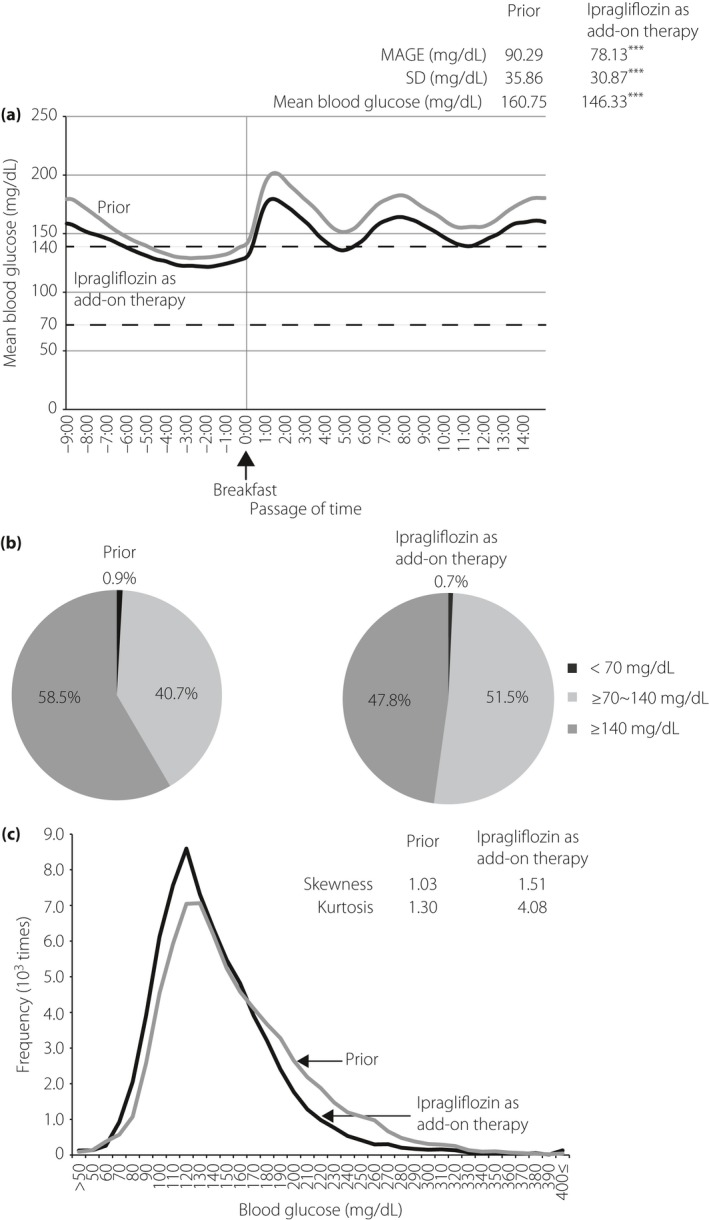
(a) Mean 24‐h glucose levels measured by continuous glucose monitoring before/after 3 months of ipragliflozin administration (n = 82). The black and gray lines indicate ipragliflozin as add‐on therapy and prior therapy without ipragliflozin, respectively. The start time to eat breakfast is represented as 0:00 (arrow). The optimal glycemic range (70–140 mg/dL) is shown as dashed lines. Mean amplitude of glycemic excursion (MAGE), standard deviation (SD) and mean blood glucose are summarized in the upper right. ***P < 0.001. (b) The proportions of time spent at glucose level <70 mg/dL, ≥70 to <140 mg/dL and ≥140 mg/dL before/after 3 months of ipragliflozin administration. The frequency histograms of continuous glucose monitoring data derived from prior therapy (gray line) and add‐on therapy (black line) are shown (c). The x‐ and y‐axes show the blood glucose level of patients and its frequency. The skewness and kurtosis before/after 3 months of ipragliflozin administration are shown in the upper right.
Subgroup analysis of glycemic controls
To investigate the impact of clinical features on the efficacy of glycemic control, the change from baseline in HbA1c levels was analyzed after stratifying data by patient background parameters including sex, age, BMI and OAM. The subgroup analysis showed similar decrements in HbA1c levels for all groups (Figure 3a–c; data not shown for OAM). No significant differences in the measured baseline HbA1c level were found among the subgroups: sex (P = 0.07), age (P = 0.89), BMI (P = 0.60) and OAM (P = 0.57). To compare the time‐dependent reduction in HbA1c levels induced by ipragliflozin among the subgroups of age, sex and BMI over the duration of the study period, we carried out a MMRM analysis by using the baseline HbA1c level as a covariate. Significant levels of interaction were found for sex (P < 0.05), but not for age and BMI. As for the subgroup analysis of OAM, the degree of HbA1c reduction by ipragliflozin monotherapy was comparable with other OAMs (α‐GI, BG, DPP‐4i, α‐GI + BG, α‐GI + DPP‐4i, BG + DPP‐4i; data not shown). Significant differences in HOMA‐IR were observed between groups based on BMI (P < 0.01; Figure 3d) and OAM (BG vs α‐GI + BG; P < 0.05; data not shown).
Figure 3.
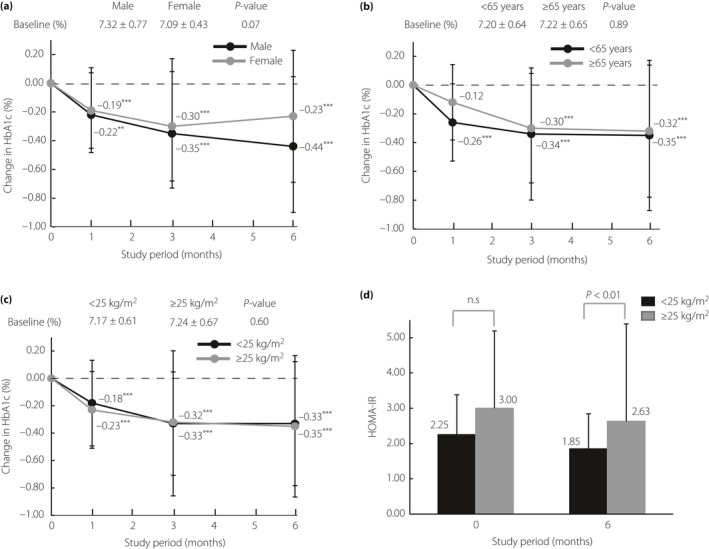
Changes in hemoglobin A1c (HbA1c) level (%) from baseline to month 6 in patients stratified by (a) sex (male: n = 51; female: n = 47), (b) age (<65 years: n = 62; ≥65: n = 36) and (c) baseline body mass index (<25 kg/m2: n = 50; ≥25 kg/m2: n = 48) are shown. The Dunnett–Hsu multiple comparison test was used to compare time‐points with those measured at baseline within a stratum. P‐values denote differences between baseline data and month 1, 3 or 6 data. ***P < 0.001; **P < 0.01. (d) Mean changes in homeostasis model assessment‐insulin resistance (HOMA‐IR). The data are shown as means and standard deviations, and a significant difference was confirmed between <25 kg/m2 (n = 49) and ≥25 kg/m2 (n = 48) subgroups at month 6. NS, not significant.
The mean changes in MAGE, SD, and mean blood glucose before and after administration of ipragliflozin as monotherapy or as add‐on therapy to other OAM are summarized in Table 2. Although administration of ipragliflozin as monotherapy reduced MAGE, SD and mean blood glucose, a significant difference was only found for mean blood glucose (P < 0.01). Compared with MAGE and SD obtained from patients using ipragliflozin as monotherapy, greater reductions for MAGE and SD were observed in patients treated with dual therapy of ipragliflozin with BG, α‐GI or DPP‐4i, and triple therapy of ipragliflozin with α‐GI + BG or α‐GI + DPP‐4i. The reductions in MAGE and SD from the baseline values tended to be smaller in the triple therapy of ipragliflozin in addition to BG + DPP‐4i compared with the other triple and dual therapies.
Table 2.
Changes in mean amplitude of glycemic excursion, standard deviation and mean blood glucose levels before/after ipragliflozin treatment
| Treatment | MAGE (mg/dL) | SD (mg/dL) | Mean blood glucose levels (mg/dL) | |||
|---|---|---|---|---|---|---|
| Baseline | Treatment | Baseline | Treatment | Baseline | Treatment | |
| Monotherapy | ||||||
| Naive → IPR (n = 17) | 99.3 ± 23.9 | 94.5 ± 25.9 | 39.9 ± 9.1 | 37.6 ± 11.5 | 165.5 ± 33.3 | 149.4 ± 30.0** |
| Change from baseline | –4.8 (–18.3, 8.6) | –2.3 (–8.2, 3.7) | –16.1 (–27.3, –5.0) | |||
| Dual therapy | ||||||
| BG → BG + IPR (n = 14) | 98.7 ± 30.1 | 83.4 ± 24.3 | 39.8 ± 11.3 | 33.0 ± 10.0* | 169.5 ± 48.1 | 151.3 ± 21.6 |
| Change from baseline | –15.3 (–31.0, 0.4) | –6.8 (–12.9, –0.8) | –18.2 (–39.7, 3.3) | |||
| α‐GI → α‐GI + IPR (n = 13) | 87.0 ± 32.0 | 67.2 ± 25.6* | 34.7 ± 12.9 | 26.8 ± 8.8* | 153.4 ± 32.2 | 139.0 ± 23.3** |
| Change from baseline | –19.8 (–36.5, –3.1) | –7.9 (–13.6, –2.2) | –14.4 (–24.3, –4.5) | |||
| DPP4i → DPP4i + IPR (n = 12) | 95.8 ± 30.2 | 81.6 ± 13.5 | 36.7 ± 11.3 | 32.1 ± 4.8 | 168.8 ± 36.8 | 143.1 ± 26.1** |
| Change from baseline | –14.2 (–35.5, 7.1) | –4.6 (–11.5, 2.3) | –25.7 (–42.5, –8.9) | |||
| Triple therapy | ||||||
| α‐GI + BG → α‐GI + BG + IPR (n = 12) | 82.5 ± 27.5 | 73.6 ± 22.3 | 32.5 ± 10.4 | 28.3 ± 8.9 | 155.4 ± 32.5 | 159.1 ± 60.0 |
| Change from baseline | −8.9 (−28.2, 10.3) | −4.1 (−10.9, 2.7) | 3.6 (−18.2, 25.4) | |||
| α‐GI + DPP4i → α‐GI + DPP4i + IPR (n = 7) | 80.0 ± 19.5 | 59.6 ± 17.1* | 31.7 ± 7.2 | 23.8 ± 6.0** | 153.9 ± 28.1 | 145.2 ± 21.4 |
| Change from baseline | −20.4 (−37.6, −3.1) | −7.9 (−12.5, −3.3) | −8.7 (−34.0, 16.7) | |||
| BG + DPP4i → BG + DPP4i + IPR (n = 7) | 71.8 ± 18.6 | 68.4 ± 18.2 | 28.8 ± 7.1 | 27.2 ± 4.6 | 147.5 ± 33.1 | 127.5 ± 16.5 |
| Change from baseline | −3.4 (−28.5, 21.7) | −1.6 (−8.8, 5.6) | −20.1 (−50.3, 10.1) | |||
**P < 0.01, *P < 0.05. Data are shown as mean value ± standard deviation. Changes from baseline are shown as the mean value (95% confidence interval). Paired t‐test was used for comparisons before and after ipragliflozin (IPR) treatment. α‐GI, α‐glucosidase inhibitors; BG, biguanides; DPP4i, dipeptidyl peptidase 4 inhibitors; MAGE, mean amplitude of glycemic excursion; SD, standard deviation.
Bodyweight, BMI, waist circumference and body composition
Mean bodyweight decreased over time, and the mean changes from baseline to month 1, 3, and 6 were −0.87 kg, −1.58 kg and −2.13 kg, respectively (P < 0.001; Figure 4a). By the end of the treatment period, waist circumference and BMI were reduced by 1.89 cm and 0.79 kg/m2, respectively (P < 0.001; Figure 4b,c). As for body composition, the mean reduction from baseline of extracellular water by month 1 was 0.49 kg (P < 0.001), which was the largest reduction among body composition measures (Figure 4d). By contrast, the largest reduction among body composition measures at month 3 and 6 was body fat mass, which reduced from baseline by 0.74 and 1.51 kg, respectively (P < 0.001). Although the extent of reduction of mineral level was lesser than that of body fat mass and extracellular water, it was nevertheless confirmed to be significant for the duration of the study period (Figure 4d). No significant reduction of protein levels was observed.
Figure 4.
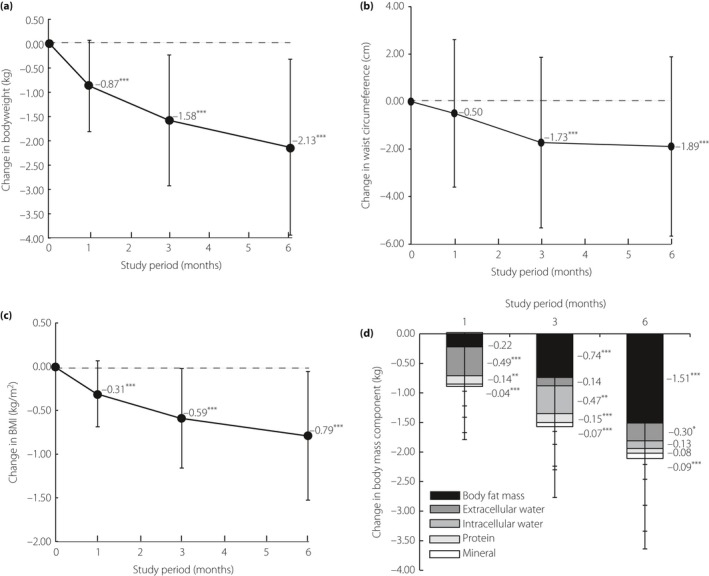
Changes in (a) bodyweight (n = 95), (b) waist circumference (n = 93), (c) body mass index (BMI; n = 95) and (d) body mass component (n = 95) over 6 months. The Dunnett–Hsu multiple comparison test was used to compare measurements at various time‐points with those at baseline within a stratum. P‐values denote differences between baseline data and month 1, 3 or 6 data. ***P < 0.001; **P < 0.01; *P < 0.05.
Subgroup analysis of bodyweight, waist circumference and body composition
Subgroup analysis of bodyweight, waist circumference, and body composition based on age, sex and BMI at the baseline were also carried out. Although significant differences for measured baseline values of bodyweight by age, sex and BMI were found, respectively (P < 0.01, P < 0.001, P < 0.001; Figure 5a,c,e), the MMRM analysis showed no significant differences in bodyweight from the baseline were found among the subgroups of age, sex and BMI during the study period. Significant differences in the measured baseline value of waist circumference according to BMI (P < 0.001), but not age and sex, were found (Figure 5b,d,f). The MMRM analysis, in which the baseline value of waist circumference was used as a covariate, showed that significant levels of interaction in waist circumference were found for sex (P < 0.05), but not in the subgroups of age and BMI.
Figure 5.
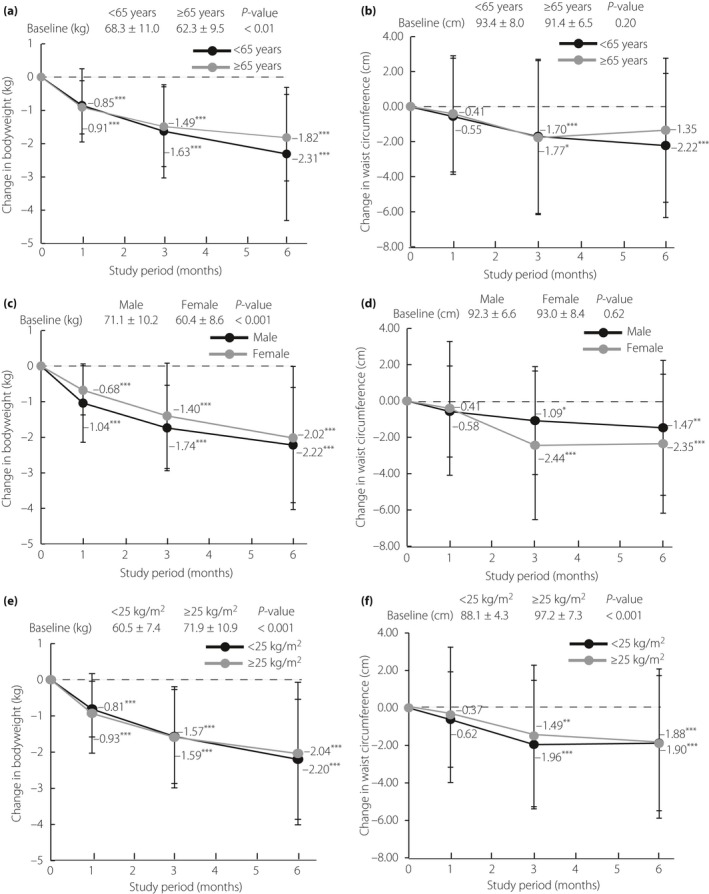
Changes in bodyweight and waist circumference from baseline by the end of treatment in patients, stratified by (a,b) age (<65 years: n = 58; ≥65 years: n = 35), (c,d) sex (male: n = 49; female: n = 44), (e,f) baseline body mass index (<25 kg/m2: n = 49; ≥25 kg/m2: n = 46 and <25 kg/m2: n = 47; ≥25 kg/m2: n = 46) are shown. The Dunnett–Hsu multiple comparison test was used to compare measurements at various time‐points with those at baseline within a stratum. P‐values denote differences between baseline data and month 1, 3 or 6 data. ***P < 0.001; **P < 0.01; *P < 0.05.
The results of the subgroup analyses of body composition are shown in Table 3. The MMRM analysis showed no significant levels of interaction between the subgroups of age, sex and BMI. In addition, significant differences for measured baseline values of intracellular water, protein and mineral by age were found, respectively (P < 0.05; data not shown).
Table 3.
Changes in body composition from baseline by the end of treatment in patients stratified by age, sex and baseline body mass index
| Body composition | n | Month 1 | Month 3 | Month 6 |
|---|---|---|---|---|
| Body fat mass (kg) | ||||
| <65 years | 59 | −0.18 ± 1.47 | −0.81 ± 1.71** | −1.55 ± 2.24*** |
| ≥65 years | 36 | −0.28 ± 1.44 | −0.63 ± 1.30* | −1.45 ± 1.97*** |
| Male | 50 | −0.37 ± 1.56 | −0.99 ± 1.31*** | −1.61 ± 1.82*** |
| Female | 45 | −0.05 ± 1.32 | −0.45 ± 1.77 | −1.40 ± 2.45** |
| <25 kg/m2 | 49 | −0.14 ± 1.62 | −0.80 ± 1.68** | −1.66 ± 2.44*** |
| ≥25 kg/m2 | 46 | −0.30 ± 1.26 | −0.67 ± 1.43** | −1.35 ± 1.76*** |
| Extracellular water (kg) | ||||
| <65 years | 59 | −0.48 ± 1.12** | −0.16 ± 1.51 | −0.29 ± 1.16 |
| ≥65 years | 36 | −0.51 ± 1.01* | −0.11 ± 1.07 | −0.33 ± 0.97 |
| Male | 50 | −0.51 ± 1.17** | −0.10 ± 1.62 | −0.17 ± 1.25 |
| Female | 45 | −0.47 ± 0.98** | −0.19 ± 1.00 | −0.45 ± 0.87** |
| <25 kg/m2 | 49 | −0.48 ± 1.15* | 0.08 ± 1.43 | −0.11 ± 1.00 |
| ≥25 kg/m2 | 46 | −0.49 ± 1.01** | −0.38 ± 1.24 | ‐0.51 ± 1.16* |
| Intracellular water (kg) | ||||
| <65 years | 59 | −0.01 ± 1.36 | −0.45 ± 1.54 | −0.27 ± 1.34 |
| ≥65 years | 36 | 0.06 ± 1.54 | −0.51 ± 1.21* | 0.09 ± 1.48 |
| Male | 50 | 0.03 ± 1.66 | −0.44 ± 1.65 | −0.26 ± 1.64 |
| Female | 45 | 0.00 ± 1.13 | −0.51 ± 1.11* | 0.01 ± 1.06 |
| <25 kg/m2 | 49 | 0.01 ± 1.52 | −0.63 ± 1.51* | −0.26 ± 1.41 |
| ≥25 kg/m2 | 46 | 0.02 ± 1.34 | −0.30 ± 1.31 | 0.00 ± 1.39 |
| Protein (kg) | ||||
| <65 years | 59 | −0.15 ± 0.35** | −0.14 ± 0.41* | −0.12 ± 0.46 |
| ≥65 years | 36 | −0.12 ± 0.40 | −0.16 ± 0.30** | −0.03 ± 0.39 |
| Male | 50 | −0.13 ± 0.41 | −0.11 ± 0.36 | −0.08 ± 0.43 |
| Female | 45 | −0.15 ± 0.33* | −0.19 ± 0.39** | −0.08 ± 0.46 |
| <25 kg/m2 | 49 | −0.15 ± 0.41* | −0.14 ± 0.41 | −0.06 ± 0.52 |
| ≥25 kg/m2 | 46 | −0.13 ± 0.32* | −0.16 ± 0.33** | −0.11 ± 0.33 |
| Mineral (kg) | ||||
| <65 years | 59 | −0.04 ± 0.08** | −0.07 ± 0.08*** | −0.10 ± 0.10*** |
| ≥65 years | 36 | −0.05 ± 0.08** | −0.07 ± 0.09*** | −0.07 ± 0.10*** |
| Male | 50 | −0.06 ± 0.08*** | −0.08 ± 0.08*** | −0.08 ± 0.11*** |
| Female | 45 | −0.02 ± 0.06 | −0.05 ± 0.09*** | −0.09 ± 0.10*** |
| <25 kg/m2 | 49 | −0.04 ± 0.08** | −0.06 ± 0.09*** | −0.09 ± 0.11*** |
| ≥25 kg/m2 | 46 | −0.05 ± 0.08*** | −0.08 ± 0.08*** | −0.08 ± 0.09*** |
Data are shown as mean ± standard deviation. The Dunnett–Hsu multiple comparison test was used to compare measurements at various time‐points with those at baseline within a stratum. ***P < 0.001, **P < 0.01, *P < 0.05. BMI, body mass index.
Safety
Vital signs and other laboratory tests
The mean changes in systolic blood pressure and diastolic blood pressure are shown in Table 4. The mean values were lower than baseline levels by 6.3 mmHg for systolic blood pressure and 3.8 mmHg for diastolic blood pressure by the end of 6 months (P < 0.001). The mean hematocrit levels increased significantly from baseline over 6 months of treatment (P < 0.001; Table 4).
Table 4.
Changes from baseline in mean blood pressure and laboratory test values over time
| Baseline | Month 1 | Month 3 | Month 6 | |
|---|---|---|---|---|
| SBP (mmHg) | 132.0 ± 15.0 |
126.8 ± 15.1*** (−5.2 ± 13.2) |
126.4 ± 15.1*** (−5.6 ± 13.4) |
125.7 ± 16.2*** (−6.3 ± 15.2) |
| DBP (mmHg) | 81.9 ± 9.7 |
78.8 ± 9.5*** (−3.1 ± 7.0) |
78.7 ± 9.9*** (−3.2 ± 8.0) |
78.1 ± 9.8*** (−3.8 ± 9.5) |
| Hematocrit (%) | 41.6 ± 3.8 |
43.0 ± 3.9*** (1.5 ± 1.6) |
44.5 ± 3.9*** (3.0 ± 2.5) |
44.7 ± 3.4*** (3.2 ± 2.3) |
| Triglyceride (mg/dL) | 115.2 ± 62.0 |
115.2 ± 63.8 (0.0 ± 48.1) |
107.0 ± 53.3 (−8.2 ± 43.0) |
110.8 ± 59.5 (−4.4 ± 47.1) |
| FFA (μEq/L) | 0.60 ± 0.24 |
0.66 ± 0.23* (0.06 ± 0.21) |
0.61 ± 0.26 (0.01 ± 0.22) |
0.66 ± 0.26 (0.06 ± 0.24) |
| TC (mg/dL) | 184.4 ± 27.1 |
186.0 ± 33.2 (1.6 ± 24.6) |
187.8 ± 29.1 (3.5 ± 20.7) |
193.1 ± 30.1** (8.7 ± 23.5) |
| LDL‐C (mg/dL) | 103.8 ± 20.3 |
103.4 ± 25.1 (−0.4 ± 20.4) |
103.9 ± 24.0 (0.2 ± 18.3) |
106.1 ± 24.1 (2.3 ± 19.8) |
| HDL‐C (mg/dL) | 54.1 ± 13.4 |
55.4 ± 12.9 (1.3 ± 5.7) |
58.6 ± 15.1*** (4.5 ± 6.8) |
61.6 ± 15.1*** (7.5 ± 7.8) |
Data are shown as mean ± standard deviation. Dunnett's multiple comparison test was used for comparisons between data at various time‐points and baseline. ***P < 0.001, **P < 0.01, *P < 0.05. DBP, diastolic blood pressure; FFA, free fatty acid; HDL‐C, high‐density lipoprotein cholesterol; LDL‐C, low‐density lipoprotein cholesterol; SBP, systolic blood pressure; TC, total cholesterol.
No significant changes in plasma triglyceride levels, free fatty acid levels and low‐density lipoprotein cholesterol levels were observed for the duration of the study (Table 4). By contrast, the mean values of total cholesterol level and high‐density lipoprotein cholesterol level were significantly higher than baseline values by the end of 6 months (P < 0.01 and P < 0.001, respectively; Table 4).
AEs and adverse drug reactions
The number and incidence of AEs, adverse drug reactions, serious adverse events, and AEs resulting in study discontinuation are shown in Table 5. A total of 20 (20.0%) AEs and one (1.0%) adverse drug reaction – a rash – were reported in patients during the 6 months.
Table 5.
Summary of adverse events
| No. events | Incidence (%) | |
|---|---|---|
| All adverse events | 20 | 20.0 |
| Adverse events resulting in discontinuation of treatment | 1 | 1.0 |
| Adverse drug reactions | 1 | 1.0 |
| Rash | 1 | 1.0 |
| Adverse events resulting in hospitalization | 0 | 0.0 |
| Serious adverse events | 0 | 0.0 |
| Deaths | 0 | 0.0 |
| Adverse events | ||
| Allergic rhinitis | 2 | 2.0 |
| Xeroderma | 2 | 2.0 |
| Acute upper respiratory inflammation | 2 | 2.0 |
| Shoulder periarthritis | 2 | 2.0 |
| Eczema | 2 | 2.0 |
| Tinea pedis | 2 | 2.0 |
| Common cold | 1 | 1.0 |
| Muscle‐contraction headache | 1 | 1.0 |
| Hematuria | 1 | 1.0 |
| Prostate cancer | 1 | 1.0 |
| Rash | 1 | 1.0 |
| Nasal furuncle | 1 | 1.0 |
| Chronic bronchitis | 1 | 1.0 |
| Allergic conjunctivitis | 1 | 1.0 |
Total n = 100.
Discussion
The present study showed that ipragliflozin as monotherapy or as add‐on therapy with other OAM, such as BG, α‐GI and DPP‐4i, improved HbA1c, FPG and 24‐h glucose profiles. We also observed significant improvements in bodyweight, waist circumference, blood pressures and high‐density lipoprotein cholesterol. Of note, body composition analysis showed that the majority of weight loss corresponded to extracellular water loss at the initial phase of treatment, and body fat mass loss at a later phase of treatment. Furthermore, the subgroup analyses of glycemic control, bodyweight, waist circumference, and body composition showed comparable efficacies between subgroups of age and baseline BMI. These results suggest similar efficacy of ipragliflozin in a wide range of Japanese patients with type 2 diabetes mellitus irrespective of their backgrounds, and provide physicians with a viable choice for add‐on therapy in patients with inadequate glycemic control.
Of note, the characteristics of our patients differed from previous ipragliflozin phase 2 and phase 3 clinical studies, in that baseline HbA1c level was lower by approximately 1.0% and the duration of type 2 diabetes mellitus was relatively shorter8, 11, 16, 17, 18. This was because we intended to evaluate the efficacy of ipragliflozin on body composition, excluding the influence of those patients who had high glucose excretion because of poor glycemic control before administration of ipragliflozin. Subgroup analysis of HbA1c levels in terms of background characteristics including age, sex, baseline BMI and OAMs used in add‐on therapy showed similar degrees of reduction from baseline levels. However, a significant difference for the time‐dependent reduction of HbA1c level between the subgroup of sex was confirmed, implying that there might be differences of sex for the efficacy of ipragliflozin on glycemic control in clinical practice. Further study is required to clarify the hypothesis.
In contrast to the large number of previous studies evaluating the efficacy of ipragliflozin by monitoring HbA1c or FPG levels7, 8, 9, 10, 11, only a limited number of studies have reported 24‐h glucose profiles in the evaluation of ipragliflozin efficacy in improving glycemic control13, 14. Likewise, as for other SGLT2 inhibitors, only a small number of clinical studies using CGM devices to investigate the effect of luseogliflozin19, 20, 21 or sotagliflozin22 on 24‐h glucose profiles have been reported thus far. Further CGM‐based studies of ipragliflozin in patients with type 2 diabetes mellitus are required to clarify peak glucose, lowest glucose, and 24‐h mean glucose levels and their variations. To our knowledge, the present study is the first to evaluate the efficacy of longer‐term administration of ipragliflozin as add‐on therapy to other OAM throughout the day, when compared with previous studies20, 22, 23, 24, 25. Here, we have confirmed that ipragliflozin as monotherapy or as add‐on therapy to other OAM lowered the preprandial, postprandial and nocturnal glucose excursions. In addition, the proportion of time spent with glucose levels are in the range ≥70 to <140 mg/dL increased, whereas the proportion of time spent with glucose levels are ≥140 mg/dL and <70 mg/dL decreased, showing a lowered risk of hypoglycemia. Notably, the reduction in blood glucose distribution width induced by ipragliflozin suggests that ipragliflozin reduces glucose spikes, the difference between maximum plasma glucose and fasting plasma glucose levels. Although Yamada et al.13, reported that ipragliflozin simultaneously lowered preprandial and postprandial glucose excursions in patients whose HbA1c level was higher than that of the present study or in patients treated with hypoglycemia‐inducible antidiabetic medications, the improvements in glucose spikes reported seem to be lower than in the present study. Taken together, the improvement of glucose spikes by monotherapy or add‐on therapy with ipragliflozin is thought to depend on baseline HbA1c level or the concomitant medications administered.
In contrast to sulfonylurea, insulin and thiazolidinediones that increase bodyweight23, 24, 25, ipragliflozin has been recognized to stimulate a beneficial reduction in bodyweight in previous studies7, 8, 9, 10, 11. In the present study as well, the administration of ipragliflozin resulted in a continuous reduction in bodyweight and BMI throughout the study period. Of note, our analysis on body composition was similar to previous observations showing the rapid initial decline in body water, and a subsequent gradual loss of body fat mass after the administration of dapagliflozin26 and ipragliflozin27, 28. Further analysis is required to investigate the mechanism behind the bodyweight reduction.
The fluid loss that occurred in the initial phase of treatment might be due to osmotic diuresis owing to urinary glucose excretion, resulting in an increase in the hematocrit, and suggesting the need for patients to drink more water. In addition, significant reductions in systolic blood pressure and diastolic blood pressure, by excluding those patients who were taking antihypertensive drugs, were observed by the end of the 6‐month study period (data not shown), and it is possible that osmotic diuresis is involved in the mechanism behind lowering blood pressure29. Although the loss of body water and protein, corresponding to the loss of muscle mass, was observed during the study period, no AEs such as dehydration and sarcopenia were reported, and only a rash in a single patient was reported as a drug adverse reaction. In addition, there were no episodes of AEs of special interest (hypoglycemia, urinary tract/genital infections and polyuria/pollakiuria), consistent with a previous report claiming the there are few cases of serious AEs resulting from SGLT2 inhibitors3, 4, 5. Overall, these results suggest that the administration of ipragliflozin once daily could be feasible for treating type 2 diabetes mellitus patients with a wide range of ages and BMI.
The present study had certain limitations. First, the lack of a comparator was a major issue in our evaluation. Second, the varying numbers of patients receiving different treatments (monotherapy or combination with other OAM) introduced problems into our analysis. Third, as previously discussed, the use of impedance methods does not provide information regarding the visceral fat area and subcutaneous fat area in body fat mass. Finally, the study deals only with BG, α‐GI and DPP‐4i as antidiabetic medications, but not sulfonyl urea, insulin or thiazolidinediones.
In conclusion, ipragliflozin as monotherapy or as add‐on therapy to other OAM could be useful for type 2 diabetes mellitus patients with poor glycemic control, whose HbA1c level is at approximately 7%, to avoid hypoglycemia and prevent glucose spikes.
Disclosure
One of the authors (TO) has received honoraria and travel expenses for speaking at an event organized by Astellas Pharma Inc. The sponsor had no role in study design, collection, analysis and interpretation of data, writing of the manuscript or the decision to submit the manuscript for publication. The other authors declare no conflict of interest.
Acknowledgment
This study was supported by a research grant from Astellas Pharma Inc. (Tokyo, Japan).
J Diabetes Investig 2018;9: 341–353
Clinical Trial Registry
University Hospital Medical Information Network Clinical Trials Registry
UMIN000014306
References
- 1. DeFronzo RA, Davidson JA, Del Prato S. The role of the kidneys in glucose homeostasis: a new path towards normalizing glycaemia. Diabetes Obes Metab 2012; 14: 5–14. [DOI] [PubMed] [Google Scholar]
- 2. Ferrannini E, Solini A. SGLT2 inhibition in diabetes mellitus: rationale and clinical prospects. Nat Rev Endocrinol 2012; 8: 495–502. [DOI] [PubMed] [Google Scholar]
- 3. Nauck MA. Update on developments with SGLT2 inhibitors in the management of type 2 diabetes. Drug Des Devel Ther 2014; 8: 1335–1380. [DOI] [PMC free article] [PubMed] [Google Scholar]
- 4. Fioretto P, Giaccari A, Sesti G. Efficacy and safety of dapagliflozin, a sodium glucose cotransporter 2 (SGLT2) inhibitor, in diabetes mellitus. Cardiovasc Diabetol 2015; 14: 142. [DOI] [PMC free article] [PubMed] [Google Scholar]
- 5. Hershon KS. Options for empagliflozin in combination therapy in type 2 diabetes mellitus. Int J Gen Med 2016; 9: 155–172. [DOI] [PMC free article] [PubMed] [Google Scholar]
- 6. Zinman B, Wanner C, Lachin JM, et al Empagliflozin, cardiovascular outcomes, and mortality in type 2 diabetes. N Engl J Med 2015; 373: 2117–2128. [DOI] [PubMed] [Google Scholar]
- 7. Kashiwagi A, Kazuta K, Yoshida S, et al Randomized, placebo‐controlled, double‐blind glycemic control trial of novel sodium‐dependent glucose cotransporter 2 inhibitor ipragliflozin in Japanese patients with type 2 diabetes mellitus. J Diabetes Investig 2014; 5: 382–391. [DOI] [PMC free article] [PubMed] [Google Scholar]
- 8. Kadokura T, Akiyama N, Kashiwagi A, et al Pharmacokinetic and pharmacodynamic study of ipragliflozin in Japanese patients with type 2 diabetes mellitus: a randomized, double‐blind, placebo‐controlled study. Diabetes Res Clin Pract 2014; 106: 50–56. [DOI] [PubMed] [Google Scholar]
- 9. Kashiwagi A, Takahashi H, Ishikawa H, et al A randomized, double‐blind, placebo‐controlled study on long‐term efficacy and safety of ipragliflozin treatment in patients with type 2 diabetes mellitus and renal impairment: results of the long‐term ASP1941 safety evaluation in patients with type 2 diabetes with renal impairment (LANTERN) study. Diabetes Obes Metab 2015; 17: 152–160. [DOI] [PMC free article] [PubMed] [Google Scholar]
- 10. Kashiwagi A, Kazuta K, Goto K, et al Ipragliflozin in combination with metformin for the treatment of Japanese patients with type 2 diabetes: ILLUMINATE, a randomized, double‐blind, placebo‐controlled study. Diabetes Obes Metab 2015; 17: 304–308. [DOI] [PMC free article] [PubMed] [Google Scholar]
- 11. Kashiwagi A, Yoshida S, Nakamura I, et al Efficacy and safety of ipragliflozin in Japanese patients with type 2 diabetes stratified by body mass index: a subgroup analysis of five randomized clinical trials. J Diabetes Investig 2016; 7: 544–554. [DOI] [PMC free article] [PubMed] [Google Scholar]
- 12. Terauchi Y, Yokote K, Nakamura I, et al Safety of ipragliflozin in elderly Japanese patients with type 2 diabetes mellitus (STELLA‐ELDER): interim results of a post‐marketing surveillance study. Expert Opin Pharmacother 2016; 17: 463–471. [DOI] [PubMed] [Google Scholar]
- 13. Yamada K, Nakayama H, Yoshinobu S, et al Effects of a sodium glucose co‐transporter 2 selective inhibitor, ipragliflozin, on the diurnal profile of plasma glucose in patients with type 2 diabetes: a study using continuous glucosemonitoring. J Diabetes Investig 2015; 6: 699–707. [DOI] [PMC free article] [PubMed] [Google Scholar]
- 14. Hayashi A, Takano K, Kawai S, et al SGLT2 inhibitors provide an effective therapeutic option for diabetes complicated with insulin antibodies. Endocr J 2016; 63: 187–191. [DOI] [PubMed] [Google Scholar]
- 15. Kashiwagi A, Kazuta K, Takinami Y, et al Ipragliflozin improves glycemic control in Japanese patients with type 2 diabetes mellitus: the BRIGHTEN study. Diabetol Int 2015; 6: 8–18. [Google Scholar]
- 16. Kashiwagi A, Shiga T, Akiyama N, et al Efficacy and safety of ipragliflozin as an add on to pioglitazone in Japanese patients with inadequately controlled type 2 diabetes: a randomized, double blind, placebo controlled study (the SPOTLIGHT study). Diabetol Int 2015; 6: 104–116. [Google Scholar]
- 17. Kashiwagi A, Akiyama N, Shiga T, et al Efficacy and safety of ipragliflozin as an add on to a sulfonylurea in Japanese patients with inadequately controlled type 2 diabetes: results of the randomized, placebo controlled, double blind, phase III EMIT study. Diabetol Int 2015; 6: 125–138. [Google Scholar]
- 18. Japan Society for the Study of Obesity . The examination committee of criteria for ‘Obesity Disease’ in Japan. New criteria for ‘Obesity Disease’ in Japan. Circ J 2002; 66: 987–992. [DOI] [PubMed] [Google Scholar]
- 19. Nishimura R, Osonoi T, Kanada S, et al Effects of luseogliflozin, a sodium‐glucose co‐transporter 2 inhibitor, on 24‐h glucose variability assessed by continuous glucose monitoring in Japanese patients with type 2 diabetes mellitus: a randomized, double‐blind, placebo‐controlled, crossover study. Diabetes Obes Metab 2015; 17: 800–804. [DOI] [PMC free article] [PubMed] [Google Scholar]
- 20. Nishimura R, Omiya H, Sugio K, et al Sodium‐glucose cotransporter 2 inhibitor luseogliflozin improves glycaemic control, assessed by continuous glucose monitoring, even on a low‐carbohydrate diet. Diabetes Obes Metab 2016; 18: 702–706. [DOI] [PMC free article] [PubMed] [Google Scholar]
- 21. Jinnouchi H, Nozaki K, Watase H, et al Impact of reduced renal function on the glucose‐lowering effects of luseogliflozin, a selective SGLT2 inhibitor, assessed by continuous glucose monitoring in Japanese patients with type 2 diabetes mellitus. Adv Ther 2016; 33: 460–479. [DOI] [PMC free article] [PubMed] [Google Scholar]
- 22. Sands AT, Zambrowicz BP, Rosenstock J, et al Sotagliflozin, a dual SGLT1 and SGLT2 inhibitor, as adjunct therapy to insulin in type 1 diabetes. Diabetes Care 2015; 38: 1181–1188. [DOI] [PMC free article] [PubMed] [Google Scholar]
- 23. Wilding J. Thiazolidinediones, insulin resistance and obesity: finding a balance. Int J Clin Pract 2006; 60: 1272–1280. [DOI] [PubMed] [Google Scholar]
- 24. Wilding JP. The importance of weight management in type 2 diabetes mellitus. Int J Clin Pract 2014; 68: 682–691. [DOI] [PMC free article] [PubMed] [Google Scholar]
- 25. Morgan CL, Jenkins‐Jones S, Evans M, et al Weight change in people with type 2 diabetes: secular trends and the impact of alternative antihyperglycaemic drugs. Diabetes Obes Metab 2012; 14: 424–432. [DOI] [PubMed] [Google Scholar]
- 26. Bolinder J, Ljunggren Ö, Kullberg J, et al Effects of dapagliflozin on body weight, total fat mass, and regional adipose tissue distribution in patients with type 2 diabetes mellitus with inadequate glycemic control on metformin. J Clin Endocrinol Metab 2012; 97: 1020–1031. [DOI] [PubMed] [Google Scholar]
- 27. Iizuka T, Iemitsu K, Takihata M, et al Efficacy and safety of ipragliflozin in Japanese patients with type 2 diabetes: interim outcome of the ASSIGN‐K study. J Clin Med Res 2016; 8: 116–125. [DOI] [PMC free article] [PubMed] [Google Scholar]
- 28. Yamamoto C, Miyoshi H, Ono K, et al Ipragliflozin effectively reduced visceral fat in Japanese patients with type 2 diabetes under adequate diet therapy. Endocr J 2016; 63: 589–596. [DOI] [PubMed] [Google Scholar]
- 29. Oliva RV, Bakris GL. Blood pressure effects of sodium‐glucose co‐transport 2 (SGLT2) inhibitors. J Am Soc Hypertens 2014; 8: 330–339. [DOI] [PubMed] [Google Scholar]