Abstract
Policy Points:
Per‐capita household health spending was higher in economically developed states and was associated with ability to pay, but catastrophic health spending (CHS) was equally high in both poorer and more developed states in India.
Based on multilevel modeling, we found that the largest geographic variation in health spending and CHS was at the state and village levels, reflecting wide inequality in the accessibility to and cost of health care at these levels.
Contextual factors at macro and micro political units are important to reduce health spending and CHS in India.
Context
In India, health care is a local good, and households are the major source of financing it. Earlier studies have examined diverse determinants of health care spending, but no attempt has been made to understand the geographical variation in household and catastrophic health spending. We used multilevel modeling to assess the relative importance of villages, districts, and states to health spending in India.
Methods
We used data on the health expenditures of 101,576 households collected in the consumption expenditure schedule (68th round) carried out by the National Sample Survey in 2011‐2012. We examined 4 dependent variables: per‐capita health spending (PHS), per‐capita institutional health spending (PIHS), per‐capita noninstitutional health spending (PNHS), and catastrophic health spending (CHS). CHS was defined as household health spending exceeding 40% of its capacity to pay. We used multilevel linear regression and logistic models to decompose the variation in each outcome by state, region, district, village, and household levels.
Findings
The average PHS was 1,331 Indian rupees (INR), which varied by state‐level economic development. About one‐fourth of Indian households incurred CHS, which was equally high in both the economically developed and poorer states. After controlling for household level factors, 77.1% of the total variation in PHS was attributable to households, 10.1% to states, 9.5% to villages, 2.6% to districts, and 0.7% to regions. The pattern in variance partitioning was similar for PNHS. The largest interstate variation was found for CHS (15.9%), while the opposite was true for PIHS (3.2%).
Conclusions
We observed substantial variations in household health spending at the state and village levels compared with India's districts and regions. The large variation in CHS attributable to states indicates interstate inequality in the accessibility to and cost of health care. Our findings suggest that contextual factors at the macro and micro political units are important to reduce India's household health spending and CHS.
Keywords: household health spending, catastrophic health spending, geographic variation, multilevel modeling, India
Increasing health care spending is a worldwide phenomenon and is associated with changes in technology, demography, income, the prevalence and incidence of noncommunicable diseases (NCDs), management of health care, and health insurance.1, 2, 3 Overall, global health spending accounted for 6% of gross domestic product (GDP) in 1995 and 7.1% in 2013 and is projected to be 9% by 2040.4 The per‐capita health spending (PHS) varies enormously between and within countries. In 2010, PHS was highest in the United States (US$8,362) and lowest in Eritrea (US$12). The association between health spending and health outcomes, such as life expectancy and the infant mortality rate, is complex and exhibits varying patterns across countries.5, 6 Evidence from 191 countries suggests that countries with a low level of PHS are associated with poorer health, while the contrary is true for countries with a higher level of PHS. Those in the middle range of health spending, however, do not show a clear pattern regarding health outcomes. Moreover, additional spending on health in already high‐spending contexts is associated with smaller improvement in health status.7
In developed countries, a publicly funded health system is largely responsible for health expenditures, whereas in developing countries, households account for the major share of health spending.3 A growing number of studies of developing countries suggest that the out‐of‐pocket expenditures (OOPE) on health care incurred by households is high and catastrophic, which in turn reduces the consumption of nonfood goods and access to care and increases untreated morbidity and the irrational use of drugs, especially for poor, rural, female‐headed households with elderly members.8, 9, 10, 11, 12
Given India's current demographic, epidemiologic, and economic transitions, health financing has assumed great importance. In the post–National Health Mission (NHM) period, the country is nearing replacement level of fertility, has steadily increased longevity, and has significantly reduced infant and child mortality. India's total fertility rate fell from 5.2 in 1971 to 2.3 in 2014, and life expectancy at birth increased from 49.7 years in 1973 to 67.9 years in 2012.13, 14 The country's economic growth has been steady, and the percentage of people living below the poverty line has fallen by half over the past two decades.15 Against this backdrop, the health financing transition theory that predicts an increase in public spending and a reduction in OOPE in the coming years has larger relevance in India.3
Currently, health spending accounts for about 4% of India's GDP, while public spending on health accounts for only 1% of GDP.16 The OOPE has remained the main source of financing for health care over time (71% in 2004 and 69% in 2014).17, 18 PHS is growing twice as fast as the per‐capita consumption expenditure, which is a measure of households’ overall economic well‐being.19 With the low level of insurance coverage, household health spending is often out‐of‐pocket and has been growing faster among the disadvantageous populations in India.20 Earlier studies have documented catastrophic health spending (CHS) for a variety of health services in India, which for many families ultimately leads to poverty.21, 22, 23 This situation will likely worsen as NCDs are becoming the leading causes of death and hospitalization in India,24 largely affecting the prime working‐age group.25, 26 Larger public investment in health care thus is essential to avoid CHS and increases in the national poverty level.23, 27, 28, 29
Recently, in order to increase access to health care and reduce the burden of household health spending and CHS in India, the National Health Policy (NHP) aimed to increase public health spending to 2.5% of GDP by 2030.30 To provide timely evidence for NHP to identify policies that would target the most relevant units to achieve this goal, we conducted a multilevel analysis of household health spending and CHS and examined the relative importance of states, districts, and villages in India. Multilevel modeling is essential in this context because various contextual and compositional factors may simultaneously contribute to the large variation in household health spending between and within geographical areas in India. Indeed, a recent study examining the contribution of multiple geographic units in shaping the distribution of poverty in India found that the relative importance of one contextual level is highly sensitive to other levels simultaneously considered in the model.31 After controlling for several important compositional factors, we extended this multilevel methodology to examine the variations in household health spending and CHS by state, regional, district, and village levels in India.
In general, cross‐country analyses based on cross‐sectional and panel data and different econometric techniques suggest income as the most significant determinant of variations in health expenditure,32 but they have not considered other potentially important units of analyses (eg, states, districts, and local villages or communities). Since health is a state subject in India, the laws and regulations on health care vary across states, and large interstate inequality in household health spending can be expected. For instance, depending on the state regulation, health care providers (physicians) may demand more or less expensive treatments for the same disease. Even so, the relative importance of states and other political and administrative units has not been comprehensively assessed to date.
Moreover, the different compositional factors associated with household health spending and CHS must be properly accounted for in order to quantify the magnitude of contextual variations that are independent of the clustering of such characteristics. Along with household income, the type of provider (public/private/NGOs/trust/traditional practitioner), type of disease (cancer, heart disease, dental care, and accidents and injuries), type of drug (generic/brand name), quality of care, age structure of household members (number of elderly people), and type of insurance are known to affect household health spending. For example, private providers charge significantly more than public health providers do, and brand‐name drugs are much more costly than generic drugs. India's 640 districts are spread across 35 states and union territories (as of India's 2011 census), which differ widely in demographic, health, social, and economic developments, which in turn are likely to affect households’ health spending.19 Our multilevel analysis provides estimates of contextual variations that are independent of a comprehensive set of important household‐level characteristics.
Methods
Data and Sample Size
We extracted the unit data of consumption expenditure survey (1.0), Type 2 schedule, carried out by the National Sample Survey Organisation (NSSO) during July 2011 and June 2012. The surveys covered all states and union territories using a stratified, multistage cluster sampling design and asked a total of 364 questions about consumption expenditure, of which 10 questions were on household spending on health over two reference periods, 30 days (termed as noninstitutional spending) and 365 days (termed as institutional health spending). The instrument, sampling methods, unit data, and report from this round of survey are publicly available.33 The NSS's 68th unit data follow a strict 5‐level hierarchical structure that includes households (level 1), villages/ urban wards (level 2), districts (level 3), regions (level 4), and states (level 5). These geographical levels are heterogeneous in demographic and developmental parameters31 and are likely to affect the household health spending. A total of 101,651 households were surveyed from 35 states and union territories containing 88 regions, 623 districts, and 12,649 villages/urban wards. A total of 75 households were excluded for missing information on one or more of the covariates (Figure 1).
Figure 1.
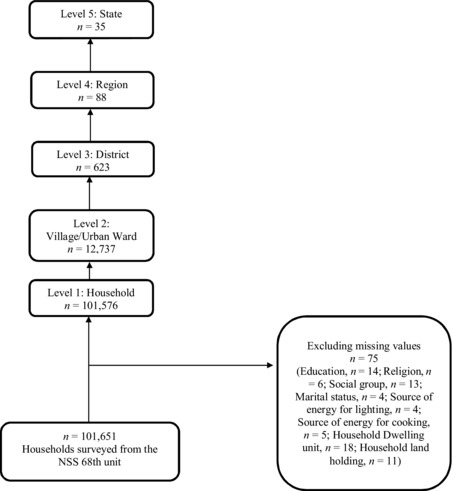
Sample Profile of Households, National Sample Survey, 2011/2012
Outcome Variables
In this analysis, we considered 4 outcome variables: (1) per‐capita household health spending (PHS), (2) per‐capita institutional household health spending (PIHS), (3) per‐capita noninstitutional household health spending (PNHS), and (4) catastrophic health spending (CHS). PHS was derived by summing all of a household's health spending (standardized annually) and dividing it by the household size. PIHS is synonymous to inpatient service care and includes expenditures on medicines, tests, doctor's/surgeon's fees, hospital/nursing home charges, and the like. PNHS is the same as outpatient services, which include medicines, tests, doctor's/surgeon's fees, family‐planning devices, and the like, but did not include expenditures on family planning. The demand for institutional and noninstitutional health services largely depends on the nature of the illness, the availability of health infrastructure, and the ability to pay for health services. PIHS is generally more expensive compared with PNHS. CHS was defined as a household's health spending exceeding 40% of its capacity to pay (we describe our estimation method in the section on statistical analysis) and was used as a proxy to understand the economic burden on a household caused by health spending. All outcomes were standardized to one year for uniformity and comparability.
Independent Variables
We used the following covariates in the analysis: place of residence (rural, urban), household size, caste (scheduled castes, scheduled tribes, other backward classes, others), religion (Hinduism, Islam, Christianity, and others), monthly per‐capita consumption expenditure (MPCE) quintile, household landholding, ownership of dwelling, source of energy for household cooking (LPG/gas/electricity, other), source of energy for lighting (electricity, other), and number of elderly (age 65+) in the households. The social groups defined by caste are important in India because the central, state, and local governments provide employment and education and many other social benefits to scheduled tribes, scheduled castes, and other backward class populations. The multivariate analyses controlled for other characteristics of head of household, such as age, sex (male, female), education (illiterate, primary, middle, secondary, higher secondary, and above), and marital status (currently married, other). In addition, we created an asset index based on the principal component analyses, with more than 30 variables, for robustness analyses.
Statistical Analyses
Estimation of Catastrophic Health Spending
We estimated CHS in order to understand the household economic burden on health care:
where X i is the consumption expenditure of the i th household and f(X) is the subsistence expenditure (SE) of the population. The SE is estimated as the median food expenditure of each state by rural and urban areas, and z is the threshold label fixed at 40%. Both consumption expenditure and SE were adjusted to equivalent household size. This approach of measuring CHS was suggested by Xu and colleagues11 and the World Health Organization34 and was used in recent literature.21, 35, 36 It is preferable to the fixed share of consumption expenditure/income (usually 10%), which is overly crude and not sensitive to health spending by the poor. The NSS's consumption expenditure survey data contained detailed questions about expenditures on food that allowed us to determine state‐, rural‐, and urban‐specific food poverty when calculating expenditures on subsistence, and hence derive robust estimates of CHS.
Multilevel Analysis
We used 5‐level random intercept linear regression models for PHS, PIHS, and PNHS:
where Yijklm is the outcome of the ith household in the j th village of the kth district in the lth region of the mth state, and X’ijklm represents the vector of all the explanatory variables adjusted in the regression model. The terms g0m, f0lm, v0klm, u0jklm, and e0ijklm are residuals at the state, regional, district, and village levels, respectively, which are assumed to be independent and normally distributed with a mean of 0 and a variance of σ2g0, σ2f, σ2v0, σ2u0, and σ2e0, respectively.
The variance partitioning coefficient (VPC) for level z is computed to quantify the variation in household health spending attributed to each level:37
Similarly, we used a 5‐level random intercept logistic model to model the probability of a household's incurring CHS. The variation at the lowest level cannot be directly obtained in multilevel logistic models and is instead approximated as 3.29.37
We prepared maps to illustrate the spatial clustering of household health spending at the higher geographic levels that transcend the administrative boundaries. Based on the residuals and standard deviations estimated from the multilevel models, we classified states, regions, and districts as low, average, and high areas for each of the outcome variables. Only the descriptive analyses were weighted. The MLwiN 2.32 software was used for all multilevel analyses, and the maps were prepared using STATA 13.
Sensitivity Analysis
We carried out our sensitivity analyses using 2‐level structures in which households were assumed to be nested in one, and only one, geographic level (eg, households nested only in villages). This allowed us to evaluate the changes in variance estimates and VPCs when only one geographic level was considered at a time. In addition, we generated maps based on the outputs from the 2‐level models.
Robustness Analysis
To check the robustness of our main findings, we re‐estimated the 5‐level model for each outcome after restricting the sample to households with a positive health expenditure. A total of 80,181 households (after excluding missing cases) had some health expenditures during the year before the survey; 16,119 households had institutional health expenditures; and 76,742 households had noninstitutional health expenditures. The 21,421 households that had no expenditures on health during the one‐year reference period were excluded from the robustness analysis. Their lack of health expenditures could be due to their lack of need for health care or their inability to pay. Finally, to check for any endogeneity created by the MPCE quintile with our outcome variables, we re‐estimated the 5‐level models for each outcome after excluding the MPCE; including a newly created asset index variable; and including the MPCE quintile that excluded health expenditure.
Results
Trends in Per‐Capita Health Spending in India
Both OOPE and per‐capita government spending on health in India have increased over the past 20 years, and the gap between them has also increased, from US$25 in 1995 to US$87 in 2014 (Figure 2a). Despite the increase in per‐capita government spending on health, the central government's share of total health spending has in fact declined, from 6.8% in 2004 to 6.6% in 2014, and that of the state government has also declined, from 12.0% to 10.9%, during the same period. Even though the local governments’ share has increased over time, the level has remained low. In the past decade, the share of OOPE on total expenditure has remained high and almost unchanged, at 71.1% in 2004 and 69.1% in 2014 (Figure 2b).
Figure 2a.
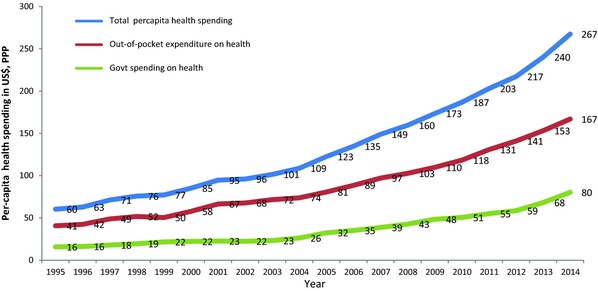
Trends in Per‐Capita Health Spending, Out‐of‐Pocket Expenditures on Health, and Government Spending on Health (at 2010 Prices and PPP, US$) in India, 1995‐2014a
aSource: http://apps.who.int/nha/database/Select/Indicators/en.38 [Color figure can be viewed at wileyonlinelibrary.com]
Figure 2b.
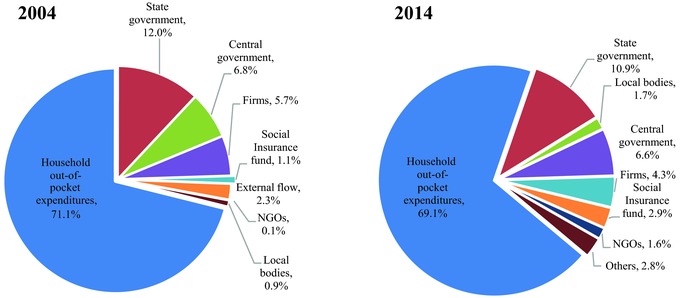
Percent Distribution of Health Spending by Sources in India, 2004‐2014a
Abbreviation: NGO, non‐governmental organization.
aSource: National Health Accounts, MoHFW 2004, 2014.17, 18 [Color figure can be viewed at wileyonlinelibrary.com]
Variations in Household Health Spending in India
Our final analytic sample consisted of 101,576 households nested in 12,649 villages and urban wards, 623 districts, 88 regions, and 35 states and union territories (see Figure 1). On average, PHS varied enormously across the states (Online Appendix 1). India's national average PHS was INR1,331 (US$1 ≊ INR49.5 in 2012), with the highest in Lakshadweep (INR3,425), followed by Kerala (INR3,069), and the lowest in Meghalaya (INR191). In the economically developed state of Punjab, PHS was INR2,386 and was INR658 in the poorer state of Bihar. PHS as share of consumption expenditure was also highest in Lakshadweep (9.1%), followed by Kerala (8.8%), but was less than 1% in Nagaland and Meghalaya (see Online Appendix 1). PHS (both institutional and noninstitutional) was higher in those households whose members had higher education and in the wealthier MPCE quintiles, indicating the positive association between ability to pay and household health spending. For the richest MPCE quintile, PHS was about 10 times higher than that of the poorest quintile (Table 1).
Table 1.
Per‐Capita Annual Household Health Spending (in INR), Per‐Capita Household Health Spending as Percentage of Monthly Per‐Capita Expenditure, and Catastrophic Health Spending by Selected Sociodemographic Characteristics in India, 2011‐2012a
| Annual PCE | Annual PHS | Annual PIHS | Annual PNHS | HHS as % of PCE | Annual CHS | |
|---|---|---|---|---|---|---|
| Sector | ||||||
| Rural | 17,398 | 1,156 | 375 | 781 | 6.6 | 24.8 |
| Urban | 31,994 | 1,768 | 626 | 1,142 | 5.5 | 20.5 |
| Number of elderly | ||||||
| No elderly | 21,655 | 1,233 | 406 | 827 | 5.7 | 22.0 |
| 1 | 21,175 | 1,619 | 549 | 1,070 | 7.6 | 29.7 |
| 2 | 21,388 | 1,983 | 770 | 1,214 | 9.3 | 32.6 |
| 3+ | 21,946 | 2,599 | 1,370 | 1,229 | 11.8 | 31.1 |
| Age | ||||||
| Less than 30 | 24,431 | 1,260 | 333 | 926 | 5.2 | 26.8 |
| 30‐44 | 20,656 | 1,133 | 359 | 774 | 5.5 | 19.3 |
| 45‐64 | 21,817 | 1,353 | 471 | 883 | 6.2 | 22.5 |
| 65 and above | 21,714 | 1,924 | 708 | 1,215 | 8.9 | 37.5 |
| Sex | ||||||
| Male | 21,421 | 1,302 | 437 | 864 | 6.1 | 21.8 |
| Female | 23,107 | 1,635 | 544 | 1,091 | 7.1 | 36.0 |
| Marital status | ||||||
| Currently married | 21,204 | 1,299 | 433 | 867 | 6.1 | 21.9 |
| Other | 24,506 | 1,583 | 559 | 1,024 | 6.5 | 31.3 |
| Education | ||||||
| Iliterate | 15,528 | 1,049 | 322 | 727 | 6.8 | 28.0 |
| Primary | 17,899 | 1,190 | 429 | 762 | 6.7 | 23.7 |
| Middle | 21,040 | 1,335 | 440 | 895 | 6.3 | 23.6 |
| Secondary | 25,110 | 1,569 | 565 | 1,004 | 6.2 | 20.0 |
| Higher secondary | 38,538 | 1,983 | 662 | 1,321 | 5.1 | 17.0 |
| Household size | ||||||
| <5 | 28,009 | 1,707 | 548 | 1,159 | 6.1 | 31.5 |
| (5‐7) | 18,304 | 1,126 | 381 | 746 | 6.2 | 14.4 |
| 8+ | 15,971 | 1,043 | 400 | 643 | 6.5 | 6.7 |
| Monthly Per‐Capita Expenditure Quintiles | ||||||
| Lowest | 9,325 | 353 | 59 | 295 | 3.8 | 15.5 |
| Lower | 13,546 | 620 | 140 | 480 | 4.6 | 19.4 |
| Middle | 17,508 | 895 | 227 | 668 | 5.1 | 22.9 |
| Higher | 23,102 | 1,336 | 387 | 949 | 5.8 | 25.2 |
| Highest | 4,4359 | 3,448 | 1,420 | 2,028 | 7.8 | 30.1 |
| Social groups | ||||||
| General | 28,516 | 1,740 | 609 | 1,131 | 6.1 | 22.0 |
| Other Backward Classes | 20,251 | 1,304 | 446 | 858 | 6.4 | 24.6 |
| Scheduled Castes | 17,314 | 1,099 | 321 | 778 | 6.4 | 25.6 |
| Scheduled Tribes | 15,069 | 659 | 203 | 456 | 4.4 | 18.3 |
| Religion | ||||||
| Hinduism | 21,403 | 1,315 | 438 | 877 | 6.1 | 23.7 |
| Islam | 19,416 | 1,169 | 370 | 799 | 6.0 | 21.8 |
| Christianity | 28,933 | 1,884 | 821 | 1,063 | 6.5 | 22.2 |
| Other | 31,147 | 2,147 | 786 | 1,361 | 6.9 | 23.6 |
| Household landholding | ||||||
| No land | 2,3906 | 1,481 | 469 | 1,011 | 6.2 | 24.9 |
| Up to 1 hectare | 21,081 | 1,298 | 446 | 852 | 6.2 | 24.2 |
| Up to 2 hectares | 17,814 | 1,102 | 350 | 752 | 6.2 | 19.1 |
| More than 2 hectares | 21,934 | 1,349 | 489 | 860 | 6.1 | 16.5 |
| Dwelling unit | ||||||
| Owned | 19,850 | 1,294 | 431 | 863 | 6.5 | 24.3 |
| Others | 34,871 | 1,612 | 567 | 1,045 | 4.6 | 19.0 |
| India | 21,567 | 1,331 | 447 | 884 | 6.2 | 23.4 |
| Sample size | 101,651 | 101,651 | 101,651 | 101,651 | 101,651 | 23,825 |
Abbreviations: PCE, per‐capita consumption expenditure; PHS, per‐capita household health spending; PIHS, per‐capita institutional household health spending; PNHS, per‐capita noninstitutional household health spending; HHS, household health spending; CHS, catastrophic health spending (exceeding 40% of household's capacity to pay).
Includes all cases.
Variations in Catastrophic Health Spending in India
CHS was positively associated with the number of elderly members and was higher in rural areas, in female‐headed households, and in households with illiterate heads (see Table 1). CHS varied enormously among India's states. Figure 3 shows the percentage of households incurring CHS in 20 major states, which account for over 95% of India's population. In 2011/2012, 23.4% of Indian households had catastrophic health expenditures. CHS was the highest in Kerala (37.2%), followed by Andhra Pradesh (31.7%) and West Bengal (31.1%). It was lowest in Assam (8.9%), followed by Delhi (11.3%). In general, CHS did not show any systematic patterns in accordance with the state's economic development, as it was equally high in both economically developed and less developed states.
Figure 3.
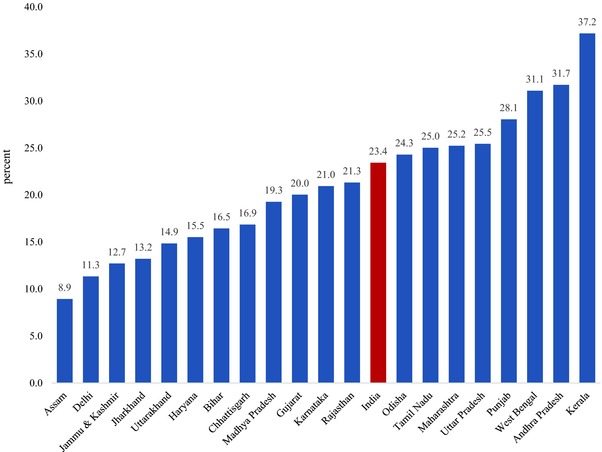
Percentage of Households Incurring Catastrophic Health Spending in Major States in India, 2011‐2012
Partitioning Variations in Health Spending
In the fully adjusted model for PHS, households accounted for the largest variation (77.1%), followed by states (10.1%), villages (9.5%), districts (2.6%), and regions (0.7%). States and villages together accounted for one‐fifth of the total variations in PHS (Figure 4a). The pattern was similar for CHS: the largest variation was found in households (72.6%), followed by states (15.9%), villages (7.1%), districts (3.1%), and regions (1.3%) (Figure 4b).37, 38 State and village levels accounted for more than 12% of the total variations in PIHS, but states appeared to be relatively less important than villages for PIHS (3.2% and 9.2%, respectively) (Figure 4c). For PNHS, states accounted for 12.3% of the total variation, followed by villages (9.7%), districts (3.1%), and regions (0.7%) in the fully adjusted model (Figure 4d). The general pattern in variance partitioning was similar for rural and urban areas; however, the variance estimates were larger for households in urban areas than for those in rural areas (Table 2).
Figure 4a.
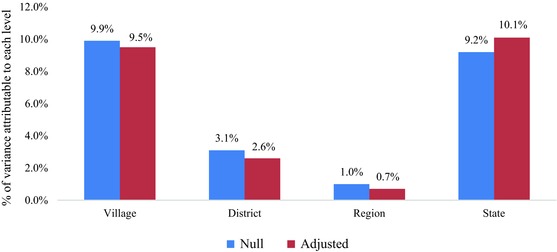
Percentage Variation in Per‐Capita Health Spending (PHS) Attributable to Village, District, Regional, and State Levels in Null and Adjusteda Models, India, 2011‐2012
aAdjusted for age of head of household, sex of head of household (male/female), household size, type of residency (rural/urban), log of annual MPCE (quintiles), dwelling unit (owned/any other), household landholding (no land/up to 1 hectare/up to 2 hectares/more than 2 hectares), source of energy for cooking (LPG, gas, electric, cooking/other), source of energy for lighting (electric, gas/other), marital status of head of household (currently married/other), educational level of head of household (illiterate/primary/middle/secondary/higher secondary), number of adults older than 65 in household, caste (scheduled tribes/scheduled castes/other backward classes/others), religion (Hinduism/Islam/Christianity/other). [Color figure can be viewed at wileyonlinelibrary.com]
Figure 4b.
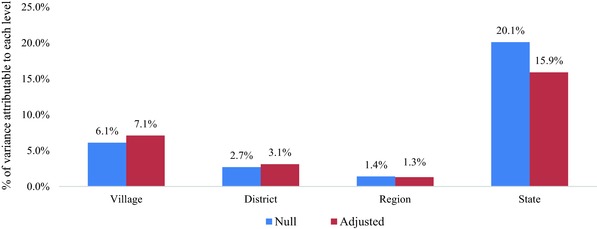
Percentage Variation in Catastrophic Health Spending (CHS) Attributable to Village, District, Regional, and State Levels in Null and Adjusteda Models, India, 2011‐2012
aAdjusted for age of head of household, sex of head of household (male/female), household size, type of residency (rural/urban), log of annual MPCE (quintiles), dwelling unit (owned/any other), household landholding (no land/up to 1 hectare/up to 2 hectares/more than 2 hectares), source of energy for cooking (LPG, gas, electric, cooking/other), source of energy for lighting (electric, gas/other), marital status of head of household (currently married/other), educational level of head of household (illiterate/primary/middle/secondary/higher secondary), number of adults older than 65 in household, caste (scheduled tribes/scheduled castes/other backward classes/others), religion (Hinduism/Islam/Christianity/other).
In calculating the total variance, we used the latent variable methods approach and treated the between‐household variation as having a variance of a standard logistic distribution, approximated as π2/3 = 3.29.37 , 39 [Color figure can be viewed at wileyonlinelibrary.com]
Figure 4c.
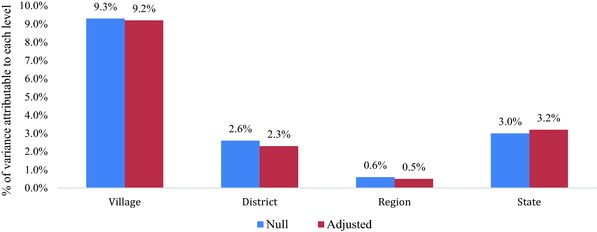
Percentage Variation in Per‐Capita Institutional Household Health Spending (PIHS) Attributable to Village, District, Regional, and State Levels in Null and Adjusteda Models, India, 2011‐2012
aAdjusted for age of head of household, sex of head of household (male/female), household size, type of residency (rural/urban), log of annual MPCE (quintiles), dwelling unit (owned/any other), household landholding (no land/up to 1 hectare/up to 2 hectares/more than 2 hectares), source of energy for cooking (LPG, gas, electric, cooking/other), source of energy for lighting (electric, gas/other), marital status of head of household (currently married/other), educational level of head of household (illiterate/primary/middle/secondary/higher secondary), number of adults older than 65 in household, caste (scheduled tribes/scheduled castes/other backward classes/others), religion (Hinduism/Islam/Christianity/other). [Color figure can be viewed at wileyonlinelibrary.com]
Figure 4d.
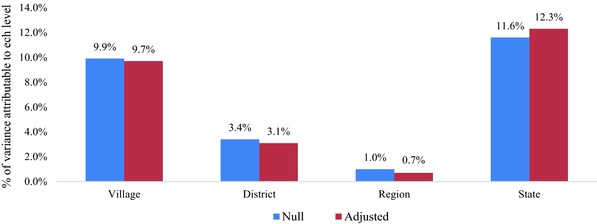
Percentage Variation in Per‐Capita Noninstitutional Household Health Spending (PNHS) Attributable to Village, District, Regional, and State Levels in Null and Adjusteda Models, India, 2011‐2012
aAdjusted for age of head of household, sex of head of household (male/female), household size, type of residency (rural/urban), log of annual MPCE (quintiles), dwelling unit (owned/any other), household landholding (no land/up to 1 hectare/up to 2 hectares/more than 2 hectares), source of energy for cooking (LPG, gas, electric, cooking/other), source of energy for lighting (electric, gas/other), marital status of head of household (currently married/other), educational level of head of household (illiterate/primary/middle/secondary/higher secondary), number of adults older than 65 in household, caste (scheduled tribes/scheduled castes/other backward classes/others), religion (Hinduism/Islam/Christianity/other). [Color figure can be viewed at wileyonlinelibrary.com]
Table 2.
Overall and Stratified Variance Estimates (95% CI) in Per‐Capita Household Health Spending, Catastrophic Health Spending, Per‐Capita Institutional Health Expenditure, and Per‐Capita Noninstitutional Health Expenditure at Household, Village, District, Regional, and State Levels from Null and Adjusteda 5‐Level Models, 2011‐2012
| Overall | Urbanb | Ruralc | ||||
|---|---|---|---|---|---|---|
| Null | Fully Adjusted | Null | Fully Adjusted | Null | Fully Adjusted | |
| PHS | ||||||
| Household | 7.0 | 6.3 | 7.9 | 7.0 | 6.3 | 5.8 |
| (6.9, 7.0) | (6.3, 6.4) | (7.9, 7.9) | (6.9, 7.1) | (6.2, 6.4) | (5.8, 5.9) | |
| Village | 0.9 | 0.8 | 0.9 | 0.8 | 0.9 | 0.8 |
| (0.9, 0.9) | (0.7, 0.8) | (0.9, 1.0) | (0.7, 0.9) | (0.8, 0.9) | (0.7, 0.8) | |
| District | 0.3 | 0.2 | 0.2 | 0.2 | 0.3 | 0.2 |
| (0.2, 0.3) | (0.2, 0.3) | (0.2, 0.2) | (0.1, 0.2) | (0.3, 0.4) | (0.2, 0.3) | |
| Region | 0.1 | 0.1 | 0.1 | 0.1 | 0.1 | 0.1 |
| (0.0, 0.2) | (0.0, 0.1) | (0.1, 0.1) | (0.0, 0.1) | (0.0, 0.2) | (0.0, 0.1) | |
| State | 0.8 | 0.8 | 0.6 | 0.6 | 0.9 | 0.9 |
| (0.4, 1.3) | (0.4, 1.3) | (0.5, 0.8) | (0.3, 1.0) | (0.4, 1.4) | (0.4, 1.4) | |
| CHS | ||||||
| Village | 0.3 | 0.3 | 0.3 | 0.3 | 0.3 | 0.4 |
| (0.3, 0.3) | (0.3, 0.4) | (0.2, 0.3) | (0.2, 0.3) | (0.3, 0.4) | (0.3, 0.4) | |
| District | 0.1 | 0.1 | 0.1 | 0.1 | 0.1 | 0.2 |
| (0.1, 0.2) | (0.1, 0.2) | (0.0, 0.1) | (0.0, 0.1) | (0.1, 0.2) | (0.1, 0.2) | |
| Region | 0.1 | 0.1 | 0.0 | 0.0 | 0.1 | 0.1 |
| (0.0, 0.1) | (0.0, 0.1) | (0.0, 0.1) | (0.0, 0.1) | (0.0, 0.1) | (0.0, 0.1) | |
| State | 1.0 | 0.7 | 0.8 | 0.6 | 0.9 | 0.7 |
| (0.5, 1.4) | (0.4, 1.1) | (0.4, 1.3) | (0.3, 0.9) | (0.5, 1.4) | (0.3, 1.1) | |
| PIHS | ||||||
| Household | 5.8 | 5.6 | 6.2 | 5.9 | 5.6 | 5.4 |
| (5.8, 5.9) | (5.6, 5.7) | (6.1, 6.3) | (5.8, 6.0) | (5.5, 5.7) | (5.3, 5.5) | |
| Village | 0.6 | 0.6 | 0.7 | 0.6 | 0.6 | 0.6 |
| (0.6, 0.7) | (0.6, 0.7) | (0.6, 0.7) | (0.6, 0.7) | (0.6, 0.7) | (0.5, 0.6) | |
| District | 0.2 | 0.2 | 0.1 | 0.1 | 0.2 | 0.2 |
| (0.1, 0.2) | (0.1, 0.2) | (0.0, 0.1) | (0.0, 0.1) | (0.2, 0.3) | (0.1, 0.2) | |
| Region | 0.0 | 0.0 | 0.1 | 0.0 | 0.0 | 0.0 |
| (0.0, 0.1) | (0.0, 0.1) | (0.0, 0.1) | (0.0, 0.1) | (0.0, 0.1) | (0.0, 0.0) | |
| State | 0.2 | 0.2 | 0.2 | 0.2 | 0.2 | 0.2 |
| (0.1, 0.3) | (0.1, 0.3) | (0.1, 0.3) | (0.1, 0.3) | (0.1, 0.4) | (0.1, 0.4) | |
| PNHS | ||||||
| Household | 6.9 | 6.4 | 7.7 | 7.0 | 6.3 | 5.9 |
| (6.8, 7.0) | (6.3, 6.4) | (7.6, 7.9) | (6.9, 7.0) | (6.2, 6.4) | (5.9, 6.0) | |
| Village | 0.9 | 0.8 | 1.0 | 0.9 | 0.9 | 0.8 |
| (0.9, 1.0) | (0.8, 0.9) | (0.9, 1.1) | (0.8, 1.0) | (0.8, 0.9) | (0.7, 0.8) | |
| District | 0.3 | 0.3 | 0.2 | 0.2 | 0.4 | 0.3 |
| (0.3, 0.4) | (0.2, 0.3) | (0.2, 0.3) | (0.1, 0.3) | (0.3, 0.4) | (0.3, 0.4) | |
| Region | 0.1 | 0.1 | 0.1 | 0.1 | 0.1 | 0.1 |
| (0.0, 0.2) | (0.0, 0.1) | (0.0, 0.2) | (0.0, 0.1) | (0.0, 0.1) | (0.0, 0.1) | |
| State | 1.1 | 1.1 | 0.9 | 0.9 | 1.1 | 1.1 |
| (0.5, 1.7) | (0.5, 1.6) | (0.4, 1.4) | (0.4, 1.3) | (0.5, 1.7) | (0.5, 1.6) | |
Abbreviations: PHS, per‐capita household health spending; CHS, catastrophic health spending (exceeding 40% of household's capacity to pay); PIHS, per‐capita institutional household health spending; PNHS, per‐capita noninstitutional household health spending.
Adjusted for age of head of household, sex of head of household (male/female), household size, type of residency (rural/urban), log of annual MPCE (quintiles), dwelling unit (owned/any other), household landholding (no land/up to 1 hectare/up to 2 hectares/more than 2 hectares), source of energy for cooking (LPG, gas, electric, cooking/other), source of energy for lighting (electric, gas/other), marital status of head of household (currently married/other), educational level of head of household (illiterate/primary/middle/secondary/higher secondary), number of adults older than 65 in household, caste (scheduled tribes/scheduled castes/other backward classes/others), religion (Hinduism/Islam/Christianity/other).
Urban sector has 35 states, 88 regions, 607 districts, 5,268 villages/census enumeration blocks, and 41,926 households.
Rural sector has 35 states, 88 regions, 613 districts, 7,469 villages, and 59,650 households.
The between‐village variation in health spending shown in the 2‐level model differed significantly across India's 35 states. For example, the variation in PHS was about 5.2% at the village level in Uttarakhand, followed by 6.6% in Jammu and Kashmir, compared with 23.1% in Haryana. But at the national level, 23.7% of the variation in PHS was at the village level (Online Appendix 2a). About 15.0% of the variation in CHS was at the village level across all the states, with the lowest in Punjab (2.7%) and the highest in Bihar (32.2%), followed by Jharkhand (28.6%) (Online Appendix 2b). PIHS and PNHS did not show a consistent pattern. For PIHS, 29.6% of the variation was at the village level in Assam, compared with only 3.3% in Punjab (Online Appendix 2c). For PNHS, 19.3% of the variation was at the village level across the nation. The highest between‐village variation was in Haryana (21.3%), and the lowest was in Jharkhand (4.4%) (Online Appendix 2d).
Mapping the Geography of Health Spending in India
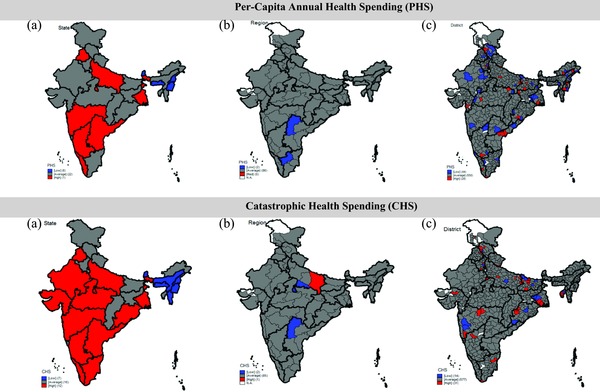
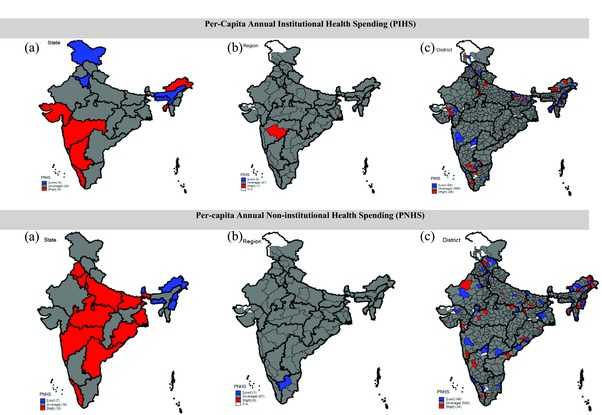
India's states, regions, and districts with high, average, and low rates of household health spending from the 5‐level fully adjusted models are shown in Figure 5. According to our classification, 6 states/ union territories (Punjab, Uttar Pradesh, West Bengal, Maharashtra, Karnataka, and Andhra Pradesh) were high PHS states, and 6 (Andaman Nicobar, Lakshadweep, Meghalaya, Manipur, Nagaland, and Sikkim) were low PHS states. Only the eastern and southern regions of Uttar Pradesh showed high and low levels of PHS, respectively. Of the 622 districts, 28 districts were classified as high PHS districts, 44 districts as low PHS districts, and 550 districts as average PHS districts. CHS was high in 12 states (Punjab, Rajasthan, Uttar Pradesh, West Bengal, Odisha, Madhya Pradesh, Gujarat, Maharashtra, Andhra Pradesh, Karnataka, Kerala, and Tamil Nadu) and low in 7 states (Sikkim, Nagaland, Manipur, Mizoram, Meghalaya, Andaman and Nicobar, and Assam). Of the 622 districts, 31 districts had high CHS and 14 districts had low CHS.
Figure 5.
Maps of India Showing the Geographic Distribution of Low, Average, and High Health Spending of (a) States, (b) Regions, and (c) Districts from the 5‐Level Model (State, Level 5; Region, Level 4; District, Level 3; Village, Level 2; Household, Level 1), 2011‐2012
Sensitivity Analyses
The results of our sensitivity analyses of 2‐level models are shown in Table 3. The between‐village variance estimates from the 2‐level model were larger than those obtained from the 5‐level models for PHS, CHS, PIHS, and PNHS. For example, in the fully adjusted 2‐level model (household and village), the between‐village variation in PHS, PIHS, CHS, and PNHS was 17.6%, 16.1%, 14.1%, and 19.3%, respectively, compared with 9.5%, 7.1%, 9.2%, and 9.7% from the 5‐level model. Similarly, when households were assumed to be nested in districts only, 8.6% of the variation in PHS was attributable to the districts, compared with 2.6% from the 5‐level model specification. Between‐district variations in CHS were 12.5% and 3.1% in the 2‐level and 5‐level models, respectively. Although we found little difference in between‐state variation between the 2‐level and 5‐level model specifications for PHS and CHS, we did find large differences in PIHS (see Table 3). The maps showing the geographic distribution of health spending in India based on the 2‐level models were also distinct from those obtained in the main analyses, further supporting the importance of simultaneously considering multiple units of analysis (Online Appendices 3, 4, 5, 6).
Table 3.
Variance Estimates (95% CI) in Per‐Capita Household Health Spending, Catastrophic Health Spending, Per‐Capita Institutional Household Health Spending, and Per‐Capita Noninstitutional Household Health Spending at Household, Village, District, Regional, and State Levels from 2‐Levela Adjustedb Models, 2011‐2012
| PHS | PIHS | PNHS | CHS | |||||
|---|---|---|---|---|---|---|---|---|
| Levels | Variance | % | Variance | % | Variance | % | Variance | % |
| State | 0.9 | 11.0% | 0.3 | 4.0% | 1.2 | 13.5% | 0.7 | 16.6% |
| (0.5, 1.3) | (0.1, 0.4) | (0.6, 1.7) | (0.3, 1.0) | |||||
| Household | 7.3 | 89.0% | 6.4 | 96.0% | 7.5 | 86.5% | 3.29 | 83.4% |
| (7.3, 7.4) | (6.3, 6.4) | (7.4, 7.6) | ||||||
| Region | 0.5 | 6.9% | 0.2 | 3.2% | 0.7 | 8.5% | 0.4 | 11.7% |
| (0.4, 0.7) | (0.1, 0.3) | (0.5, 0.9) | (0.3, 0.6) | |||||
| Household | 7.3 | 93.1% | 6.4 | 96.8% | 7.4 | 91.5% | 3.29 | 88.3% |
| (7.2, 7.3) | (6.3, 6.4) | (7.3, 7.5) | ||||||
| District | 0.7 | 8.6% | 0.4 | 5.7% | 0.9 | 10.7% | 0.5 | 12.5% |
| (0.6, 0.7) | (0.3, 0.4) | (0.8, 1.0) | (0.4, 0.5) | |||||
| Household | 7.1 | 91.4% | 6.2 | 94.3% | 7.2 | 89.3% | 3.29 | 87.5% |
| (7.0, 7.1) | (6.2, 6.3) | (7.1, 7.2) | ||||||
| Village | 1.4 | 17.6% | 0.9 | 14.1% | 1.5 | 19.3% | 0.6 | 16.1% |
| (1.3, 1.4) | (0.9, 1.0) | (1.5, 1.6) | (0.6, 0.7) | |||||
| Household | 6.3 | 82.4% | 5.6 | 85.9% | 6.4 | 80.7% | 3.29 | 83.9% |
| (6.3, 6.4) | (5.6, 5.7) | (6.3, 6.5) | ||||||
Abbreviations: PHS, per‐capita household health spending; PIHS, per‐capita institutional household health spending; PNHS, per‐capita noninstitutional household health spending; CHS, catastrophic health spending.
Results from 4 different 2‐level models with households at level 1 nested in 1 higher unit at level 2.
Adjusted for age of head of household, sex of head of household (male/female), household size, type of residency (rural/urban), log of annual MPCE (quintiles), dwelling unit (owned/any other), household landholding (no land/up to 1 hectare/up to 2 hectares/more than 2 hectares), source of energy for cooking (LPG, gas, electric, cooking/other), source of energy for lighting (electric, gas/other), marital status of head of household (currently married/other), educational level of head of household (illiterate/primary/middle/secondary/higher secondary), number of adults older than 65 in household, caste (scheduled tribes/scheduled castes/other backward classes/others), religion (Hinduism/Islam/Christianity/other).
Robustness Analyses
The results of our rerunning the 5‐level linear and logistic models after restricting the sample to households with positive health spending (n = 80,181) are shown in Online Appendix 8. The general pattern from robustness analyses was similar to what we found in our main results. In the fully adjusted model for PHS, households accounted for the largest variation (72.4%), followed by villages (11.0%), states (10.3%), districts (4.4%), and regions (1.9%). For CHS, states (13.4%) and villages (7.5%) also had larger variations compared with those of districts (3.8%) and regions (1.8%). Larger contextual variations were found for PIHS: states (26.6%), villages (15.2%), districts (6.5%), and regions (2.4%). Finally, villages and states accounted for 12.6% and 8.2% of the total variation in PNHS, respectively (see Online Appendix 8). Additional analysis excluding MPCE quintiles resulted in the same variance estimates and VPCs for all the outcomes (Online Appendix 9). Models including a measure of asset index and models adjusting for MPCE excluding health expenditures all resulted in consistent estimates, indicating that the concern for MPCE measure causing endogeneity with our outcome variables was not supported by our data.
Discussion
To our knowledge, this is the first study to apply multilevel modeling to assess empirically the relative importance of multiple geopolitical and administrative units that may have an important influence on household health spending and CHS in India. We next discuss 6 salient findings from our analysis.
First, we observed substantial variations in household health spending both between and within states. Across states, PHS (including institutional and noninstitutional health spending) was higher in economically developed states and lower in poorer states. Within the states, PHS was higher among richer and better‐educated households. This confirms that PHS is linked to a household's ability to pay, which was well established in the earlier literature.
Second, the pattern of between‐ and within‐state variations in CHS differed from that of PHS. About one‐fourth of the households in India incurred CHS, and it was high in both the economically and the demographically advanced states of Kerala, Punjab, and Maharashtra, as well as in the poorer states of Odisha and Uttar Pradesh. This suggests that along with economic factors, noneconomic factors have a large effect on CHS.
Third, the results of our 5‐level model indicate that the largest variation in health spending is attributable to the household level, even after adjusting for important household characteristics, but that the states and villages were consistently found to be important contextual units for PHS, PNHS, and CHS. In the case of PIHS, the larger variation was attributable to villages, followed by states. This suggests that contextual factors in the macro and micro political units, rather than in regions and districts, might be important to reducing household health spending in India.
Fourth, our results were robust after restricting our sample to households that incurred any expenditures. In fact, the between‐state and between‐village variations in all 4 outcomes were larger when we excluded those households with zero expenditures.
Fifth, the results of our sensitivity analyses based on the 2‐level models differed from those of our main analysis based on the 5‐level models, suggesting the importance of applying multilevel perspective to account for the full complexity of hierarchical structure40 that may simultaneously influence the distribution of household health spending.
Sixth, the mapping of states, regions, and districts with high, average, and low health spending visually confirmed that areas with high health spending were not clustered within a limited number of states but rather were dispersed across the states. For all outcomes, the variation was particularly large at the state level, compared with the regional and district levels.
Our analysis had 2 important data limitations. First, we could not examine the variation in household health spending by type of disease because the consumption expenditure surveys did not include questions on morbidity. Second, the information about expenditures was at the household level and not for each member by episode of disease. Hence, we could not directly link the age and sex of the household members to the health expenditure. Nonetheless, our multilevel analyses provided important evidence to confirm that the variations in household health spending cannot be explained by household‐level factors alone. Consistent with an earlier study of a multilevel analysis of poverty in India,31 we found evidence that contextual factors in macro and micro political units may play relatively more important roles in explaining the geographic variations in health spending.
Our findings suggest that any assessment focused on a single level may conceal important heterogeneity in disease patterns, cost of medical care, and type and utilization of health services that are influenced by state government regulations and local conditions leading to differential health spending at the village and state levels. One possible explanation for the large interstate variation observed in PHS is the differing state regulations regarding physicians’ prescription of drugs (brand‐name drugs versus generic drugs) and their prices. This may be particularly relevant to PNHS, since drugs account for more than two‐thirds of PNHS, and the majority of households in India seek health services from private health care providers.40 The larger variation at the local level for PIHS may be explained by the differential cost of hospitalization and the quality of health services across city centers. Since most of the NCDs are treated in private health centers, state‐level factors may have a relatively smaller influence on PIHS. The factors that drive CHS variability may also be specific to the state. For instance, in the demographically and economically developed state of Kerala, the high CHS may be due to greater awareness of health benefits and the availability of the health infrastructure. In contrast, in the poorer state of Odisha, high CHS may be due to low household income and the public health centers catering principally to maternal and child health combined with weak regulation of private health centers. In Delhi, publicly funded health centers provide quality health services, which may have lowered CHS.
An important policy implication of our study is that states and villages are the most appropriate units to target for reducing variations in health spending and CHS. Our study provides a timely contribution, as the National Health Policy 2017 aims to improve the accessibility, affordability, and quality of health care in India. The central government has promised to increase government investment in health from 1.5% of GDP to 2.5% of GDP by 2025.30 Given that health is a state subject in India, greater spending by state governments on health care can increase the availability and affordability of health services and hence reduce OOPE and household spending. Those states that were identified as higher health spending areas in our study may be given priority.
Future studies should test for specific state‐ and village‐level factors that contribute to large variations in health spending. For instance, access to health insurance, quality of care, and costs of public and private health centers are potential sources of variability that remain unexplored. In 2016, only 29% of India's households had any form of health insurance, and the state differentials in insurance coverage were large.42 In addition, the states’ regulation of drug prices, tests, and private health centers for health care can reduce the CHS. For example, stents cost INR150,000 to 200,000 before the government fixed the price at INR29,600.43 Similarly, regulating the prices of medical tests and diagnoses will certainly reduce the interstate and intrastate variations in health spending. Far less attention has been paid to the importance of the village level. Further examinations are needed to better understand how the local environment (eg, health facilities in the primary health centers) contributes to the variation in health spending across villages in India.
Supporting information
Online Appendix 1. Distribution of Number of Regions, Districts, Villages, and Households; Annual Per‐Capita Household Consumption Expenditure; Health Spending; and Health Spending as Percentage of Household Consumption Expenditure in 35 Indian States, 2011/2012
Online Appendix 2a. Percentage of Variation in Per‐Capita Health Spending (PHS) Attributable to Villages in the Fully Adjusteda 2‐Level Models (Level‐1 Households Nested in Level‐2 Villages) Stratified by Major States in India, 2011/2012
Online Appendix 2b. Percentage of Variation in Catastrophic Health Spending (CHS) Attributable to Villages in the Fully Adjusteda 2‐Level Models (Level‐1 Households Nested in Level‐2 Villages) Stratified by Selected Major States in India, 2011/2012
Online Appendix 2c. Percentage of Variation in Per‐Capita Institutional Household Health Spending (PIHS) Attributable to Villages in the Fully Adjusteda 2‐Level Models (Level‐1 Households Nested in Level‐2 Villages) Stratified by Selected Major States in India, 2011/2012
Online Appendix 2d. Percentage of Variation in Per‐Capita Non‐institutional Household Health Spending (PNHS) Attributable to Villages in the Fully Adjusteda 2‐Level Models (Level‐1 Households Nested in Level‐2 Villages) Stratified by Selected Major States in India, 2011/2012
Online Appendix 3. Maps of India Showing the Geographic Distribution of Low, Average, and High Per‐Capita Annual Health Spending (PHS) in (a) States, (b) Regions, and (c) Districts from the 2‐Level Model, 2011/2012
Online Appendix 4. Maps of India Showing the Geographic Distribution of Low, Average, and High Household Catastrophic Health Spending (CHS) in (a) States, (b) Regions, and (c) Districts from the 2‐Level Model, 2011/2012
Online Appendix 5. Maps of India Showing the Geographic Distribution of Low, Average, and High Per‐Capita Annual Institutional Health Spending (PIHS) in (a) States, (b) Regions, and (c) Districts from the 2‐Level Model, 2011/2012
Online Appendix 6. Maps of India Showing the Geographic Distribution of Low, Average, and High Per‐Capita Annual Non‐institutional Health Spending (PNHS) in (a) States, (b) Regions, and (c) Districts from the 2‐Level Model, 2011/2012
Online Appendix 7. Result of Regression Coefficient of 5‐Level Null and Adjusted Models
Online Appendix 8. Overall and Stratified Variance Estimates in Per‐Capita Household Health Spending, Catastrophic Health Spending, Per‐Capita Institutional Health Expenditure, and Per‐Capita Noninstitutional Health Expenditure at Household, Village, District, Regional, and State Levels from Null and Adjusteda 5‐Level Models Restricted to Households with Positive Health Spending (n = 80,181) in India, 2011/2012
Online Appendix 9. Variance Estimates (VE) and Percent Variance Partitioning Coefficient (VPC) in Per‐Capita Household Health Spending, Catastrophic Health Spending, Per‐Capita Institutional Health Expenditure, and Per‐Capita Noninstitutional Health Expenditure at Household, Village, District, Regional, and State Levels from 5‐Level Models (1) Adjustinga for Original Monthly Per‐Capita Consumption Expenditure (MPCE), (2) Not Adjusting for MPCE, (3) Adjusting for Asset Index, (and 4) Adjusting for MPCE Excluding Health Expenditure in India, 2011/2012
Funding/Support
None.
Conflict of Interest Disclosures: All authors have completed and submitted the ICMJE Form for Disclosure of Potential Conflicts of Interest. No conflicts were reported.
Acknowledgments: Mohanty, Kim, and Subramanian conceptualized and designed the study. Mohanty and Kim led the data analysis, interpretation, jointly wrote the manuscript, and jointly led the revision. Khan and Subramanian contributed to the data analysis, interpretation of the results, and the writing. Subramanian provided overall supervision of the study. All the authors approved the final submission of the study. The authors have no conflicts of interest relevant to this article to disclose.
References
- 1. Zuckerman S, McFeeters J. Recent Growth in Health Expenditures. Washington, DC: Commonwealth Fund; 2006. [Google Scholar]
- 2. Smith S, Newhouse JP, Freeland MS. Income, insurance, and technology: why does health spending outpace economic growth? Health Aff. 2009;28(5):1276‐1284. [DOI] [PubMed] [Google Scholar]
- 3. Fan VY, Savedoff WD. The health financing transition: a conceptual framework and empirical evidence. Soc Sci Med. 2014;105:112‐121. [DOI] [PubMed] [Google Scholar]
- 4. Dieleman JL, Templin T, Sadat N, et al. National spending on health by source for 184 countries between 2013 and 2040. Lancet. 2016;387(10037):2521‐2535. [DOI] [PubMed] [Google Scholar]
- 5. Nixon J, Ulmann P. The relationship between health care expenditure and health outcomes. Eur J Health Econ. 2006;7(1):7‐18. [DOI] [PubMed] [Google Scholar]
- 6. Crémieux PY, Ouellette P, Pilon C. Health care spending as determinants of health outcomes. Health Econ. 1999;8(7):627‐639. [DOI] [PubMed] [Google Scholar]
- 7. Poullier J‐P, Hernandez P, Kawabata K, Savedoff WD. Patterns of global health expenditures: results for 191 countries. Geneva, Switzerland: World Health Organization; 2002. [Google Scholar]
- 8. Arsenijevic J, Pavlova M, Groot W. Measuring the catastrophic and impoverishing effect of household health care spending in Serbia. Soc Sci Med. 2013;78:17‐25. [DOI] [PubMed] [Google Scholar]
- 9. Knaul FM, Arreola‐Ornelas H, Méndez‐Carniado O, et al. Evidence is good for your health system: policy reform to remedy catastrophic and impoverishing health spending in Mexico. Lancet. 2006;368(9549):1828‐1841. [DOI] [PubMed] [Google Scholar]
- 10. Li Y, Wu Q, Xu L, et al. Factors affecting catastrophic health expenditure and impoverishment from medical expenses in China: policy implications of universal health insurance. Bull World Health Organ. 2012;90(9):664‐671. [DOI] [PMC free article] [PubMed] [Google Scholar]
- 11. Xu K, Evans DB, Kawabata K, Zeramdini R, Klavus J, Murray CJ. Household catastrophic health expenditure: a multicountry analysis. Lancet. 2003;362(9378):111‐117. [DOI] [PubMed] [Google Scholar]
- 12. Wagstaff A, Doorslaer E. Paying for health care: quantifying fairness, catastrophe, and impoverishment, with applications to Vietnam, 1993–98. Washington, DC: World Bank, Development Research Group, 2001. [Google Scholar]
- 13. Office of the Registrar General and Census Commissioner, India . Compendium of India's Fertility and Mortality Indicators, 1971‐2007, Based on the Sample Registration System . New Delhi, India: Ministry of Home Affairs, Government of India; 2009.
- 14. Office of the Registrar General and Census Commissioner, India . Sample registration system statistical report 2014 . New Delhi, India: Ministry of Home Affairs, Government of India; 2016.
- 15. Planning Commission . Report of the Expert Group to Review the Methodology for Measurement of Poverty. New Delhi: Government of India; 2014. [Google Scholar]
- 16. Health Accounts . World Health Organization website. http://www.who.int/health-accounts/en/. Accessed January 22, 2018.
- 17. Ministry of Health and Family Welfare . National Health Account Estimates for India, 2004‐05 . New Delhi, India: Ministry of Health System Resources Center, Government of India; 2009.
- 18. Ministry of Health and Family Welfare . National Health Account estimates for India 2013‐14. In: Ministry of Health System Resources Center, Government of India; 2016.
- 19. Mohanty SK, Ladusingh L, Kastor A, Chauhan RK, Bloom DE. Pattern, growth and determinant of household health spending in India, 1993‐2012. J Public Health. 2016;24(3):215‐229. [Google Scholar]
- 20. Karan A, Selvaraj S, Mahal A. Moving to universal coverage? Trends in the burden of out‐of‐pocket payments for health care across social groups in India, 1999‐2000 to 2011‐12. PloS One. 2014;9(8):e105162. [DOI] [PMC free article] [PubMed] [Google Scholar]
- 21. Bonu S, Bhushan I, Rani M, Anderson I. Incidence and correlates of “catastrophic” maternal health care expenditure in India. Health Policy Plann. 2009;24(6):445‐456. [DOI] [PubMed] [Google Scholar]
- 22. Tripathy J, Prasad B, Shewade H, et al. Cost of hospitalisation for non‐communicable diseases in India: are we pro‐poor? Trop Med Int Health. 2016;21(8):1019‐1028. [DOI] [PubMed] [Google Scholar]
- 23. Balarajan Y, Selvaraj S, Subramanian S. Health care and equity in India. Lancet. 2011;377(9764):505‐515. [DOI] [PMC free article] [PubMed] [Google Scholar]
- 24. Office of the Registrar General and Census Commissioner, India . Cause of death statistics 2010‐13. New Delhi, India: Government of India; 2016.
- 25. Bloom DE, Canning D, Hu L, Liu Y, Mahal A, Yip W. The contribution of population health and demographic change to economic growth in China and India. J Comp Econ. 2010;38(1):17‐33. [DOI] [PMC free article] [PubMed] [Google Scholar]
- 26. Mahal A, Karan A, Engelgau M. The economic implications of non‐communicable disease for India. Washington, DC: World Bank; 2010. [Google Scholar]
- 27. Bonu S, Bhushan I, Peters DH. Incidence, Intensity, and Correlates of Catastrophic Out‐of‐Pocket Health Payments in India. https://www.adb.org/sites/default/files/publication/28364/wp102.pdf. ERD Working Paper Series no. 102. Published October 2007. Accessed January 22, 2018.
- 28. Selvaraj S, Karan AK. Deepening health insecurity in India: evidence from national sample surveys since 1980s. Econ Polit Weekly. 2009:55‐60. [Google Scholar]
- 29. Kassebaum NJ, Arora M, Barber RM, et al. Global, regional, and national disability‐adjusted life‐years (DALYs) for 315 diseases and injuries and healthy life expectancy (HALE), 1990–2015. Lancet. 2016. [DOI] [PMC free article] [PubMed] [Google Scholar]
- 30. Ministry of Health and Family Welfare . National Health Policy, 2017 . New Delhi, India: Government of India; 2017.
- 31. Kim R, Mohanty SK, Subramanian S. Multilevel geographies of poverty in India. World Development. 2016;87:349‐359. [Google Scholar]
- 32. Gerdtham U‐G, Jönsson B. International comparisons of health expenditure: theory, data and econometric analysis. Handbook Health Econ. 2000;1:11‐53. [Google Scholar]
- 33. National Sample Survey Organisation . Level and Pattern of Consumer Expenditure, 2011‐12 . NSS Report no. 555(68/1.0/1) New Delhi, India: Ministry of Statistics and Program Implementation, Government of India; 2014.
- 34. World Health Organization . Designing health financing systems to reduce catastrophic health expenditure. Geneva, Switzerland: World Health Organization; 2005.
- 35. Rashad AS, Sharaf MF. Catastrophic and impoverishing effects of out‐of‐pocket health expenditure: new evidence from Egypt. Am J Econ. 2015;5(5):526‐533. [Google Scholar]
- 36. Mohanty SK, Kastor A. Out‐of‐pocket expenditure and catastrophic health spending on maternal care in public and private health centres in India: a comparative study of pre and post national health mission period. Health Econ Rev. 2017;7(1):31. [DOI] [PMC free article] [PubMed] [Google Scholar]
- 37. Goldstein H, Browne W, Rasbash J. Partitioning variation in multilevel models. Understanding Statistics. 2002;1(4):223‐231. [Google Scholar]
- 38. Global health expenditure database . World Health Organization website. http://apps.who.int/nha/database/Select/Indicators/en. Accessed January 29, 3017.
- 39. Browne WJ, Subramanian SV, Jones K, Goldstein H. Variance partitioning in multilevel logistic models that exhibit over‐dispersion. J Royal Stat Soc. 2005;168(3):599‐614. doi:10.1111/j.1467-985X.2004.00365.x. [Google Scholar]
- 40. Garg CC, Karan AK. Reducing out‐of‐pocket expenditures to reduce poverty: a disaggregated analysis at rural‐urban and state level in India. Health Policy Plann. 2008;24(2):116‐128. [DOI] [PubMed] [Google Scholar]
- 41. Kim R, Subramanian SV. What's wrong with understanding variation using a single‐geographic scale? A multilevel geographic assessment of life expectancy in the United States. Procedia Environmental Sciences. 2016;36:4‐11. [Google Scholar]
- 42. International Institute for Population Sciences . National Family Health Survey 4: India Fact Sheet. New Delhi, India: Ministry of Health and Family Welfare, Government of India; 2015.
- 43. Nagarajan R. National Pharmaceutical Pricing Authority slashes stent prices by up to 85%. Times of India. February 14, 2017. [Google Scholar]
Associated Data
This section collects any data citations, data availability statements, or supplementary materials included in this article.
Supplementary Materials
Online Appendix 1. Distribution of Number of Regions, Districts, Villages, and Households; Annual Per‐Capita Household Consumption Expenditure; Health Spending; and Health Spending as Percentage of Household Consumption Expenditure in 35 Indian States, 2011/2012
Online Appendix 2a. Percentage of Variation in Per‐Capita Health Spending (PHS) Attributable to Villages in the Fully Adjusteda 2‐Level Models (Level‐1 Households Nested in Level‐2 Villages) Stratified by Major States in India, 2011/2012
Online Appendix 2b. Percentage of Variation in Catastrophic Health Spending (CHS) Attributable to Villages in the Fully Adjusteda 2‐Level Models (Level‐1 Households Nested in Level‐2 Villages) Stratified by Selected Major States in India, 2011/2012
Online Appendix 2c. Percentage of Variation in Per‐Capita Institutional Household Health Spending (PIHS) Attributable to Villages in the Fully Adjusteda 2‐Level Models (Level‐1 Households Nested in Level‐2 Villages) Stratified by Selected Major States in India, 2011/2012
Online Appendix 2d. Percentage of Variation in Per‐Capita Non‐institutional Household Health Spending (PNHS) Attributable to Villages in the Fully Adjusteda 2‐Level Models (Level‐1 Households Nested in Level‐2 Villages) Stratified by Selected Major States in India, 2011/2012
Online Appendix 3. Maps of India Showing the Geographic Distribution of Low, Average, and High Per‐Capita Annual Health Spending (PHS) in (a) States, (b) Regions, and (c) Districts from the 2‐Level Model, 2011/2012
Online Appendix 4. Maps of India Showing the Geographic Distribution of Low, Average, and High Household Catastrophic Health Spending (CHS) in (a) States, (b) Regions, and (c) Districts from the 2‐Level Model, 2011/2012
Online Appendix 5. Maps of India Showing the Geographic Distribution of Low, Average, and High Per‐Capita Annual Institutional Health Spending (PIHS) in (a) States, (b) Regions, and (c) Districts from the 2‐Level Model, 2011/2012
Online Appendix 6. Maps of India Showing the Geographic Distribution of Low, Average, and High Per‐Capita Annual Non‐institutional Health Spending (PNHS) in (a) States, (b) Regions, and (c) Districts from the 2‐Level Model, 2011/2012
Online Appendix 7. Result of Regression Coefficient of 5‐Level Null and Adjusted Models
Online Appendix 8. Overall and Stratified Variance Estimates in Per‐Capita Household Health Spending, Catastrophic Health Spending, Per‐Capita Institutional Health Expenditure, and Per‐Capita Noninstitutional Health Expenditure at Household, Village, District, Regional, and State Levels from Null and Adjusteda 5‐Level Models Restricted to Households with Positive Health Spending (n = 80,181) in India, 2011/2012
Online Appendix 9. Variance Estimates (VE) and Percent Variance Partitioning Coefficient (VPC) in Per‐Capita Household Health Spending, Catastrophic Health Spending, Per‐Capita Institutional Health Expenditure, and Per‐Capita Noninstitutional Health Expenditure at Household, Village, District, Regional, and State Levels from 5‐Level Models (1) Adjustinga for Original Monthly Per‐Capita Consumption Expenditure (MPCE), (2) Not Adjusting for MPCE, (3) Adjusting for Asset Index, (and 4) Adjusting for MPCE Excluding Health Expenditure in India, 2011/2012


