ABSTRACT
The most common practice in studying and cataloguing prokaryotic diversity involves the grouping of sequences into operational taxonomic units (OTUs) at the 97% 16S rRNA gene sequence identity level, often using partial gene sequences, such as PCR-generated amplicons. Due to the high sequence conservation of rRNA genes, organisms belonging to closely related yet distinct species may be grouped under the same OTU. However, it remains unclear how much diversity has been underestimated by this practice. To address this question, we compared the OTUs of genomes defined at the 97% or 98.5% 16S rRNA gene identity level against OTUs of the same genomes defined at the 95% whole-genome average nucleotide identity (ANI), which is a much more accurate proxy for species. Our results show that OTUs resulting from a 98.5% 16S rRNA gene identity cutoff are more accurate than 97% compared to 95% ANI (90.5% versus 89.9% accuracy) but indistinguishable from any other threshold in the 98.29 to 98.78% range. Even with the more stringent thresholds, however, the 16S rRNA gene-based approach commonly underestimates the number of OTUs by ∼12%, on average, compared to the ANI-based approach (∼14% underestimation when using the 97% identity threshold). More importantly, the degree of underestimation can become 50% or more for certain taxa, such as the genera Pseudomonas, Burkholderia, Escherichia, Campylobacter, and Citrobacter. These results provide a quantitative view of the degree of underestimation of extant prokaryotic diversity by 16S rRNA gene-defined OTUs and suggest that genomic resolution is often necessary.
IMPORTANCE Species diversity is one of the most fundamental pieces of information for community ecology and conservational biology. Therefore, employing accurate proxies for what a species or the unit of diversity is are cornerstones for a large set of microbial ecology and diversity studies. The most common proxies currently used rely on the clustering of 16S rRNA gene sequences at some threshold of nucleotide identity, typically 97% or 98.5%. Here, we explore how well this strategy reflects the more accurate whole-genome-based proxies and determine the frequency with which the high conservation of 16S rRNA sequences masks substantial species-level diversity.
KEYWORDS: average nucleotide identity, diversity, 16S rRNA gene
INTRODUCTION
The definition of species as the unit of biodiversity for Bacteria and Archaea has been a longstanding problem in microbiology, with important conceptual implications for the study of microbial ecology and diversity (see, e.g., references 1–3). Currently, the predominant view is that species should be named based on a consensus of phenotypic and genomic characteristics (4). Indeed, for most named species, this consensus does exist, resulting in a classification scheme with adequate stability, operability, and predictability (5). For example, named species with available sequenced genomes can be reliably demarcated by a genome-aggregate average nucleotide identity (ANI) of 95%, with an accuracy of >98% (6–8). However, analysis of whole genomes for environmental and diversity studies is far less common than an analysis of individual marker genes, notably the 16S rRNA gene sequence. Indeed, analysis of 16S rRNA full-length or partial gene sequences has revolutionized the study of prokaryotic diversity during the past 2 decades.
A typical 16S rRNA gene analysis pipeline involves the recovery of 16S rRNA-encoding sequences from environmental samples, their subsequent clustering at 97% nucleotide identity, and finally, a count or comparison of the resulting operational taxonomic units (OTUs), which are used as a unit of diversity, approximating the species level (see, e.g., references 9 and 10). The 97% identity threshold was first proposed as a (purposefully conservative) lower boundary to subsequently screen isolates for assignment to species using higher-resolution methods, such as DNA-DNA hybridization (11), and is the default in two of the most popular pipelines for 16S rRNA gene analyses: QIIME and mothur (12, 13). Moreover, surveys and estimations of the extant prokaryotic species diversity on Earth are often based on OTUs defined by 97% 16S rRNA gene sequence identity (see, e.g., references 10, 14, and 15). However, the more recently established 98.5% 16S rRNA gene nucleotide identity threshold appears to more precisely reflect genomic and nomenclatural standards for the species level (6, 11). Other thresholds have been proposed as well, such as 98.65% (16) and 98.7% (17). In any case, it is now well appreciated that the above-mentioned 16S rRNA thresholds, although they should not be equated with the genomic and phenotypic standards for species definition (4), represent an important unit of microbially diverse populations that is close enough to the species level, i.e., they can serve as a reliable proxy for measuring microbially diverse populations. It has also been realized that 16S rRNA genes are too conserved to delineate closely related species; thus, the 97% identity level (or even 98.5 to 98.7%) may lump together distinct species (18, 19). For example, identical 16S rRNA gene sequences can be found between pairs of phenotypically and genomically distinct species, including some from the genera Campylobacter, Xanthomonas, Escherichia, Mycobacterium, Yersinia, and Cycloclasticus. However, the simplicity of the approach, its broad applicability due to the availability of (nearly) universal PCR primers to amplify 16S rRNA gene sequences from most prokaryotes, and the existence of large reference databases to facilitate analysis have made 16S rRNA gene-based surveys the method of choice for diversity studies.
Genome-derived parameters, such as the 95% average nucleotide identity (ANI), have been shown to better encompass the named species based on isolates (8, 20) and the natural sequence-discrete populations sampled by metagenomics (21), as these parameters capture better than 16S rRNA gene sequence analysis the traditional methods and standards for demarcating species, e.g., DNA-DNA hybridization (20). For instance, Kim and colleagues estimated that the precision of the 98.65% 16S rRNA gene threshold for species demarcation is 92.2% (16), meaning that about 8% of the pairs of genomes showing a 16S rRNA gene identity of >98.65% show an ANI of <95%; thus, they should be actually assigned to different OTUs or species. These results, which echoed previous similar studies with a smaller collection of genomes (6), indicated that although genome-derived methods offer higher resolution than 16S rRNA gene-based ones, the difference is probably not dramatic. However, it is likely that these results are misleading with respect to how many distinct species may exist in a habitat that are grouped under the same 16S rRNA OTU for several reasons.
First, the genomes sequenced during the previous decade aimed to cover phylogenetic diversity, as opposed to close relatives, with the possible exception of pathogenic taxa. Yet, several close relatives often cooccur within a natural habitat (21), which could amplify the above-mentioned limitation of the 16S rRNA gene method. Second, environmental surveys do not typically include complete high-quality 16S rRNA gene sequences but instead error-prone short sequences of the V4 or V6 (or other) region, with the potential effects of both underestimating the number of OTUs due to insufficient resolution and inflating OTU counts due to sequence artifacts and errors. Finally, the previous studies were focused on whether or not organisms should be assigned to the same species (or OTU) and did not evaluate how many distinct species are represented by these organisms, which is more relevant for environmental diversity surveys. Accordingly, it still remains speculative as to how much 16S rRNA gene analysis underestimates the prokaryotic diversity sampled within natural habitats. Addressing this issue is important for the estimation of prokaryotic community diversity richness, a highly important topic for diversity cataloguing and conservation (cf. reference 15 and debate therein), as well as for assessing diversity shifts across spatial or temporal scales, which is typically based on comparative studies of alpha and beta diversity. Importantly, the distribution of features, such as gene and metabolic pathways underlying abundance profiles, may differ between species and higher taxonomic levels (1, 14), further underscoring the importance of accurate and reproducible comparisons. Such comparisons require a clear understanding of the taxonomic richness, which may differ depending on the level of genetic or phylogenetic depth assessed (e.g., 97% 16S rRNA gene versus 95% ANI [6]). How OTUs are defined is particularly relevant for the underlying evolutionary or ecologic assumptions during these alpha/beta diversity comparisons as well (see, e.g., references 1 and 3).
To provide quantitative estimates of the degree of underestimation of naturally occurring diversity by 16S rRNA and, thus, guidance on how to perform diversity surveys more accurately in the future, we evaluated the 16S rRNA gene identities and ANI values in a collection of 8,350 complete genomes to determine the optimal threshold of 16S rRNA gene identity corresponding to 95% ANI, and we compared the number of OTUs defined at the 97% or 98.5% 16S rRNA gene identity level to those defined at 95% ANI based on the same genome sequences.
RESULTS AND DISCUSSION
16S rRNA gene identity thresholds.
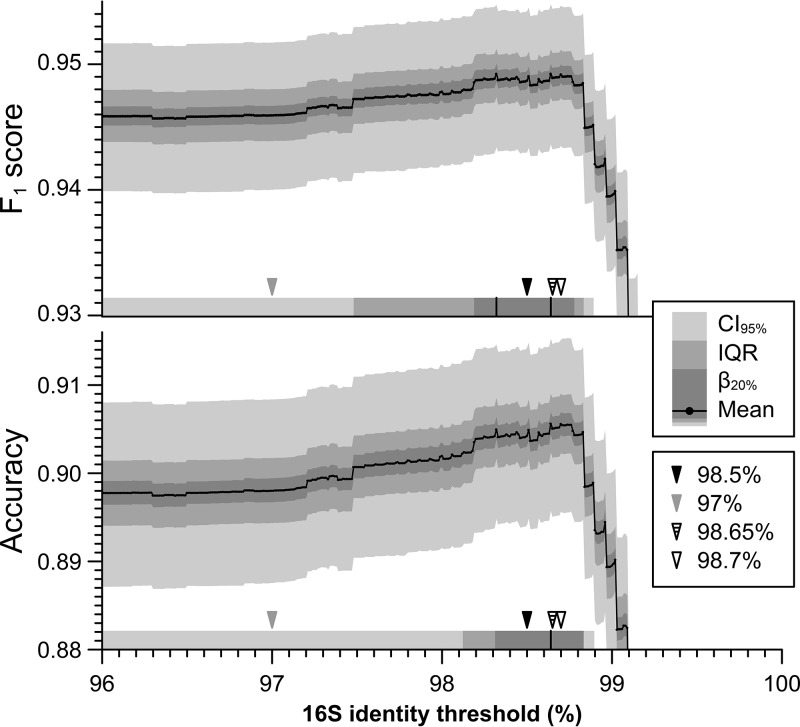
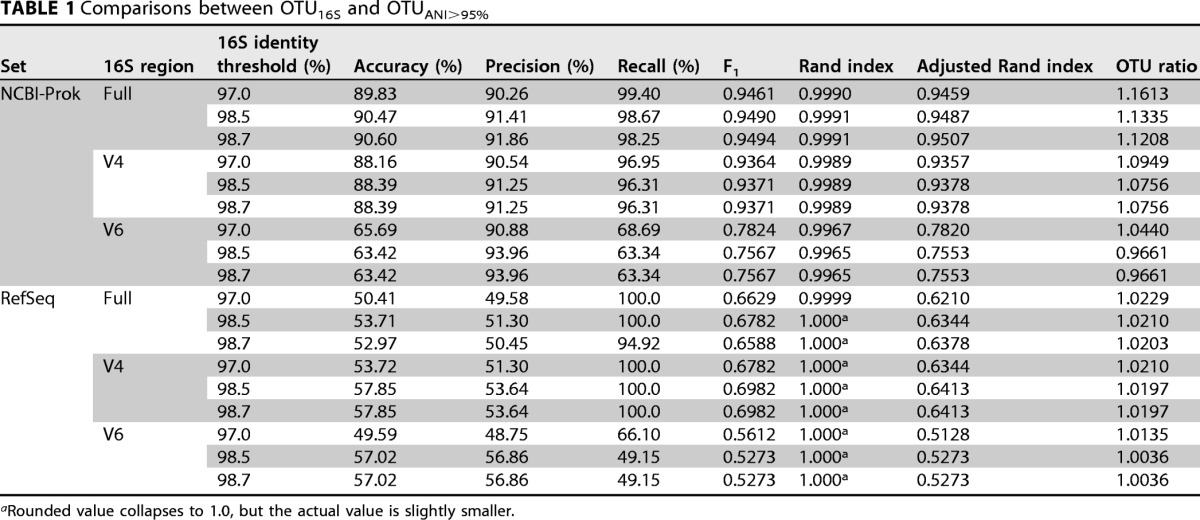
In order to identify the 16S rRNA gene threshold most consistent with an ANI of 95%, we performed a bootstrapped F1 score and accuracy analysis for different thresholds ranging from 96 to 100% 16S rRNA gene identity (every 0.01%). We identified two thresholds with almost identical F1 scores (0.949): 98.32% and 98.64%, which were statistically indistinguishable with 80% power from any thresholds in the range of 98.29 to 98.78% (Fig. 1). This range includes previously proposed 16S rRNA gene thresholds, such as 98.5% (6, 11), 98.65% (16), and 98.7% (17), but not 97% (Table 1). Since they are all roughly equivalent with the available data collection (8,350 genomes) and 1,000 bootstraps, we employed the 98.5% threshold for the rest of our analysis. This threshold appears to be more widely used in the literature (compared to 98.65% or 98.7%) and, by being more conservative than other proposed thresholds, 98.5% is less likely to be influenced by artifacts or other sources of variation not considered here that may inflate diversity measurements. For example, intragenomic 16S rRNA gene diversity has been observed to be on average 0.3%, but with substantial variation around this mean value (22), and typical data-processing pipelines of second-generation sequencing technologies for 16S rRNA amplicon analyses may allow sequencing errors of up to 0.1 to 1% (or Q20 to Q30 Phred score).
FIG 1.
Most accurate 16S rRNA gene identity thresholds with respect to 95% ANI. The figure shows the F1 score (top) and accuracy (bottom) of different 16S rRNA gene identity thresholds (x axis) using 95% ANI as a reference. Both metrics represent trade-offs between recall and precision. For each metric, the plot displays the summary statistics of 1,000 rounds of bootstrap on the NCBI-Prok collection as bands; mean (solid line), 80% power range (β20%, darker band), interquartile range (IQR; intermediate band), and 95% confidence interval (CI95%; lightest band). In the lower portion of each panel (horizontal shading), the identity thresholds with the highest F1 score or accuracy are marked with vertical solid black lines (98.32% and 98.64% for F1, 98.64% for accuracy). The regions in which the mean F1 score or accuracy is within the β20%, IQR, and 95% CI ranges of the thresholds with highest values are indicated with concentric gray bands. The 16S rRNA gene identity threshold used in this study (98.5%) is indicated with a filled black arrowhead, the default 16S rRNA gene identity threshold in QIIME and mothur (97%) is indicated with a filled gray arrowhead, and other less common thresholds used in the literature (98.65% and 98.7%) are indicated with open black arrowheads. All except 97% are within the β20% range of the highest F1.
TABLE 1.
Comparisons between OTU16S and OTUANI>95%
aRounded value collapses to 1.0, but the actual value is slightly smaller.
Diversity estimates using 16S rRNA gene and ANI methods.
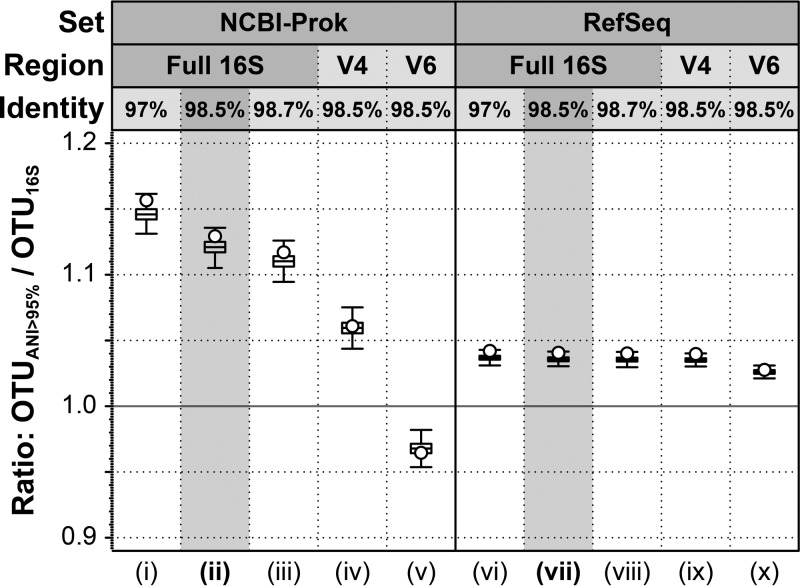
We sought to quantify the likely range by which diversity is underestimated using 16S rRNA gene sequences with respect to an ANI of 95%. The 8,350 genomes in NCBI-Prok were clustered into 2,988 OTU using ANI 95% (OTUANI>95%) or 2,636 OTU using a 16S rRNA gene threshold of 98.5% (OTU16S>98.5%). That is, 16S rRNA gene clustering yielded 11.8% fewer OTUs than ANI (or, conversely, a ratio of OTUANI>95% to OTU16S>98.5% of 1.13; Fig. 2ii). The difference was 5-fold smaller in the RefSeq collection, i.e., only 2.05% fewer OTUs (Fig. 2viii), presumably due to the RefSeq reference genome collection including only one or a few genomes per named species, while no such taxonomic selection is applied to the NCBI-Prok collection. Therefore, the species-level classification problem is harder in the NCBI-Prok set and more relevant for the main objectives of our study. As expected, the underestimation of the number of OTUANI>95% was even larger with the 97% identity threshold for 16S rRNA genes, with 13.9% fewer OTU using a 16S threshold of 97% (OTU ratio, 1.16).
FIG 2.
Differences in the number of OTUs recovered by ANI relative to 16S rRNA. Graph shows the ratio of the number of OTUs recovered based on 95% ANI (OTUANI>95%) versus 16S rRNA (y axis) for different 16S rRNA gene cutoffs (x axis): i and vi, 97% identity across the full-length gene sequence (OTU16S>97%); ii and vii, 98.5% across the full-length gene sequence (OTU16S>98.5%); iii and viii, 98.7% across the full-length gene sequence (OTU16S>98.7%); iv and ix, 98.5% across the V4 region only, a cutoff exceeded with two nucleotide substitutions; and v and x, 98.5% across the V6 region, exceeded with one substitution. Open circles indicate the OTU ratio estimations; error bars denote standard deviations over 1,000 rounds of bootstrapping.
Interestingly, the variable regions of the 16S rRNA gene frequently used in amplicon sequencing (V4 and V6) resulted in estimates of richness closer to those using an ANI of 95%, with only 7% fewer and 3.5% more 16S rRNA OTUs, respectively (Fig. 2iv and v). However, these regions also resulted in lower accuracies in the classification of a pair as the same or different species (using 95% ANI as a reference standard) of 88.4% and 63.4% in V4 and V6, respectively, compared to 90.1% in the complete sequence (Table 1). Moreover, the OTUs resulting from both variable regions were less similar to those formed by a 95% ANI, with adjusted Rand index values decreasing from 94.9% in the complete sequence to 93.8% and 75.5% in V4 and V6, respectively (Table 1). Together, these results reveal a substantial systematic underestimation of diversity using 16S rRNA gene complete sequences with respect to genomic standards by about 12% (or 14% when using the 97% identity threshold). Even more concerning, a nonsystematic noise in the diversity estimates when using only variable regions of the 16S rRNA was also observed. Importantly, the degree of underestimation is contingent upon the number of genomes related at near- and underspecies levels, as demonstrated by the difference between the NCBI-Prok and RefSeq collections. Therefore, the average underestimation found by our analysis should not be used as an absolute standard correction factor on 16S rRNA gene-based estimates of richness but, rather, as an approximate guide or reference point.
Taxonomic biases in diversity estimates.
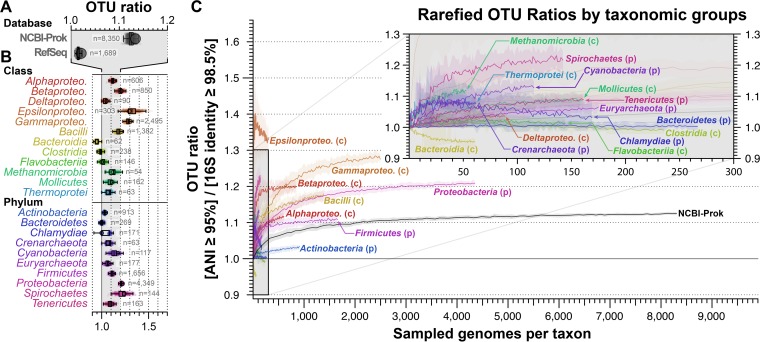
To provide an estimate on how these values might change with more closely related, but distinct, species sampled, we subsampled, with replication, the genomes of the most sampled phyla and classes (over 50 genomes within each taxon) and rarefied the resulting OTU ratio (Fig. 3). The analysis shows that the ratio of OTUANI>95% to OTU16S>98.5% approximated 1.1 to 1.3 and plateaued at that value with a higher number of genomes compared (Fig. 3C). Therefore, it appears that a 16S rRNA gene analysis approach may underestimate natural diversity by up to 10 to 23%, depending on the species sampled and their taxonomic composition.
FIG 3.
Phylogenetic biases in the ANI-to-16S rRNA OTU ratio. (A) Average OTUANI>95%-to-OTU16S>98.5% ratios based on all genomes in NCBI-Prok and RefSeq collections. (B) Ratios are reported separately for the most frequently sampled phyla and classes (at least 50 available genomes). Boxplots denote the distribution of estimations over 1,000 rounds of bootstrapping (box, interquartile range; whiskers, full range without outliers), open circles indicate the estimate without bootstraps, and numbers denote the number of genomes used for each taxon. Alphaproteo., Alphaproteobacteria; Betaproteo., Betaproteobacteria; Deltaproteo., Deltaproteobacteria; Epsilonproteo., Epsilonproteobacteria; Gammaproteo., Gammaproteobacteria. (C) Rarefaction of ratios for most sampled classes and phyla. Shaded ribbons denote the interquartile range over 100 rounds of bootstrapping. Inset is the zoomed-in version of the gray-shaded area in the graph.
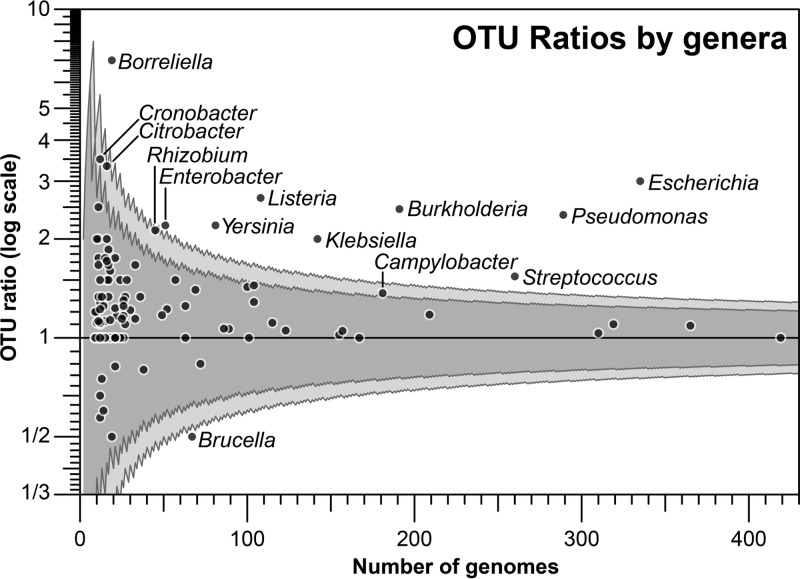
We analyzed the resulting OTUs at finer taxonomic levels in more detail in order to identify the taxa whose diversity has been more underestimated because they have accumulated less variation in their 16S rRNA gene relative to the whole genome. We identified 14 genera with OTUANI>95%-to-OTU16S>98.5% ratios significantly different from 1.0, between 1.5 and 7 (Fig. 4), 6 of which are classified in the Enterobacteriaceae family. For a few of the taxa with abnormally high OTU ratios, the underlying factors for the high 16S rRNA gene sequence conservation, or, conversely, the faster evolution of the whole genome, are known at least in part, but for most taxa, these factors remain to be elucidated. For example, Campylobacter spp. are among the most recombinogenic species known and show increased genomic sequence diversity (23). Similarly, Citrobacter spp. display high frequencies of gene exchange with other enteric bacteria (see, e.g., reference 24). Interestingly, two of the detected outliers include species previously observed to exhibit high intragenome 16S rRNA diversity (but relatively even higher genomic diversity that resulted in these species being outliers): Borrelia afzelii (= Borreliella afzelii) and Escherichia coli (22). Borreliella afzelii (and other species in the Borreliella genus) typically present a linear chromosome with 2 copies of the 16S rRNA gene (one pseudogenized), with about 80% identity between them (22, 25). In such cases, whole-genome comparisons are more appropriate for cataloguing differences among closely related populations with accelerated or constrained mutation rates (see also below) that reflect distinctive ecologic and evolutionary strategies, and these are not captured by 16S rRNA gene differences.
FIG 4.
OTU ratios for different genera in NCBI-Prok. All genera with at least nine genomes available in the NCBI-Prok collection were reclustered in OTUANI>95% and OTU16S>98.5%, and OTU ratios (y axis) were calculated as in Fig. 2. The OTU ratios per genera are displayed by the number of genome representatives available (x axis). The 95% and 99% confidence intervals for a binomial-based ratio statistic are displayed as dark and light gray bands, respectively.
Only the genus Brucella was observed to have an abnormally low OTU ratio, i.e., higher average genome-wide conservation than 16S rRNA gene conservation. All ANI values within the genus are above 97.4%, generating a single OTUANI>95%, while most 16S rRNA gene identities are above 99.3%, with only the two genomes from yet-unnamed species displaying 96.0 to 96.3% identity to the rest of the set, resulting in two OTU using a 16S rRNA gene threshold of 98.5%. The Brucella genus is composed of facultative intracellular pathogens causing brucellosis, with genomes typically composed of two chromosomes of about 2.1 and 1.2 Mbp in length (26). The genus-wide intracellular lifestyle typically with host-species specificity may have served as a barrier for horizontal gene transfer (HGT), and only scarce HGT events have been identified (26). This barrier, combined with genome streamlining typical of intracellular parasites, could have resulted in high genome-wide sequence conservation not necessarily affecting the 16S rRNA gene mutation and fixation rates.
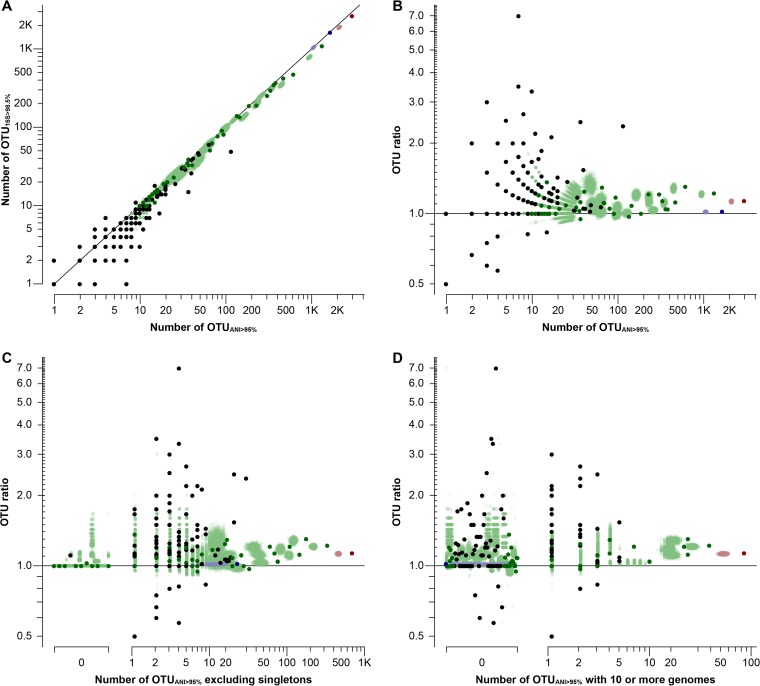
Finally, we explored the effect that small OTU counts (few total OTUs in a collection) could have on OTU ratios, as well as the effect that small OTUs (OTUs with few genomes) could have on OTU counts. As expected, smaller OTU counts caused a larger dispersion (by chance) on OTUANI>95%-to-OTU16S>98.5% ratios (Fig. 4 and 5, leftmost data points). However, when collating all different data sets, we observed that the ratio tended toward a value of >1 (around 1.2) when collections with more OTUs were considered (Fig. 5, rightmost data points), indicating that a 95% ANI consistently recovers a larger number of OTUs than a 16S rRNA gene cutoff of 98.5% (Fig. 5A and B). A special case of OTUs to receive attention is singletons (OTUs with only one member), because they are more likely to reflect incorrect assignment (e.g., due to sequencing errors). Hence, we also evaluated the effect that removing singleton OTUs as well as OTUs with fewer than 10 genomes would have on the observed OTUANI>95%-to-OTU16S>98.5% ratios. As expected, the density of the data was significantly impacted, but we noted no effect on the general trend toward an OTUANI>95%-to-OTU16S>98.5% ratio of >1 (Fig. 5C and D).
FIG 5.
Effect of number of genomes within an OTU on OTU ratio estimates. (A) The number of OTU16S>98.5% (x axis) is lesser than or equal to the number of OTUANI>95%, with only few examples of the opposite trend mostly from small sets (5 or fewer OTUANI>95%; diagonal line indicates a 1:1 relationship, or OTU ratio of 1.0). The remaining panels show the OTU ratios (y axis) per number of OTUANI>95% (B), number of OTUANI>95% excluding singletons (i.e., with 2 or more genomes) (C), and number of OTUANI>95% with 10 or more genomes (x axes) (D). The colors indicate the type of genome collection used: NCBI-Prok (red), RefSeq (blue), phylum-/class-level subsets (green), or genus-level subsets (black). Lighter dots, mostly overlapping and forming clouds of the corresponding data set color, indicate bootstrapped values. Note that the three distributions in panels B to D are not substantially different from each other.
Conclusions.
Knowing the number of species in an ecological system (i.e., species richness) is of fundamental importance for understanding community structure and its value. The results presented here provided a guide, and an associated genome-based methodology, to more reliably estimate the number of taxa or OTUs present. In particular, we identified taxa with strong biases (underestimation) in the 16S rRNA gene-derived estimation of richness, including groups with high intragenome 16S rRNA gene variation, such as Escherichia and Borreliella, and groups with high frequency of genome-wide recombination, such as Campylobacter and Citrobacter. Our results also suggest that previous 16S rRNA gene-based estimates of the number of prokaryotic species on Earth (10, 15) should be considered lower-boundary estimates, likely underestimating richness by at least 10 to 15%, although the exact percentage would depend on the genera living in particular habitats (e.g., see Fig. 4). As the technologies to recover hundreds to thousands of metagenome-derived genomes and single-cell amplified genomes from individual or collection series samples become more routine in the not-so-distant future (see, e.g., references 27–30), the genome-based methodology outlined here is also expected to become more relevant and provide more accurate estimates of species richness in nature.
MATERIALS AND METHODS
Source genomes.
A total of 8,350 complete genomes were retrieved from the NCBI Genome database Prokaryotic section (NCBI-Prok) on 17 April 2017 (see https://www.ncbi.nlm.nih.gov/genome) using the automated retrieval features of the Microbial Genomes Atlas (MiGA) (see http://microbial-genomes.org/ and https://github.com/bio-miga/miga). In addition, a high-quality collection of 1,689 reference genomes sampling mostly different species was retrieved from the NCBI RefSeq database (31). The identity matrices used in this study are available online (http://enve-omics.ce.gatech.edu/data/ani-16s), and the up-to-date collections are also available on the MiGA website (http://microbial-genomes.org/).
Comparisons between estimations of relatedness.
The 16S rRNA gene identification and extraction, ANI estimations, and matrix construction were executed as implemented in MiGA (see https://github.com/bio-miga/miga). Briefly, for each genome, the longest 16S rRNA gene was identified and extracted using Barrnap (see https://github.com/tseemann/barrnap) and BEDTools (32). For every genome pair with an average amino acid identity (AAI) of ≥80%, the ANI was estimated using aai.rb and ani.rb from the Enveomics Collection (33). The identity between 16S rRNA gene sequences was estimated using the Needleman-Wunsch algorithm for global sequence alignment as implemented in Needle from EMBOSS (34). Regions V4 and V6 of the 16S rRNA gene sequences were identified with V-Xtractor (35), with Escherichia coli (accession no. U00096) coordinates 588 and 674 and 994 and 1046 for Bacteria, respectively, and Archaeoglobus fulgidus (accession no. X05567) coordinates 538 and 706 and 932 and 995 for Archaea, respectively. The same method to determine identity was applied. Taxonomic selections were made using the NCBI Taxonomy database as imported by MiGA. Bootstrapping was performed by selecting at random with replacement a number of genomes equal to the total collection size and reconstructing the relatedness matrices 1,000 times. Comparisons between 16S rRNA gene identity and ANI thresholds were performed using the F1 score and accuracy, taking an ANI of ≥95% as the standard. The F1 score is defined as the harmonic mean of precision and recall:
where recall is defined as the number of true positives (pairs where ANI is ≥95% and 16S rRNA gene identity is greater than or equal to the test threshold) divided by the number of condition positives (pairs where ANI is ≥95%), and precision is defined as the number of true positives (as described above) divided by the number of prediction positives (pairs where 16S rRNA gene identity is greater than or equal to the test threshold). Accuracy is defined as the sum of true negatives (pairs where ANI is <95% and 16S rRNA gene identity is less than the test threshold) and true positives, divided by the total population (number of pairs in the collection).
OTU construction.
Operational taxonomic units (OTUs) were identified from sparse identity matrices of ANI (filtered at 95%) or 16S rRNA (filtered at different thresholds) using the Markov clustering algorithm (MCL) (see https://micans.org/mcl/) with ogs.mcl.rb from the Enveomics Collection (33). The OTU ratio was defined as the number of OTUs formed by ANI divided by the number of OTUs formed by 16S rRNA gene identities. To provide a reference of the dispersion derived from count statistics alone, the OTU ratios for particular genera were compared against the statistic (n − x)/(x + 1) as a null model, where n is the number of genomes in the comparison and x is a random variable following the binomial distribution with n − 1 trials and 0.5 probability of success. OTU clustering from 16S rRNA gene identities was compared to that from 95% ANI using the raw and adjusted Rand index values (36, 37), as implemented by clust.rand.rb from the Enveomics collection (33). The Rand index (RI) measures the similarity of two clusterings of the same data set by evaluating the numbers of pairs cooccurring on each clustering. The adjusted Rand index (ARI) adjusts this measure by the probability of clustering by chance, assuming a generalized hypergeometric distribution.
ACKNOWLEDGMENTS
We thank Neha Varghese for her kind support with IMG data access.
This work was supported by the U.S. National Science Foundation (awards 1356288, 1356380, 1241046, and RCN 1051481) and the U.S. Department of Energy (award DE-FG02-99ER62848).
This work was also supported by the U.S. Department of Energy Joint Genome Institute, a DOE Office of Science User Facility, under contract number DE-AC02-05CH11231.
We declare no conflicts of interest.
REFERENCES
- 1.Hubbell SP. 2008. The Unified neutral theory of biodiversity and biogeography (MPB-32). Princeton University Press, Princeton, NJ. [Google Scholar]
- 2.Krause S, Le Roux X, Niklaus PA, Van Bodegom PM, Lennon JT, Bertilsson S, Grossart H-P, Philippot L, Bodelier PLE. 2014. Trait-based approaches for understanding microbial biodiversity and ecosystem functioning. Front Microbiol 5:251. doi: 10.3389/fmicb.2014.00251. [DOI] [PMC free article] [PubMed] [Google Scholar]
- 3.Martiny JBH, Jones SE, Lennon JT, Martiny AC. 2015. Microbiomes in light of traits: a phylogenetic perspective. Science 350:aac9323. doi: 10.1126/science.aac9323. [DOI] [PubMed] [Google Scholar]
- 4.Oren A, Garrity GM. 2014. Then and now: a systematic review of the systematics of prokaryotes in the last 80 years. Antonie Van Leeuwenhoek 106:43–56. doi: 10.1007/s10482-013-0084-1. [DOI] [PubMed] [Google Scholar]
- 5.Rosselló-Mora R, Amann R. 2001. The species concept for prokaryotes. FEMS Microbiol Rev 25:39–67. doi: 10.1111/j.1574-6976.2001.tb00571.x. [DOI] [PubMed] [Google Scholar]
- 6.Cole JR, Konstantinidis K, Farris RJ, Tiedje JM. 2010. Microbial diversity and phylogeny: extending from rRNAs to genomes, p 1–20. In Liu W-T, Jansson JK (ed), Environmental molecular biology. Horizon Scientific Press, Norwich, United Kingdom. [Google Scholar]
- 7.Varghese NJ, Mukherjee S, Ivanova N, Konstantinidis KT, Mavrommatis K, Kyrpides NC, Pati A. 2015. Microbial species delineation using whole genome sequences. Nucleic Acids Res 43:6761–6771. doi: 10.1093/nar/gkv657. [DOI] [PMC free article] [PubMed] [Google Scholar]
- 8.Jain C, Rodriguez-R LM, Phillippy AM, Konstantinidis KT, Aluru S. 2017. High-throughput ANI analysis of 90K prokaryotic genomes reveals clear species boundaries. bioRxiv. doi: 10.1101/225342. [DOI] [PMC free article] [PubMed]
- 9.Meyer F, Paarmann D, D'Souza M, Olson R, Glass E, Kubal M, Paczian T, Rodriguez A, Stevens R, Wilke A, Wilkening J, Edwards RA. 2008. The metagenomics RAST server–a public resource for the automatic phylogenetic and functional analysis of metagenomes. BMC Bioinformatics 9:386. doi: 10.1186/1471-2105-9-386. [DOI] [PMC free article] [PubMed] [Google Scholar]
- 10.Locey KJ, Lennon JT. 2016. Scaling laws predict global microbial diversity. Proc Natl Acad Sci U S A 113:5970–5975. doi: 10.1073/pnas.1521291113. [DOI] [PMC free article] [PubMed] [Google Scholar]
- 11.Stackebrandt E, Ebers J. 2006. Taxonomic parameters revisited: tarnished gold standards. Microbiol Today 33:152–155. [Google Scholar]
- 12.Schloss PD, Westcott SL, Ryabin T, Hall JR, Hartmann M, Hollister EB, Lesniewski RA, Oakley BB, Parks DH, Robinson CJ, Sahl JW, Stres B, Thallinger GG, Van Horn DJ, Weber CF. 2009. Introducing mothur: open-source, platform-independent, community-supported software for describing and comparing microbial communities. Appl Environ Microbiol 75:7537–7541. doi: 10.1128/AEM.01541-09. [DOI] [PMC free article] [PubMed] [Google Scholar]
- 13.Caporaso JG, Kuczynski J, Stombaugh J, Bittinger K, Bushman FD, Costello EK, Fierer N, Peña AG, Goodrich JK, Gordon JI, Huttley GA, Kelley ST, Knights D, Koenig JE, Ley RE, Lozupone CA, McDonald D, Muegge BD, Pirrung M, Reeder J, Sevinsky JR, Turnbaugh PJ, Walters WA, Widmann J, Yatsunenko T, Zaneveld J, Knight R. 2010. QIIME allows analysis of high-throughput community sequencing data. Nat Methods 7:335–336. doi: 10.1038/nmeth.f.303. [DOI] [PMC free article] [PubMed] [Google Scholar]
- 14.Curtis TP, Sloan WT, Scannell JW. 2002. Estimating prokaryotic diversity and its limits. Proc Natl Acad Sci U S A 99:10494–10499. doi: 10.1073/pnas.142680199. [DOI] [PMC free article] [PubMed] [Google Scholar]
- 15.Schloss PD, Girard RA, Martin T, Edwards J, Thrash JC. 2016. Status of the archaeal and bacterial census: an update. mBio 7:e00201-. doi: 10.1128/mBio.00201-16. [DOI] [PMC free article] [PubMed] [Google Scholar]
- 16.Kim M, Oh H-S, Park S-C, Chun J. 2014. Towards a taxonomic coherence between average nucleotide identity and 16S rRNA gene sequence similarity for species demarcation of prokaryotes. Int J Syst Evol Microbiol 64:346–351. doi: 10.1099/ijs.0.059774-0. [DOI] [PubMed] [Google Scholar]
- 17.Yarza P, Yilmaz P, Pruesse E, Glöckner FO, Ludwig W, Schleifer K-H, Whitman WB, Euzéby J, Amann R, Rosselló-Móra R. 2014. Uniting the classification of cultured and uncultured bacteria and archaea using 16S rRNA gene sequences. Nat Rev Microbiol 12:635–645. doi: 10.1038/nrmicro3330. [DOI] [PubMed] [Google Scholar]
- 18.Eren AM, Maignien L, Sul WJ, Murphy LG, Grim SL, Morrison HG, Sogin ML. 2013. Oligotyping: differentiating between closely related microbial taxa using 16S rRNA gene data. Methods Ecol Evol 4:1111–1119. doi: 10.1111/2041-210X.12114. [DOI] [PMC free article] [PubMed] [Google Scholar]
- 19.Thompson JR, Pacocha S, Pharino C, Klepac-Ceraj V, Hunt DE, Benoit J, Sarma-Rupavtarm R, Distel DL, Polz MF. 2005. Genotypic diversity within a natural coastal bacterioplankton population. Science 307:1311–1313. doi: 10.1126/science.1106028. [DOI] [PubMed] [Google Scholar]
- 20.Goris J, Konstantinidis KT, Klappenbach JA, Coenye T, Vandamme P, Tiedje JM. 2007. DNA-DNA hybridization values and their relationship to whole-genome sequence similarities. Int J Syst Evol Microbiol 57:81–91. doi: 10.1099/ijs.0.64483-0. [DOI] [PubMed] [Google Scholar]
- 21.Caro-Quintero A, Konstantinidis KT. 2012. Bacterial species may exist, metagenomics reveal. Environ Microbiol 14:347–355. doi: 10.1111/j.1462-2920.2011.02668.x. [DOI] [PubMed] [Google Scholar]
- 22.Pei AY, Oberdorf WE, Nossa CW, Agarwal A, Chokshi P, Gerz EA, Jin Z, Lee P, Yang L, Poles M, Brown SM, Sotero S, DeSantis T, Brodie E, Nelson K, Pei Z. 2010. Diversity of 16S rRNA genes within individual prokaryotic genomes. Appl Environ Microbiol 76:3886–3897. doi: 10.1128/AEM.02953-09. [DOI] [PMC free article] [PubMed] [Google Scholar]
- 23.Fraser C, Hanage WP, Spratt BG. 2007. Recombination and the nature of bacterial speciation. Science 315:476–480. doi: 10.1126/science.1127573. [DOI] [PMC free article] [PubMed] [Google Scholar]
- 24.Armougom F, Bitam I, Croce O, Merhej V, Barassi L, Nguyen T-T, La Scola B, Raoult D. 2016. Genomic insights into a new Citrobacter koseri strain revealed gene exchanges with the virulence-associated Yersinia pestis pPCP1 plasmid. Front Microbiol 7:340. doi: 10.3389/fmicb.2016.00340. [DOI] [PMC free article] [PubMed] [Google Scholar]
- 25.Schüler W, Bunikis I, Weber-Lehman J, Comstedt P, Kutschan-Bunikis S, Stanek G, Huber J, Meinke A, Bergström S, Lundberg U. 2015. Complete genome sequence of Borrelia afzelii K78 and comparative genome analysis. PLoS One 10:e0120548. doi: 10.1371/journal.pone.0120548. [DOI] [PMC free article] [PubMed] [Google Scholar]
- 26.Wattam AR, Williams KP, Snyder EE, Almeida NF, Shukla M, Dickerman AW, Crasta OR, Kenyon R, Lu J, Shallom JM, Yoo H, Ficht TA, Tsolis RM, Munk C, Tapia R, Han CS, Detter JC, Bruce D, Brettin TS, Sobral BW, Boyle SM, Setubal JC. 2009. Analysis of ten Brucella genomes reveals evidence for horizontal gene transfer despite a preferred intracellular lifestyle. J Bacteriol 191:3569–3579. doi: 10.1128/JB.01767-08. [DOI] [PMC free article] [PubMed] [Google Scholar]
- 27.Parks DH, Rinke C, Chuvochina M, Chaumeil P-A, Woodcroft BJ, Evans PN, Hugenholtz P, Tyson GW. 2017. Recovery of nearly 8,000 metagenome-assembled genomes substantially expands the tree of life. Nat Microbiol 2:1533–1542. doi: 10.1038/s41564-017-0012-7. [DOI] [PubMed] [Google Scholar]
- 28.Delmont TO, Quince C, Shaiber A, Esen OC, Lee STM, Lucker S, Eren AM. 2017. Nitrogen-fixing populations of Planctomycetes and Proteobacteria are abundant in the surface ocean. bioRxiv https://www.biorxiv.org/content/early/2017/04/23/129791. [DOI] [PMC free article] [PubMed]
- 29.Brown CT, Hug LA, Thomas BC, Sharon I, Castelle CJ, Singh A, Wilkins MJ, Wrighton KC, Williams KH, Banfield JF. 2015. Unusual biology across a group comprising more than 15% of domain Bacteria. Nature 523:208–211. doi: 10.1038/nature14486. [DOI] [PubMed] [Google Scholar]
- 30.Rinke C, Schwientek P, Sczyrba A, Ivanova NN, Anderson IJ, Cheng J-F, Darling A, Malfatti S, Swan BK, Gies EA, Dodsworth JA, Hedlund BP, Tsiamis G, Sievert SM, Liu W-T, Eisen JA, Hallam SJ, Kyrpides NC, Stepanauskas R, Rubin EM, Hugenholtz P, Woyke T. 2013. Insights into the phylogeny and coding potential of microbial dark matter. Nature 499:431–437. doi: 10.1038/nature12352. [DOI] [PubMed] [Google Scholar]
- 31.Pruitt KD, Tatusova T, Maglott DR. 2005. NCBI Reference Sequence (RefSeq): a curated non-redundant sequence database of genomes, transcripts and proteins. Nucleic Acids Res 33:D501–D504. doi: 10.1093/nar/gki025. [DOI] [PMC free article] [PubMed] [Google Scholar]
- 32.Quinlan AR, Hall IM. 2010. BEDTools: a flexible suite of utilities for comparing genomic features. Bioinformatics 26:841–842. doi: 10.1093/bioinformatics/btq033. [DOI] [PMC free article] [PubMed] [Google Scholar]
- 33.Rodriguez-R LM, Konstantinidis KT. 2016. The enveomics collection: a toolbox for specialized analyses of microbial genomes and metagenomes. e1900v1. PeerJ PrePrints 4:e1900v1. doi: 10.7287/peerj.preprints.1900v1. [DOI] [Google Scholar]
- 34.Rice P, Longden I, Bleasby A. 2000. EMBOSS: The European Molecular Biology Open Software Suite. Trends Genet 16:276–277. doi: 10.1016/S0168-9525(00)02024-2. [DOI] [PubMed] [Google Scholar]
- 35.Hartmann M, Howes CG, Abarenkov K, Mohn WW, Nilsson RH. 2010. V-Xtractor: an open-source, high-throughput software tool to identify and extract hypervariable regions of small subunit (16S/18S) ribosomal RNA gene sequences. J Microbiol Methods 83:250–253. doi: 10.1016/j.mimet.2010.08.008. [DOI] [PubMed] [Google Scholar]
- 36.Rand WM. 1971. Objective criteria for the evaluation of clustering methods. J Am Stat Assoc 66:846–850. [Google Scholar]
- 37.Hubert L, Arabie P. 1985. Comparing partitions. J Classif 2:193–218. doi: 10.1007/BF01908075. [DOI] [Google Scholar]


