Abstract
Mast cells are important effector cells of the immune system, and mast cell-derived exosomes carrying RNAs play a role in immune regulation. However, the molecular function of mast cell-derived exosomes is currently unknown, and here, we identify differentially expressed genes (DEGs) in mast cells and exosomes. We isolated mast cells derived exosomes through differential centrifugation and screened the DEGs from mast cell-derived exosomes, using the GSE25330 array dataset downloaded from the Gene Expression Omnibus database. Biochemical pathways were analyzed by Gene ontology (GO) annotation and Kyoto Encyclopedia of Genes and Genomes (KEGG) pathway on the online tool DAVID. DEGs-associated protein-protein interaction networks (PPIs) were constructed using the STRING database and Cytoscape software. The genes identified from these bioinformatics analyses were verified by qRT-PCR and Western blot in mast cells and exosomes. We identified 2121 DEGs (843 up and 1278 down-regulated genes) in HMC-1 cell-derived exosomes and HMC-1 cells. The up-regulated DEGs were classified into two significant modules. The chemokine receptor CCR1 was screened as a hub gene and enriched in cytokine-mediated signaling pathway in module one. Seven genes, including CCR1, CD9, KIT, TGFBR1, TLR9, TPSAB1 and TPSB2 were screened and validated through qRT-PCR analysis. We have achieved a comprehensive view of the pivotal genes and pathways in mast cells and exosomes and identified CCR1 as a hub gene in mast cell-derived exosomes. Our results provide novel clues with respect to the biological processes through which mast cell-derived exosomes modulate immune responses.
Keywords: Mast cells, exosomes, differentially expressed genes, bioinformatical analysis
Introduction
Exosomes are nano-sized, endosome-derived vesicles that ranging in diameter from 30-150 nm in. These vesicles are released into the extracellular environment by a variety of cell types, including immune cells, stem cells, neurons, tumor cells and other cell types [1]. Exosomes have been found in body fluids, including saliva [2], blood plasma [3], urine [4], breast milk [2], and cerebrospinal fluid [5]. Exosomes have an outer lipid bilayer that encapsulates multiple proteins, mRNAs and microRNAs [6], and can actively transfer this molecular information to neighboring cells or distant organs. In addition, exosomes can shuttle functional RNAs from one mast cell to another [6]. In recent years, the immunological function of exosomes has been extensively studied and exosomes have been found to play roles in T cell activation, Th2 cell differentiation [7], and tolerance development [8]. Furthermore, dendritic cell-derived exosomes can trigger potent antigen-specific antitumor immune responses [9], epithelial cell-derived exosomes can enhance proliferation and chemotaxis of undifferentiated macrophages during asthmatic inflammation [10], and Treg cells suppress Th1 cell responses through a nonautonomous gene silencing process that is mediated by microRNA-containing exosomes [11]. All in all, these findings underscore the properties of exosomes as powerful tools for intercellular communication.
Mast cells are important effector cells of the immune system that have been suggested to participate in the pathophysiology of anaphylaxis [12], asthma [13], tumors [14,15], autoimmune disease [16,17], inflammatory disease [18], lymphomas [19], and other disorders. Mast cell-derived exosomes carrying RNAs have also been found to play a role in immune regulation, and the functions of mast cell-derived exosomes in B cells, T cells, DCs, lung cancer, and hepatocellular carcinomas have been studied extensively. Exosomes released from mast cells, upon exposure to oxidative stress, have the capacity to induce oxidative stress tolerance in other cells. The mRNA content of exosomes produced under oxidative stress differs extensively from that of exosomes produced under normal conditions [20]. A recent study has shown that exosomes derived from bone marrow mast cells (BMMCs) can bind to free IgE via FcεRI and exhibit an anti-IgE effect, which results in decreased IgE levels and inhibition of mast cells activation. This effect was also validated in a mouse model of allergic asthma [21] and implies that mast cell-derived exosomes have the potential to be developed into a novel anti-IgE agent. The functions of mast cell-derived exosomes are mainly dependent on the content of exosomes, although the functions of exosomes are not completely understood. Furthermore, the differentially expressed genes (DEGs) between mast cell-derived exosomes and mast cells have not been investigated.
The purpose of this study is to identify vital DEGs and pathways that are important for the function of mast cell-derived exosomes. We downloaded an original microarray datasets GSE25320 [8] from the Gene Expression Omnibus (GEO) database and performed gene ontology annotation and pathway enrichment analyses and constructed protein-protein interaction (PPI) network to identify DEGs. We identified mast cell exosome-enriched biological functions and pivotal pathways and discovered differentially expressed genes that we subsequently verified by qRT-PCR and Western blot. Our results provide insight into the roles of mast cell exosomal RNAs in immunoreactions and disease.
Materials and methods
Mice
Male Wild-type(WT) BALB/c mice, at four weeks of age, were purchased from Shanghai Sippr/BK Laboratory Animal Co. Ltd and housed in a specific pathogen-free environment. All animal experiments were carried out under the approval of the Institutional Review Board of the Shanghai General Hospital, Shanghai JiaoTong University School of Medicine, and the serial number for our study is “2017KY214”.
Cell culture
The human mast cell line HMC-1 was maintained at 37°C, with 5% CO2, and 95% humidity, in RPMI 1640 medium supplemented with 10% exosomes-free FBS and 100 units per milliliter of penicillin/streptomycin.
Bone marrow mast cells (BMMCs) were prepared as previously described. In brief, male BALB/c mice (Shanghai Sippr-BK Laboratory Animal Co. Ltd) were housed in specific pathogen-free conditions in the Animal Experimental Center of Shanghai General Hospital. All protocols for animal experiments were approved by the Animal Ethics Committee of Shanghai General Hospital, Shanghai Jiao Tong University School of Medicine (Shanghai, China). Specific steps are as follows. Firstly, the mice were euthanized by neck dislocalisation. The femurs and tibias were removed the muscle tissue and flushed with RPMI-1640 complete medium: RPMI-1640 supplemented with 10% heat-inactivated FBS, 1% Penicillin-Streptomycin, 2 mM L-glutamine, 1 mM sodium pyruvate, and 0.1 mM nonessential amino acids. The cells were collected and resuspended with complete medium, enriched with 10 ng/mL rmIL-3 (PeproTech, Rocky Hill, NJ, USA) and 20 ng/mL rmSCF (PeproTech, Rocky Hill, NJ, USA). Next, the cell concentration was adjusted to 1×10⁶ cells/mL, the cells were incubated for 4-6 weeks at 37°C in a humidified atmosphere with 5% CO2, and the culture medium was replaced weekly. Mast cell phenotype was confirmed through the expression levels of KIT and IgE high affinity receptor (FcεRI) by flow cytometry.
Isolation and identification of exosomes
Exosomes were isolated from the supernatant of HMC-1 cells and BMMCs by differential centrifugation as previously described [22]. In brief, the initial steps were designed to eliminate large dead cells and large cell debris through successive centrifugation at 300× g for 10 min, 2000× g for 10 min, and 10000× g for 30 min. In each step, the pellets were discarded and the supernatants were used for the following steps. Next, to pellet exosomes, the supernatant was pelleted through ultracentrifugation at 100000× g for 70 min. Exosomes were washed in a large volume of PBS followed by ultracentrifugation at 100000× g for 70 minutes to eliminate contaminated proteins.
Exosome morphology was identified through transmission electron microscopy (TEM, FEI Tecnai 12, Philips, Netherlands). 20 μL of freshly isolated exosome solution was adsorbed onto 200 mesh copper grids for 1 min, and stained with a 2% uranyl acetate solution for 1 min, and dried under a half-watt lamp. Images were taken with a pixel size of 0.3 nm and a direct magnification of 67,000× using an Gatan CCD camera. The size distribution and number of exosomes were calculated by nanoparticle tracking analysis (NTA) using a ZetaView PMX 110 (Particle Metrix, Meerbusch, Germany) equipped with fast video capture and particle tracking software. The expression of the mast cells exosomal makers TSG101 (Abcam, USA) and CD63 (Abcam, USA) was analyzed using Western blot. All experiments were independently repeated three times.
Microarray data information and DEGs identification
The GSE25320 array data was downloaded from the Gene Expression Omnibus (GEO) database (http://www.ncbi.nlm.nih.gov/geo/). This dataset based on the GPL570 platform (Affymetrix Human Genome U133 Plus 2.0 Array, Affymetrix, Santa Clara, CA, USA) was contributed by Karin et al [8], and comprised 11 samples, including four HMC-1 exosomal RNA samples, four HMC-1 cell RNA samples, and three HMC-1 exosomal versus HMC-1 cell miRNA samples. In our study, the four HMC-1 exosomal RNA samples and four HMC-1 cell RNA samples were used for analysis.
The raw data were preprocessed by Bioconductor R packages (Seattle, Washington), and the preprocessing included background correction, normalization, and calculation of gene expression. The limma package [23] was used to perform the differential analyses, and |log2 fold change (FC)| >2 and adjusted P<0.01 were considered as statistically significant.
Gene ontology (GO) and pathway enrichment analyses
Gene ontology (GO) is a tool for gene annotation that uses a defined, structured, and controlled vocabulary [24]. The Kyoto Encyclopedia of Genes and Genomes (KEGG) is a database used to assign sets of DEGs to specific pathways [25].
The online Database for Annotation, Visualization and Integrated Discovery (DAVID; https://david.ncifcrf.gov) is an exploratory visualization tool for gene biological function analyses. Functional and pathways enrichments of candidate DEGs were analyzed using DAVID, with gene counts ≥5 and a P<0.05 set as threshold values.
Protein-protein interaction (PPI) network construction of DEGs and modules selection
In order to reveal the protein-protein interaction network (PPI) of DEGs, we made use of the STRING online database (Available online: http://string-db.org) [26]. Integrated scores >0.95 and all upregulated DEGs with integrated scores >0.7 were chosen for the PPI network construction. Constructed PPI networks were visualized using Cytoscape software [27]. Furthermore, to select hub genes from the PPI network, cluster analysis was performed using the Cluster ONE plug-in of Cytoscape [28] with default parameters and P<0.01. GO-Biological Process (BP) terms and KEGG pathway enrichment analyses of modular genes were implemented using DAVID.
Total RNA extraction, cDNA synthesis, and qRT-PCR
To confirm that genes were differentially expressed in exosomes and mast cell samples, qRT-PCR was performed using iQSYBR Green real-time PCR master mix (Bio-Rad, Hercules, CA) on the Applied Biosystems StepOneTM Real-Time PCR System. Briefly, total RNAs were extracted from exosomes and mast cells using Trizol reagent (Invitrogen, Carlsbad, CA). First-strand cDNAs were synthesized from 1 μg of total RNA from the exosome or mast cell samples, using the iScript cDNA synthesis kit (Bio-Rad, Hercules, CA) following manufacturer-provided protocols. Gene-specific primers for human and mouse candidate genes (Table 1) were designed using the Primer Bank (https://pga.mgh.harvard.edu/primerbank/). The mean threshold cycle number (CT values) of target genes were normalized to endogenous GAPDH and calculated using the 2-ΔΔCt method [29,30]. After normalization to GAPDH gene expression levels, ratios were expressed as fold-changes, in comparison with respective expression levels in the control samples (mast cells as control group, exosomes as case group).
Table 1.
Specific primer sequences
| A, Human | |||
|
| |||
| Gene | Forward (5’-3’) | Reverse (5’-3’) | Amplicon (bp) |
|
| |||
| GAPDH | GGAGCGAGATCCCTCCAAAAT | GGCTGTTGTCATACTTCTCATGG | 197 |
| CCR1 | GACTATGACACGACCACAGAGT | CCAACCAGGCCAATGACAAATA | 128 |
| CD9 | TTCCTCTTGGTGATATTCGCCA | AGTTCAACGCATAGTGGATGG | 172 |
| KIT | CGTTCTGCTCCTACTGCTTCG | CCCACGCGGACTATTAAGTCT | 117 |
| TGFBR1 | ACGGCGTTACAGTGTTTCTG | GCACATACAAACGGCCTATCTC | 101 |
| TLR9 | CTGCCACATGACCATCGAG | GGACAGGGATATGAGGGATTTGG | 121 |
| TPSAB1 | ACCACATTTGTGACGCAAAATAC | CCAGTCCAAGTAGTAGGTGACAC | 245 |
| TPSB2 | GTGAAGGTCCCCATAATGGAAAA | CACAGCATGTCGTCACGGA | 101 |
|
| |||
| B, Mouse | |||
|
| |||
| Gene | Forward (5’-3’) | Reverse (5’-3’) | Amplicon (bp) |
|
| |||
| GAPDH | TGGCCTTCCGTGTTCCTAC | GAGTTGCTGTTGAAGTCGCA | 178 |
| CCR1 | CTCATGCAGCATAGGAGGCTT | ACATGGCATCACCAAAAATCCA | 142 |
| CD9 | ATGCCGGTCAAAGGAGGTAG | GCCATAGTCCAATAGCAAGCA | 103 |
| KIT | AGGCTATCCCTGTTGTGTCTG | ACATGGAGTTCACGGATGTAGA | 111 |
| TGFBR1 | TCTGCATTGCACTTATGCTGA | AAAGGGCGATCTAGTGATGGA | 100 |
| TLR9 | ACAACTCTGACTTCGTCCACC | TCTGGGCTCAATGGTCATGTG | 116 |
| TPSAB1 | GCCAATGACACCTACTGGATG | GCTTACGGAGCTGTACTCTGA | 130 |
| TPAB2 | CTGGCTAGTCTGGTGTACTCG | CCAGGGCCACTTACTCTCA | 93 |
Statistical analysis
All qRT-PCR amplifications were performed in triplicate. Relative mRNA levels of genes and GAPDH control between mast cell and mast cell-derived exosomes were quantified by the comparative 2-ΔΔCt method using the student’s t-test, and differences with P<0.05 were considered statistically significant. Expression of genes by qRT-PCR was analyzed using GraphPad prism 5 software.
Results
Characteristics of bone marrow mast cells and their exosomes
In order to more effectively validate differentially expressed genes by the bioinformatics analyses, we cultured mouse bone marrow-derived mast cells (BMMCs) and extracted exosomes. Figure 1A presents the morphology of BMMCs, which contain a large number of purple granules by toluidine blue staining. Flow cytometry analysis identified KIT and FcεRI expression on BMMCs and suggested that over 95% of the cells were mast cells. Mast cell-derived exosomes were isolated by differential centrifugation, and electron microscopy analysis revealed that exosomes derived from HMC-1 cells and BMMCs were 30-150 nm in diameter and displayed vesicular round structures (Figure 1B). The size distribution of mast cell-derived exosomes revealed an abundance of smaller vesicles in the range of 50-150 nm (Figure 1C), and western blot analysis indicated that the exosomes expressed TSG101 and CD63 (Figure 1D). The results show that TSG101 has not significant differences in cells and exosome expression, while CD63 is enriched in exosomes but a little in cell lysates. Taken together, our data confirms that the isolated extracellular vesicles are indeed exosomes.
Figure 1.
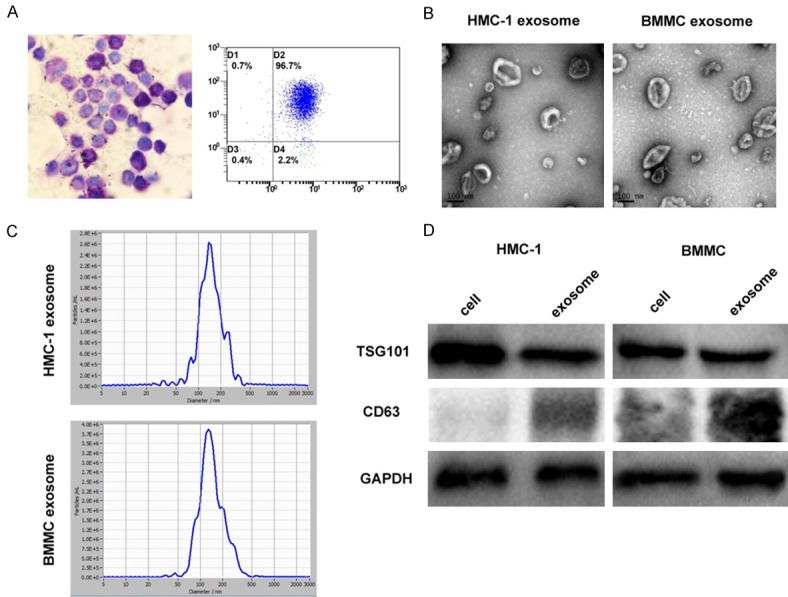
Identification and characterization of mast cell-derived exosomes. A. Bone marrow mast cells (BMMCs) show a large number of purple-red granules following toluidine blue staining (400×). CD117 and IgE high affinity receptor (FcεRI) on BMMCs were detected by flow cytometry. B. Mast cell exosomes were isolated through differential centrifugation. Transmission electron micrographs of the isolated exosomes revealed rounded structures with a diameter of approximately 30-150 nm. C. The average size of exosomes was measured by Nanoparticle Tracking analysis (NTA). D. Western blot analysis of the exosomes shows the presence of the exosomal marker proteins TSG101 and CD63. The results show that TSG101 has not significant differences in cells and exosome expression, while CD63 is enriched in exosomes but a little in cell lysates.
Data preprocessing and DEG analysis
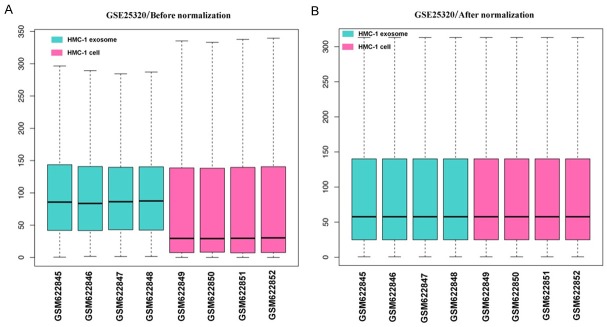
The boxplots of samples before and after normalization are presented in Figure 2. Our results indicate that the expression levels of each sample were similar after data normalization.
Figure 2.
Box plot of expression data before and after normalization. The lateral axis represents names of samples and the longitudinal axis represents expression levels. The black line in each box represents the expression levels of each sample. (A) Data before normalization and (B) data after normalization.
A total of 2121 DEGs (Table S1) (843 up and 1278 down-regulated) were identified between HMC-1 exosomes RNA samples and RNA samples from HMC-1 cells RNA with P<0.01 and |log2 FC| >2. The top 100 up-regulated and down-regulated genes are shown in Table 2. Volcano plots are presented in Figure 3 and heat map by clustering analysis are presented in Figure 4.
Table 2.
2121 differentially expressed genes (DEGs) were identified from GSE25320, including 843 up-regulated genes and 1278 down-regulated genes in HMC-1 exosome, compared to HMC-1 cell (The top100 up-regulated genes were listed, and top100 down-regulated were listed)
| DEGs | Genes Name |
|---|---|
| Up-regulated | ZNF595, ZNF160, ZC3H7B, NLN, MZT2B, FKSG49, FBXW12, DBT, CMBL, CCDC152, ATP8B1, SLC35E1, DDX59, SLC22A3, RASEF, PRDX2, PGF, HAUS2, FAM63A, FAM161B, CDK13, XRCC2, TCF7, SCD5, MIR7113, SERPINB6, PRR11, UACA, FOXQ1, NUMBL, ZNF721, RPS11, APOPT1, ACPT, C9orf64, NPY, RPL27A, ARHGEF1, POLR1B, ZNF611, RNF183, OCIAD1, SLC25A16, ERVH-1, CNTD2, ADAM33, DLGAP4, GGT1, UBXN2A, SPG21, SH2B2, AVIL, ALMS1, RIOK3, MB21D1, TRIM16L, FGFR1, DAPP1, ATF7IP, UBE2D4, PRINS, HEY1, SFTPB, KRTAP8-1, KIAA0556, ANAPC16, COLCA1, TMEM241, GZMK, SPRR4, OR7E104P, OPHN1, OR7E37P, IGKV1OR2-118, APOBEC2, PIGT, PAPPA2, SYT6, GTSE1, FMO2, EDAR, SP2-AS1, PODNL1, AVPI1, ZNF536, FAM106A, S1PR4, TSR1, D21S2088E, ABLIM2, WDPCP, EXOC3L2, SPATA24, PAX2, MYO1C, PRKAG3, FBXW9, CLDN19, XAGE2, PRKAR2A |
| Down-regulated | HSPA5, IGFBP2, MAP3K8, PSMB8, TCIRG1, TPST2, UBE2M, AGO2, EMC9, PKD1P1, GRN, NCAPH, RBM10, SLC39A10, UBAC2, CERS4, COX2, IL3, JOSD1, NRROS, FBLN2, HSPA13, WHAMM, ZFAND2B, ISL2, APOBR, CCL2, PSAP, ATP2A3, FOS, NDUFAF1, SNORA11E, TPSB2, ND4, COX1, LIG1, HLA-A, MIR6849, TMED10, ZNF77, TST, KIRREL2, ZNF189, HCG11, ITGA2B, ORC3, POR, GPS1, LIPA, PCOLCE, SLC39A6, SLC3A2, NCAPD3, NSUN5P1, AK1, CES4A, ERI3, GATAD1, GORASP1, TNF, RANGRF, ATP6AP1, FAM219A, FNBP1L, ND2, SERINC1, SLC6A6, TMEM117, SMAD7, SGK1, MTMR6, TACC3, PPFIA4, ZNF638-IT1, IL32, CDC37, RHOB, PRCC, DNMT1, SAC3D1, WAPL, ARGLU1, ITM2B, PAG1, ETFB, TPP1, SLC2A3, TRIM33, UBAC1, FAM64A, EBLN3P, FOSB, ATP6V1E2, CDKN1B, PWAR6, ERI1, MTFR1L, P4HB, CEP192, NAGK |
Figure 3.
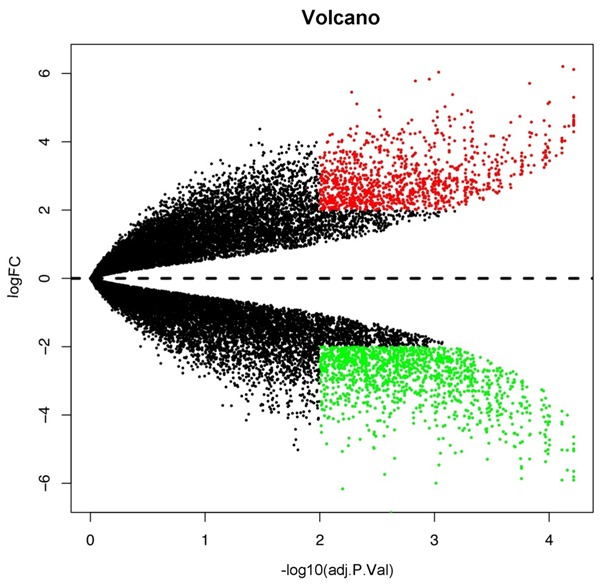
Volcano plot of differentially expressed genes in HMC-1 exosomes and cells. Red, significantly upregulated genes; green, significantly down-regulated genes. FC, fold change.
Figure 4.
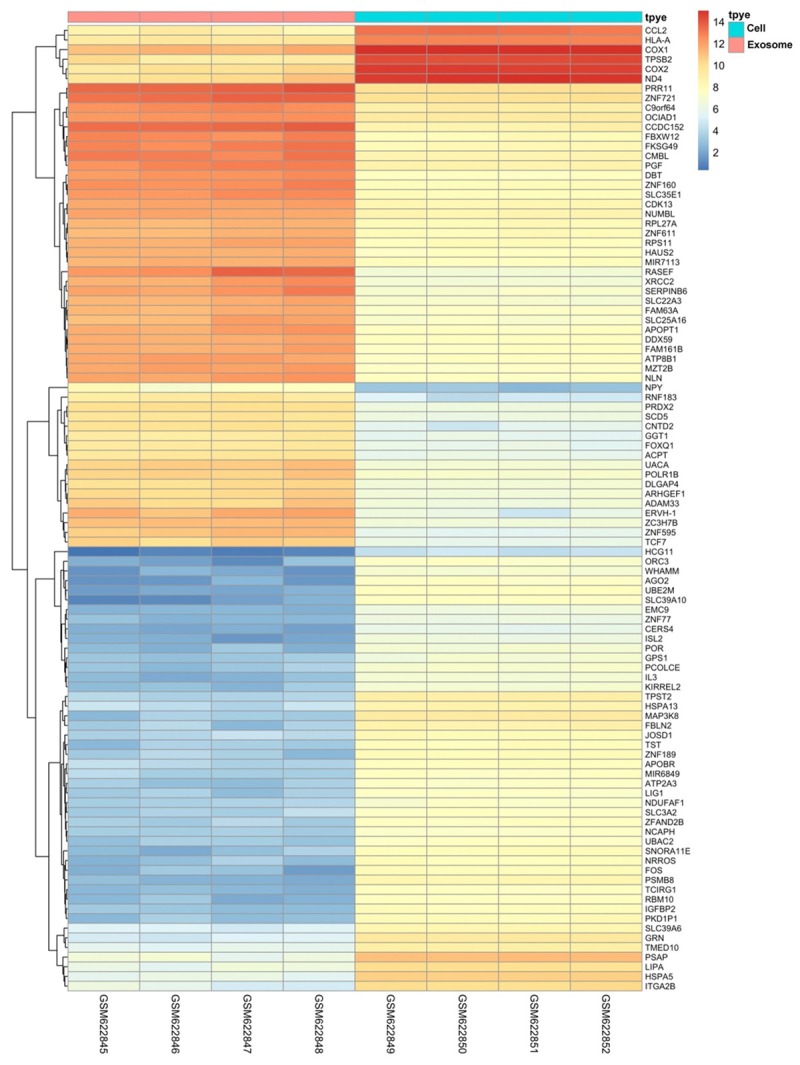
Heat map of the top 100 differentially expressed genes.
GO and pathway enrichment analyses
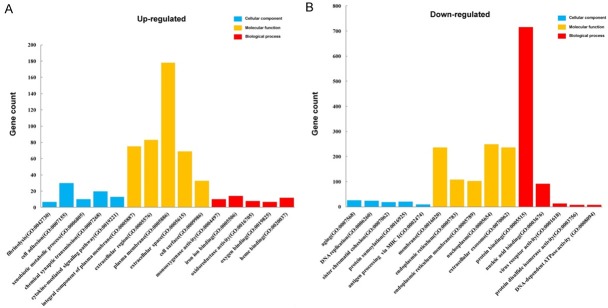
To functionally classify DEGs from up-regulated and down-regulated clusters, we performed GO and KEGG pathway analyses. The top five GO terms from the functional classification are presented in Table 3. As shown in Figure 5, in the biological process group, up-regulated DEGs were mainly enriched in the GO terms of fibrinolysis, chemical synaptic transmission, xenobiotic metabolic process, cell adhesion, and cytokine-mediated signaling pathway. Furthermore, down-regulated DEGs were primarily associated with the protein sumoylation, DNA replication, aging, sister chromatid cohesion, antigen processing, and presentation of peptide antigen via MHC class I categories. In the cellular component group, up-regulated genes were enriched in integral component of plasma membrane, extracellular region, plasma membrane, extracellular space, and cell surface terms, while the down-regulated genes were enriched in membrane, endoplasmic reticulum, endoplasmic reticulum membrane, nucleoplasm, and extracellular exosome components. Moreover, in the molecular function group, up-regulated genes were enriched in monooxygenase activity, iron ion binding, oxidoreductase activity, oxygen binding, and heme binding functions, and down-regulated genes were enriched in protein binding, nucleic acid binding, virus receptor, protein disulfide isomerase, and DNA-dependent ATPase activities.
Table 3.
GO analysis of DEGs (P<0.05)
| GO ID | Term | Count | P-Value |
|---|---|---|---|
| Up-regulated | |||
| GO-BP terms | |||
| GO:0042730 | Fibrinolysis | 7 | 6.52×10⁻⁵ |
| GO:0007268 | Chemical synaptic transmission | 20 | 9.08×10⁻⁴ |
| GO:0006805 | Xenobiotic metabolic process | 10 | 1.67×10⁻³ |
| GO:0007155 | Cell adhesion | 30 | 1.89×10⁻³ |
| GO:0019221 | Cytokine-mediated signaling pathway | 13 | 2.34×10⁻³ |
| GO-CC terms | |||
| GO:0005887 | Integral component of plasma membrane | 75 | 3.72×10⁻⁴ |
| GO:0005576 | Extracellular region | 83 | 4.00×10⁻⁴ |
| GO:0005886 | Plasma membrane | 178 | 1.49×10⁻³ |
| GO:0005615 | Extracellular space | 69 | 1.60×10⁻³ |
| GO:0009986 | Cell surface | 33 | 3.09×10⁻³ |
| GO-MF terms | |||
| GO:0004497 | Monooxygenase activity | 10 | 1.49×10⁻⁴ |
| GO:0005506 | Iron ion binding | 14 | 2.41×10⁻³ |
| GO:0016705 | Oxidoreductase activity | 8 | 3.25×10⁻³ |
| GO:0019825 | Oxygen binding | 7 | 5.20×10⁻³ |
| GO:0020037 | Heme binding | 12 | 7.68×10⁻³ |
| Down-regulated | |||
| GO-BP terms | |||
| GO:0016925 | Protein sumoylation | 21 | 7.10×10⁻⁵ |
| GO:0006260 | DNA replication | 24 | 1.98×10⁻⁴ |
| GO:0007568 | Aging | 25 | 1.99×10⁻⁴ |
| GO:0007062 | Sister chromatid cohesion | 18 | 3.72×10⁻⁴ |
| GO:0002474 | Antigen processing and presentation of peptide antigen via MHC class I | 9 | 5.38×10⁻⁴ |
| GO-CC terms | |||
| GO:0016020 | Membrane | 237 | 3.34×10⁻¹⁷ |
| GO:0005783 | Endoplasmic reticulum | 108 | 1.19×10⁻¹² |
| GO:0005789 | Endoplasmic reticulum membrane | 103 | 6.94×10⁻¹⁰ |
| GO:0005654 | Nucleoplasm | 249 | 6.88×10⁻⁹ |
| GO:0070062 | Extracellular exosome | 236 | 3.15×10⁻⁶ |
| GO-MF terms | |||
| GO:0005515 | Protein binding | 716 | 1.01×10⁻¹⁷ |
| GO:0003676 | Nucleic acid binding | 91 | 9.96×10⁻⁴ |
| GO:0001618 | Virus receptor activity | 13 | 1.96×10⁻³ |
| GO:0003756 | Protein disulfide isomerase activity | 7 | 2.44×10⁻³ |
| GO:0008094 | DNA-dependent ATPase activity | 8 | 4.21×10⁻³ |
GO, gene ontology; BP, biological process; CC, Cell Component; MF, molecular function.
Figure 5.
Gene Ontology analysis and significant enriched GO terms of up-regulated. (A) and down-regulated (B) DEGs in HMC-1 exosomes and HMC-1 cells.
KEGG pathways enrichments of DEGs are presented in Table 4 and Figure 6. The upregulated DEGs were enriched in circadian entrainment, chemical carcinogenesis, cell adhesion molecules (CAMs), neuroactive ligand-receptor interaction, and drug metabolism-cytochrome P450 pathways, while down-regulated DEGs were enriched in lysosome, protein processing in endoplasmic reticulum, cell cycle, Epstein-Barr virus infection, and mismatch repair pathways.
Table 4.
Pathway enrichment analysis for DEGs (top five pathways)
| KEGG ID | Pathway | Count | P-value | Genes |
|---|---|---|---|---|
| Up-regulated DEGs | ||||
| hsa04713 | Circadian entrainment | 9 | 0.01347155 | GNAO1, ADCY2, PLCB4, NOS1AP, GRIN2A, GUCY1A3, ADCY10, CAMK2A, PLCB2 |
| hsa05204 | Chemical carcinogenesis | 8 | 0.016721213 | CYP3A4, CYP3A5, CYP1B1, ADH4, KYAT1, CYP1A2, GSTM5, UGT2B28 |
| hsa04514 | Cell adhesion molecules (CAMs) | 11 | 0.019733043 | ALCAM, SIGLEC1, SDC1, CLDN19, NFASC, CTLA4, NLGN2, MADCAM1, CLDN10, HLA-DMB, SPN |
| hsa04080 | Neuroactive ligand-receptor interaction | 17 | 0.021992572 | GPR156, F2RL2, GABRB2, NPY2R, DRD5, LHCGR, GABRA5, GRIN2A, BRS3, PLG, P2RY4, LPAR6, S1PR4, HTR6, AVPR1B, HTR2A, GRID1 |
| hsa00982 | Drug metabolism-cytochrome P450 | 7 | 0.025033146 | CYP3A4, CYP3A5, ADH4, FMO2, CYP1A2, GSTM5, UGT2B28 |
| Down-regulated DEGs | ||||
| hsa04141 | Protein processing in endoplasmic reticulum | 33 | 1.25×10⁻⁷ | RAD23B, TRAF2, SEC24B, DERL2, GANAB, PDIA3, RAD23A, RNF185, PDIA6, EDEM3, LMAN1, SEC62, EDEM1, SEC63, SSR1, STT3B, BAK1, ERO1A, HSPA6, YOD1, HSPA5, RPN2, SEC61A1, SEC23A, P4HB, MAN1A1, HYOU1, BAX, SIL1, NFE2L2, PPP1R15A, EIF2AK3, SEL1L |
| hsa04142 | Lysosome | 26 | 5.64×10⁻⁷ | GNPTG, GM2A, ATP6AP1, LGMN, CTSA, TPP1, GALC, MCOLN1, IDUA, TCIRG1, LAPTM4B, LAPTM4A, LIPA, PSAP, GUSB, CD164, M6PR, CTSV, GNS, LAMP1, LAMP2, IGF2R, SUMF1, CTSD, NEU1, ATP6V0A2 |
| hsa04110 | Cell cycle | 25 | 3.25×10⁻⁶ | MAD1L1, CREBBP, ATR, WEE1, MCM5, TGFB1, CDC25B, MCM6, CDC45, CDKN1B, CDKN2B, CDKN2C, PLK1, CDKN2D, GADD45G, TFDP2, PCNA, SMC1A, CCNA1, GADD45B, ORC1, MYC, CCNA2, ORC2, ORC3 |
| hsa05169 | Epstein-Barr virus infection | 27 | 6.01×10⁻⁴ | TRAF2, NFKBIE, POLR2D, POLR2B, AKT1, IL10RB, HSPA6, CCNA1, CCNA2, MYC, TRAF5, SYK, PIK3CG, CREBBP, HLA-A, HLA-C, POLR3A, HLA-B, HLA-G, TYK2, CDKN1B, PSMC4, PSMD11, MAPK14, CD58, IKBKB, EIF2AK3 |
| hsa03430 | Mismatch repair | 8 | 6.79×10⁻⁴ | POLD4, MSH6, RFC3, RFC2, MSH2, LIG1, POLD1, PCNA |
Figure 6.
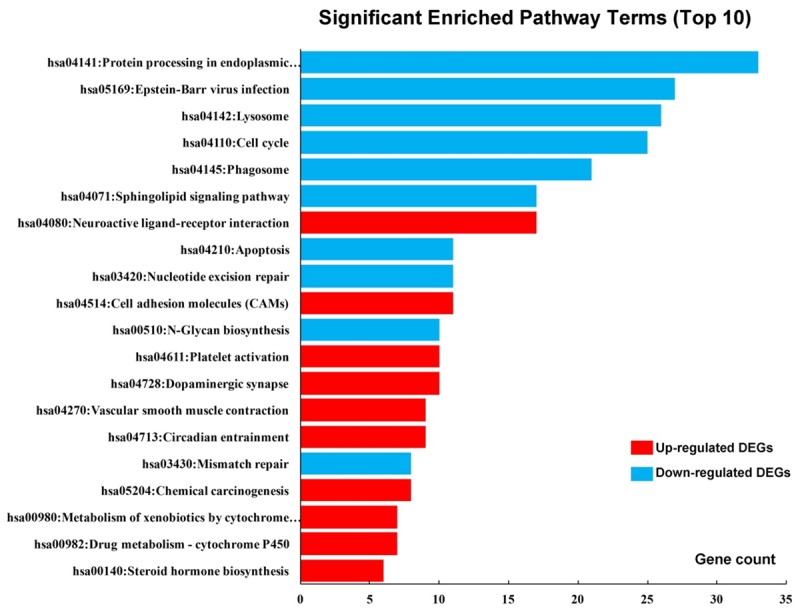
Significantly enriched pathway terms of DEGs. DEGs functional and signaling pathway enrichments were performed using KEGG Pathway online analyses.
Protein-protein interaction Network (PPI) and module analysis
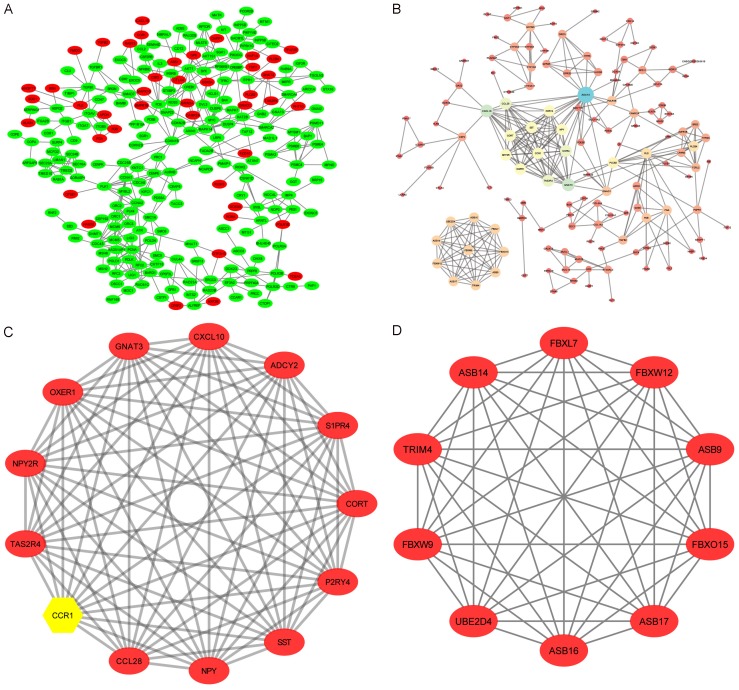
The constructed PPI network of DEGs is shown in Figure 7 and contains 243 nodes and 395 interactions with PPI scores >0.95, based on the STRING database (Figure 7A). Red nodes represent upregulated genes and green nodes represent downregulated genes, while the whole network contains a little of upregulated genes. Next, we constructed a second PPI network for all the up-regulated genes, which are highly expressed in exosomes, with PPI scores >0.7 (Figure 7B), and this network contains 138 nodes and 320 edges. In the upregulated PPI network, the genes with the top ten expression levels were ADCY2, CXCL10, GNAT3, S1PR4, CCL28, TAS2R4, OXER1, P2RY4, CCR1, and CORT (Table 5), and these genes were selected as the hub nodes for exosomes. Two modules (Figure 7C, 7D) that were obtained from the PPI network of all up-regulated DEGs were analyzed further, and the significant GO-BP terms and KEGG pathway enrichment analyses for the genes from each module are presented in Table 6. The GO-BP terms and pathway enrichments for all DEGs in module one included the chemokine signaling pathway, immune response, and chemotaxis, and genes in module two were mainly associated with protein ubiquitination and intracellular signal transduction.
Figure 7.
Protein-protein interaction (PPI) network and modular analysis of DEGs. A. Red nodes represent up-regulated DEGs while green nodes represent the down-regulated genes. B. Another PPI network was constructed for all the up-regulated genes with a PPI score >0.7. C, D. Two modules were obtained from the PPI network of all up-regulated DEGs and CCR1 (yellow) is a hub gene.
Table 5.
Top 10 genes with high node degrees in protein-protein interaction network
| Node | Degree |
|---|---|
| ADCY2 | 23 |
| CXCL10 | 15 |
| GNAT3 | 15 |
| S1PR4 | 13 |
| CCL28 | 13 |
| TAS2R4 | 13 |
| OXER1 | 12 |
| P2RY4 | 12 |
| CCR1 | 12 |
| CORT | 12 |
Table 6.
Significant GO-BP terms and KEGG pathway enrichment analysis of modules genes function
| A, Module 1 | |||
|
| |||
| Term | Description | Count | P-value |
|
| |||
| GO:0007204 | Positive regulation of cytosolic calcium ion concentration | 5 | 1.82×10⁻⁶ |
| GO:0007193 | Adenylate cyclase-inhibiting G-protein coupled receptor signaling pathway | 4 | 4.44×10⁻⁶ |
| hsa04062 | Chemokine signaling pathway | 4 | 2.00×10⁻³ |
| GO:0006955 | Immune response | 4 | 2.90×10⁻³ |
| GO:0006935 | Chemotaxis | 3 | 3.29×10⁻³ |
| hsa04080 | Neuroactive ligand-receptor interaction | 4 | 6.19×10⁻³ |
|
| |||
| B, Module 2 | |||
|
| |||
| Term | Description | Count | P-value |
|
| |||
| GO:0016567 | Protein ubiquitination | 7 | 6.30×10⁻¹⁰ |
| GO:0035556 | Intracellular signal transduction | 4 | 4.47×10⁻⁴ |
Validation of DEGs
To verify our bioinformatic predictions of DEGs from the GEO database, seven differentially-expressed genes (CCR1, CD9, KIT, TGFBR1, TLR9, TPSAB1, and TPSB2) were subjected to qRT-PCR analysis, with three biological replicates for each sample (Figure 8A, 8B). We found that the relative fold changes of these genes were consistent with the results of our bioinformatics analysis (Figure 8C), which suggests that the results from the identified candidate genes are highly reliable. We found that CCR1 and TLR9 levels were up-regulated, while the expression of CD9, KIT, TGFBR1, TPSAB1, and TPSB2 were reduced in mast cell exosomes. Besides, consistent results were obtained from both human and mouse mast cells. Furthermore, we have examined the protein expression level of CCR1 in mast cells and exosomes (Figure 8D). This result shows that CCR1 protein expression levels in mast cell-derived exosomes is higher than mast cells, and the result is consistent with those of qRT-PCR.
Figure 8.
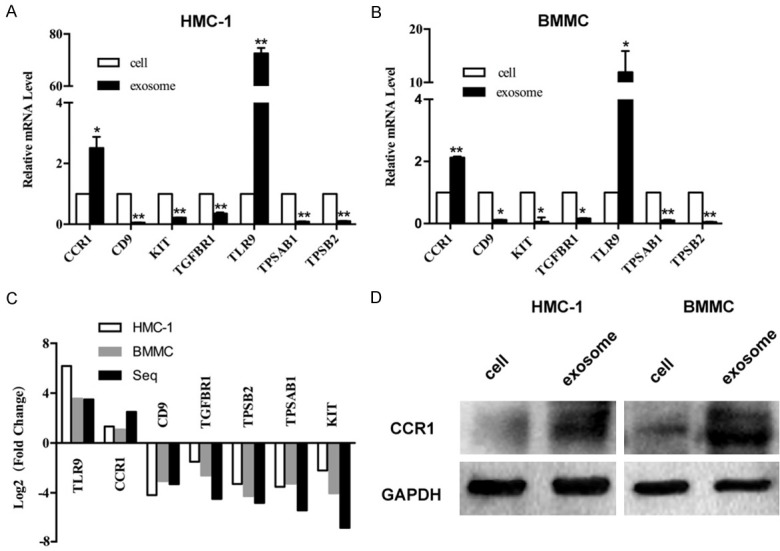
Validation of DEGs in mast cells exosomes. A and B. Quantitative real-time PCR was performed to check fold changes of DEGs in mast cell-derived exosomes and mast cells, *P<0.05, **P<0.01. C. Fold-changes of the mast cells RNAs versus exosomal RNAs were verified by qRT-PCR, which suggested that the results from the identified candidate genes were highly reliable. D. Western blot analysis to confirm the expression levels of CCR1 protein in mast cells and exosomes. The result showed that CCR1 protein expression levels in mast cell-derived exosomes was higher than mast cells. GAPDH was used as internal control.
Discussion
Exosomes from mast cells have been extensively studied as “messengers” that modulate the microenvironment of recipient cells. It has been reported that mast cell-derived exosomes carry the mast cell markers, such as KIT and FcεRI. Our previous study showed that KIT was transferred by mast cells-derived exosomes to promote lung adenocarcinoma cell proliferation and migration [31]. Furthermore, BMMCs exosomes express FcεRI and bind to free IgE, which results in the reduction of IgE levels and subsequent inhibition of mast cell activation via PLCγ1-PKC signaling. BMMCs exosomes also inhibit the development of airway hyperresponsiveness (AHR), airway inflammation, and airway remodeling in mouse models of allergic asthma [21]. These results imply that mast cell-derived exosomes have potential as anti-IgE agents. The above results motivated our current investigation of mast cell-derived exosome contents, which provide a basis for their biological functions, and to determine exosome-specific contents, we investigated DEGs between mast cell exosomes and mast cells, and may help to identify novel mast cell-derived biomarkers and therapeutic targets in some diseases.
From the Affymetrix microarray analysis of Karin et al [8], a total of 2121 DEGs were identified within the GSE25320 array dataset, including 843 genes that were up-regulated and 1278 that were down-regulated in HMC-1 exosomes compared to HMC-1 cells. GO terms and KEGG pathway analyses of DEGs revealed that up-regulated DEGs were enriched in fibrinolysis, chemical synaptic transmission, oxidoreductase activity, and oxygen binding activities, and down-regulated DEGs were enriched in antigen processing and cell cycle functions. Mast cell-derived exosomes participate in the upregulation of DEGs enrichment pathways, although the specific functions of exosomes in such pathways have not been thoroughly investigated. Indeed, mast cell-derived exosomes play a key role in the deposition of fibrin near the site of injury during inflammation. They contain proteins required to attach to endothelial cells, and may be activated by thrombin [32]. Interestingly, mast cells and neurons can communicate with each other through exosomes, and mast cell-derived exosomes have been found to stimulate the sensory nerve endings to release substance P, which activates mast cells [33]. From our enrichment analysis of down-regulated DEGs, we suspect that mast cells can participate in antigen processing [34] and the cell cycle [35].
Furthermore, our PPI results showed that the whole network contained a little of upregulated genes (Figure 7A), and therefore we constructed another PPI network for all up-regulated genes (Figure 7B). To select hub genes from the PPI network, cluster analysis was performed using the Cluster ONE plug-in in Cytoscape, and the two most significant modules were filtered from the PPI network complex. Module one (Figure 7C) was enriched in chemokine signaling pathway and immune response, and genes in module two (Figure 7D) were predominantly associated with protein ubiquitination and intracellular signal transduction. Among these potential genes, we found an interesting molecule, CC chemokine receptor (CCR1), from module one that CC has been reported, along with FcεRI, to be expressed on the surface of mast cells [36-38]. In vitro, costimulation of FcεRI and CCR1 results in greater mast cells degranulation than does stimulation of either receptor alone [39]. In addition, CCL3/MIP-1α has critical roles in regulating mast cells in ocular allergic disease, and exerts its effects on the maturation and activation of mast cells through binding CCR1 [40]. Notably, in comparison with mast cells, we found that CCR1 was up-regulated in mast cell-derived exosomes in our study, which implies that CCR1-rich mast cell-derived exosomes may transfer CCR1 to other mast cells, thus the allergic responses that are mediated by mast cells.
Experimental validation is necessary to confirm the predictions of bioinformatic analyses. We validated seven DEGs (CCR1, CD9, KIT, TGFBR1, TLR9, TPSAB1, and TPSB2) by qRT-PCR and western blot analyses, among which CCR1 was previously shown to regulate mast cells mediated allergic responses [39]. KIT, TPSAB1, and TPSB2 are mast cells-specific molecules, CD9 is a marker of exosomes, and TLR9 and TGFBR1 are randomly selected up-regulated and down-regulated molecules. In addition, we have also noticed that Toll-like receptor 9 (TLR9) ligands (cytosine phosphate guanosine oligonucleotides) given at the time of sensitization to peanut suppresses peanut sensitization in mice. Moreover, TLR9 agonists coupled to ragweed have been used in human trials for allergic rhinitis with some success [41]. However, the function of TLR9 in mast cell-derived exosomes should be further studied. We have proven that seven candidate genes have the same expression trend as predicted by qRT-PCR (P<0.05) (Figure 8). Together, these findings may be useful for understanding the underlying molecular functions of mast cell-derived exosomes in cell to cell communication.
Conclusions
In conclusion, we have used by bioinformatic analyses to achieved a comprehensive view of the pivotal genes and pathways that differ between mast cell-derived exosomes and mast cells. The candidate genes validated by qRT-PCR and western blot in this study constitute unique resources, and the further characterization of these genes will open up new avenues of research for better understanding the processes by which mast cells contribute to the development of different pathologies and whether exosomes are therapeutic targets for immune diseases.
Acknowledgements
This work was financially supported by the National Natural Science Foundation of China (NO. 81471593, 81601395) and Shanghai Sailing Program (NO. 16YF1409200).
Disclosure of conflict of interest
None.
Abbreviations
- BMMCs
Bone marrow derived mast cells
- BP
Biological process
- CC
Cellular component
- DAVID
Database for Annotation, Visualization and Integrated Discovery
- DEG
Differentially expressed genes
- GAPDH
Glyceraldehyde-3-phosphate dehydrogenase
- GO
Gene ontology
- KEGG
Kyoto Encyclopedia of Genes and Genomes
- MF
Molecular function
- PPI
Protein-protein interaction network
Supporting Information
References
- 1.Thery C. Exosomes: secreted vesicles and intercellular communications. F1000 Biol Rep. 2011;3:15. doi: 10.3410/B3-15. [DOI] [PMC free article] [PubMed] [Google Scholar]
- 2.Lasser C, Alikhani VS, Ekstrom K, Eldh M, Paredes PT, Bossios A, Sjostrand M, Gabrielsson S, Lotvall J, Valadi H. Human saliva, plasma and breast milk exosomes contain RNA: uptake by macrophages. J Transl Med. 2011;9:9. doi: 10.1186/1479-5876-9-9. [DOI] [PMC free article] [PubMed] [Google Scholar]
- 3.Caby MP, Lankar D, Vincendeau-Scherrer C, Raposo G, Bonnerot C. Exosomal-like vesicles are present in human blood plasma. Int Immunol. 2005;17:879–887. doi: 10.1093/intimm/dxh267. [DOI] [PubMed] [Google Scholar]
- 4.Russo LM, Bate K, Motamedinia P, Salazar G, Scott A, Lipsky M, Sadeghi N, Lin J, Comper WD, Petrylak DP, McKiernan JM. Urinary exosomes as a stable source of mRNA for prostate cancer analysis. J. Clin. Oncol. 2012;30(suppl):174. [Google Scholar]
- 5.Street JM, Barran PE, Mackay CL, Weidt S, Balmforth C, Walsh TS, Chalmers RT, Webb DJ, Dear JW. Identification and proteomic profiling of exosomes in human cerebrospinal fluid. J Transl Med. 2012;10:5. doi: 10.1186/1479-5876-10-5. [DOI] [PMC free article] [PubMed] [Google Scholar]
- 6.Valadi H, Ekstrom K, Bossios A, Sjostrand M, Lee JJ, Lotvall JO. Exosome-mediated transfer of mRNAs and microRNAs is a novel mechanism of genetic exchange between cells. Nat Cell Biol. 2007;9:654–659. doi: 10.1038/ncb1596. [DOI] [PubMed] [Google Scholar]
- 7.Li F, Wang Y, Lin L, Wang J, Xiao H, Li J, Peng X, Dai H, Li L. Mast cell-derived exosomes promote Th2 cell differentiation via OX40L-OX40 ligation. J Immunol Res. 2016;2016:3623898. doi: 10.1155/2016/3623898. [DOI] [PMC free article] [PubMed] [Google Scholar]
- 8.Ekstrom K, Valadi H, Sjostrand M, Malmhall C, Bossios A, Eldh M, Lotvall J. Characterization of mRNA and microRNA in human mast cell-derived exosomes and their transfer to other mast cells and blood CD34 progenitor cells. J Extracell Vesicles. 2012;1 doi: 10.3402/jev.v1i0.18389. [DOI] [PMC free article] [PubMed] [Google Scholar]
- 9.Lu Z, Zuo B, Jing R, Gao X, Rao Q, Liu Z, Qi H, Guo H, Yin H. Dendritic cell-derived exosomes elicit tumor regression in autochthonous hepatocellular carcinoma mouse models. J Hepatol. 2017;67:739–748. doi: 10.1016/j.jhep.2017.05.019. [DOI] [PubMed] [Google Scholar]
- 10.Kulshreshtha A, Ahmad T, Agrawal A, Ghosh B. Proinflammatory role of epithelial cell-derived exosomes in allergic airway inflammation. J Allergy Clin Immunol. 2013;131:1194–203. 1203, e1–14. doi: 10.1016/j.jaci.2012.12.1565. [DOI] [PubMed] [Google Scholar]
- 11.Chatila TA, Williams CB. Regulatory T cells: exosomes deliver tolerance. Immunity. 2014;41:3–5. doi: 10.1016/j.immuni.2014.07.001. [DOI] [PMC free article] [PubMed] [Google Scholar]
- 12.Castells M. Diagnosis and management of anaphylaxis in precision medicine. J Allergy Clin Immunol. 2017;140:321–333. doi: 10.1016/j.jaci.2017.06.012. [DOI] [PubMed] [Google Scholar]
- 13.Jin C, Shelburne CP, Li G, Potts EN, Riebe KJ, Sempowski GD, Foster WM, Abraham SN. Particulate allergens potentiate allergic asthma in mice through sustained IgE-mediated mast cell activation. J Clin Invest. 2017;127:3913. doi: 10.1172/JCI97321. [DOI] [PMC free article] [PubMed] [Google Scholar]
- 14.Zaiss DM, Gause WC, Osborne LC, Artis D. Emerging functions of amphiregulin in orchestrating immunity, inflammation, and tissue repair. Immunity. 2015;42:216–226. doi: 10.1016/j.immuni.2015.01.020. [DOI] [PMC free article] [PubMed] [Google Scholar]
- 15.Schonhuber N, Seidler B, Schuck K, Veltkamp C, Schachtler C, Zukowska M, Eser S, Feyerabend TB, Paul MC, Eser P, Klein S, Lowy AM, Banerjee R, Yang F, Lee CL, Moding EJ, Kirsch DG, Scheideler A, Alessi DR, Varela I, Bradley A, Kind A, Schnieke AE, Rodewald HR, Rad R, Schmid RM, Schneider G, Saur D. A next-generation dual-recombinase system for time- and host-specific targeting of pancreatic cancer. Nat Med. 2014;20:1340–1347. doi: 10.1038/nm.3646. [DOI] [PMC free article] [PubMed] [Google Scholar]
- 16.Kolkhir P, Church MK, Weller K, Metz M, Schmetzer O, Maurer M. Autoimmune chronic spontaneous urticaria: what we know and what we do not know. J Allergy Clin Immunol. 2017;139:1772–1781. e1. doi: 10.1016/j.jaci.2016.08.050. [DOI] [PubMed] [Google Scholar]
- 17.Feyerabend TB, Weiser A, Tietz A, Stassen M, Harris N, Kopf M, Radermacher P, Moller P, Benoist C, Mathis D, Fehling HJ, Rodewald HR. Cre-mediated cell ablation contests mast cell contribution in models of antibody- and T cell-mediated autoimmunity. Immunity. 2011;35:832–844. doi: 10.1016/j.immuni.2011.09.015. [DOI] [PubMed] [Google Scholar]
- 18.Dwyer DF, Barrett NA, Austen KF Immunological Genome Project Consortium. Expression profiling of constitutive mast cells reveals a unique identity within the immune system. Nat Immunol. 2016;17:878–887. doi: 10.1038/ni.3445. [DOI] [PMC free article] [PubMed] [Google Scholar]
- 19.Ribatti D. Mast cells in lymphomas. Crit Rev Oncol Hematol. 2016;101:207–212. doi: 10.1016/j.critrevonc.2016.03.016. [DOI] [PubMed] [Google Scholar]
- 20.Eldh M, Ekstrom K, Valadi H, Sjostrand M, Olsson B, Jernas M, Lotvall J. Exosomes communicate protective messages during oxidative stress; possible role of exosomal shuttle RNA. PLoS One. 2010;5:e15353. doi: 10.1371/journal.pone.0015353. [DOI] [PMC free article] [PubMed] [Google Scholar]
- 21.Xie G, Yang H, Peng X, Lin L, Wang J, Lin K, Cui Z, Li J, Xiao H, Liang Y, Li L. Mast cell exosomes can suppress allergic reactions by binding to IgE. J Allergy Clin Immunol. 2017 doi: 10.1016/j.jaci.2017.07.040. [Epub ahead of print] [DOI] [PubMed] [Google Scholar]
- 22.Thery C, Amigorena S, Raposo G, Clayton A. Isolation and characterization of exosomes from cell culture supernatants and biological fluids. Curr Protoc Cell Biol. 2006 doi: 10.1002/0471143030.cb0322s30. Chapter 3: Unit 3.22. [DOI] [PubMed] [Google Scholar]
- 23.Ritchie ME, Phipson B, Wu D, Hu Y, Law CW, Shi W, Smyth GK. Limma powers differential expression analyses for RNA-sequencing and microarray studies. Nucleic Acids Res. 2015;43:e47. doi: 10.1093/nar/gkv007. [DOI] [PMC free article] [PubMed] [Google Scholar]
- 24.Ashburner M, Ball CA, Blake JA, Botstein D, Butler H, Cherry JM, Davis AP, Dolinski K, Dwight SS, Eppig JT, Harris MA, Hill DP, Issel-Tarver L, Kasarskis A, Lewis S, Matese JC, Richardson JE, Ringwald M, Rubin GM, Sherlock G. Gene ontology: tool for the unification of biology. The gene ontology consortium. Nat Genet. 2000;25:25–29. doi: 10.1038/75556. [DOI] [PMC free article] [PubMed] [Google Scholar]
- 25.Kanehisa M, Goto S. KEGG: kyoto encyclopedia of genes and genomes. Nucleic Acids Res. 2000;28:27–30. doi: 10.1093/nar/28.1.27. [DOI] [PMC free article] [PubMed] [Google Scholar]
- 26.Franceschini A, Szklarczyk D, Frankild S, Kuhn M, Simonovic M, Roth A, Lin J, Minguez P, Bork P, von Mering C, Jensen LJ. STRING v9.1: protein-protein interaction networks, with increased coverage and integration. Nucleic Acids Res. 2013;41:D808–815. doi: 10.1093/nar/gks1094. [DOI] [PMC free article] [PubMed] [Google Scholar]
- 27.Spinelli L, Gambette P, Chapple CE, Robisson B, Baudot A, Garreta H, Tichit L, Guenoche A, Brun C. Clust & See: a cytoscape plugin for the identification, visualization and manipulation of network clusters. Biosystems. 2013;113:91–95. doi: 10.1016/j.biosystems.2013.05.010. [DOI] [PubMed] [Google Scholar]
- 28.Nepusz T, Yu H, Paccanaro A. Detecting overlapping protein complexes in protein-protein interaction networks. Nat Methods. 2012;9:471–472. doi: 10.1038/nmeth.1938. [DOI] [PMC free article] [PubMed] [Google Scholar]
- 29.Gu J, Liang Y, Qiao L, Lu Y, Hu X, Luo D, Li N, Zhang L, Chen Y, Du J, Zheng Q. URI expression in cervical cancer cells is associated with higher invasion capacity and resistance to cisplatin. Am J Cancer Res. 2015;5:1353–1367. [PMC free article] [PubMed] [Google Scholar]
- 30.Pfaffl MW. A new mathematical model for relative quantification in real-time RT-PCR. Nucleic Acids Res. 2001;29:e45. doi: 10.1093/nar/29.9.e45. [DOI] [PMC free article] [PubMed] [Google Scholar]
- 31.Xiao H, Lasser C, Shelke GV, Wang J, Radinger M, Lunavat TR, Malmhall C, Lin LH, Li J, Li L, Lotvall J. Mast cell exosomes promote lung adenocarcinoma cell proliferation - role of KIT-stem cell factor signaling. Cell Commun Signal. 2014;12:64. doi: 10.1186/s12964-014-0064-8. [DOI] [PMC free article] [PubMed] [Google Scholar]
- 32.Al-Nedawi K, Szemraj J, Cierniewski CS. Mast cell-derived exosomes activate endothelial cells to secrete plasminogen activator inhibitor type 1. Arterioscler Thromb Vasc Biol. 2005;25:1744–1749. doi: 10.1161/01.ATV.0000172007.86541.76. [DOI] [PubMed] [Google Scholar]
- 33.Chen B, Li MY, Guo Y, Zhao X, Lim HC. Mast cell-derived exosomes at the stimulated acupoints activating the neuro-immuno regulation. Chin J Integr Med. 2017;23:878–880. doi: 10.1007/s11655-016-2269-8. [DOI] [PubMed] [Google Scholar]
- 34.Lotfi-Emran S, Ward BR, Le QT, Pozez AL, Manjili MH, Woodfolk JA, Schwartz LB. Human mast cells present antigen to autologous CD4+ T cells. J Allergy Clin Immunol. 2018;141:311–321. e10. doi: 10.1016/j.jaci.2017.02.048. [DOI] [PubMed] [Google Scholar]
- 35.Drube S, Grimlowski R, Deppermann C, Frobel J, Kraft F, Andreas N, Stegner D, Dudeck J, Weber F, Rodiger M, Gopfert C, Drube J, Reich D, Nieswandt B, Dudeck A, Kamradt T. The neurobeachin-like 2 protein regulates mast cell homeostasis. J Immunol. 2017;199:2948–2957. doi: 10.4049/jimmunol.1700556. [DOI] [PubMed] [Google Scholar]
- 36.Amin K, Janson C, Harvima I, Venge P, Nilsson G. CC chemokine receptors CCR1 and CCR4 are expressed on airway mast cells in allergic asthma. J Allergy Clin Immunol. 2005;116:1383–1386. doi: 10.1016/j.jaci.2005.08.053. [DOI] [PubMed] [Google Scholar]
- 37.Fifadara NH, Aye CC, Raghuwanshi SK, Richardson RM, Ono SJ. CCR1 expression and signal transduction by murine BMMCs results in secretion of TNF-alpha, TGFbeta-1 and IL-6. Int Immunol. 2009;21:991–1001. doi: 10.1093/intimm/dxp066. [DOI] [PMC free article] [PubMed] [Google Scholar]
- 38.Juremalm M, Olsson N, Nilsson G. Selective CCL5/RANTES-induced mast cell migration through interactions with chemokine receptors CCR1 and CCR4. Biochem Biophys Res Commun. 2002;297:480–485. doi: 10.1016/s0006-291x(02)02244-1. [DOI] [PubMed] [Google Scholar]
- 39.Aye CC, Toda M, Morohoshi K, Ono SJ. Identification of genes and proteins specifically regulated by costimulation of mast cell Fcepsilon receptor I and chemokine receptor 1. Exp Mol Pathol. 2012;92:267–274. doi: 10.1016/j.yexmp.2012.02.002. [DOI] [PubMed] [Google Scholar]
- 40.Kuo CH, Collins AM, Boettner DR, Yang Y, Ono SJ. Role of CCL7 in Type I hypersensitivity reactions in murine experimental allergic conjunctivitis. J Immunol. 2017;198:645–656. doi: 10.4049/jimmunol.1502416. [DOI] [PMC free article] [PubMed] [Google Scholar]
- 41.Berin MC, Wang W. Reduced severity of peanut-induced anaphylaxis in TLR9-deficient mice is associated with selective defects in humoral immunity. Mucosal Immunol. 2013;6:114–121. doi: 10.1038/mi.2012.55. [DOI] [PMC free article] [PubMed] [Google Scholar]
Associated Data
This section collects any data citations, data availability statements, or supplementary materials included in this article.


