Abstract
Despite progress in treating B‐cell precursor acute lymphoblastic leukemia (BCP‐ALL), disease recurrence remains the main cause of treatment failure. New strategies to improve therapeutic outcomes are needed, particularly in high‐risk relapsed patients. Che‐1/AATF (Che‐1) is an RNA polymerase II‐binding protein involved in proliferation and tumor survival, but its role in hematological malignancies has not been clarified. Here, we show that Che‐1 is overexpressed in pediatric BCP‐ALL during disease onset and at relapse, and that its depletion inhibits the proliferation of BCP‐ALL cells. Furthermore, we report that c‐Myc regulates Che‐1 expression by direct binding to its promoter and describe a strict correlation between Che‐1 expression and c‐Myc expression. RNA‐seq analyses upon Che‐1 or c‐Myc depletion reveal a strong overlap of the respective controlled pathways. Genomewide ChIP‐seq experiments suggest that Che‐1 acts as a downstream effector of c‐Myc. These results identify the pivotal role of Che‐1 in the control of BCP‐ALL proliferation and present the protein as a possible therapeutic target in children with relapsed BCP‐ALL.
Keywords: BCP‐ALL, Che‐1, c‐Myc, leukemogenesis, proliferation
Subject Categories: Cancer, Signal Transduction, Transcription
Introduction
Acute lymphoblastic leukemia (ALL) is the most common malignancy in childhood, accounting for almost 30% of pediatric cancers. Among children with ALL, around 80–85% have a disease originating from B‐cell precursors, that is, BCP‐ALL. Despite the high rate of treatment, ALL is still one of the leading causes of death in children with tumors. Indeed, even though nowadays fewer patients relapse, the high incidence of ALL in childhood means that relapsed ALL can still be ranked as the fifth most common pediatric malignancy and accounts for a large proportion of cancer‐associated death in children every year 1. For this reason, there is a keen interest in identifying genetic and biological features affecting the development of ALL and the risk of treatment failure 2, 3. Genetic mutations have been associated with leukemia even if they are often insufficient to cause disease themselves 2, 4, 5. Che‐1/AATF (Che‐1) is an RNA polymerase II‐binding protein involved in the regulation of gene transcription. Che‐1 acts as a transcriptional co‐factor, connecting specific transcription factors to the general transcriptional machinery. It is constitutively expressed, as it is essential for cell survival 6, 7, 8 and it has been demonstrated that Che‐1 promotes cell‐cycle progression 9. It is also involved in the control of p53 expression and DNA damage response 10, 11 and exerts an anti‐apoptotic activity 12, 13, 14, 15. Che‐1 has a consolidated role in promoting cancer‐cell survival in solid tumors, and its involvement in hematological malignancies has only recently been investigated 11, 16, 17. c‐Myc plays important regulatory roles in many aspects of neoplastic transformation, and its overexpression is responsible for many of the changes associated with malignancy 18, 19, 20. In this study, we show that Che‐1 is present at high levels in BCP‐ALL patients and that its expression is required for cell proliferation. Moreover, we demonstrate that Che‐1 is a direct target of c‐Myc, cooperating in active transcription of several genes involved in cell‐cycle progression. These results identify Che‐1 as both a potentially useful marker for BCP‐ALL at onset and after relapse, and a potential target for specific treatment of this disease.
Results
Che‐1 is highly expressed in bone marrow samples from children at diagnosis of BCP‐ALL and at time of relapse
Albeit Che‐1 protein is ubiquitously detectable, its overexpression has been observed in many tumor cell lines and has been associated with development and progression of many malignancies 9, 11, 21. In view of these observations, we evaluated Che‐1 expression in childhood BCP‐ALL. As shown in Fig 1A, FACS analysis revealed barely detectable Che‐1 levels in healthy bone marrows (HBMs), and, by contrast, a strong expression in the bone marrow (BM) of patients with BCP‐ALL. Comparing BM samples collected at diagnosis from patients with BCP‐ALL with those obtained at time of remission, we observed that Che‐1 expression was eliminated in the latter ones. Representative Western blot analysis of Che‐1 expression confirmed high levels of this protein in BCP‐ALL samples obtained at diagnosis, whereas all HBMs resulted Che‐1 negative (Fig 1B). Moreover, as observed in Fig 1B, BM from BCP‐ALL patients in remission showed a complete disappearance of Che‐1 expression. Notably, high levels of Che‐1 were also found in patients at time of relapse (Fig 1C). In addition, evaluation of BM from relapsed patients showed a direct correlation between the percentage of blasts and the percentage of Che‐1 positivity, indicating that Che‐1 expression correlates with BM's tumor load (Fig 1D). In order to thoroughly investigate this observation, we analyzed 80 BM samples collected from pediatric patients at the onset of BCP‐ALL by Western blot (Table 1), together with 15 HBMs samples, 28 BM samples collected from patients at time of remission and 14 at time of relapse. The analysis of Che‐1 expression in this cohort revealed that Che‐1 is highly expressed in almost the totality of BM samples from BCP‐ALL patients both at diagnosis and at the time of recurrence, while it disappears in BM samples collected at time of remission (Fig 1E).
Figure 1. Che‐1 is expressed in BCP‐ALL samples at diagnosis and at time of relapse.
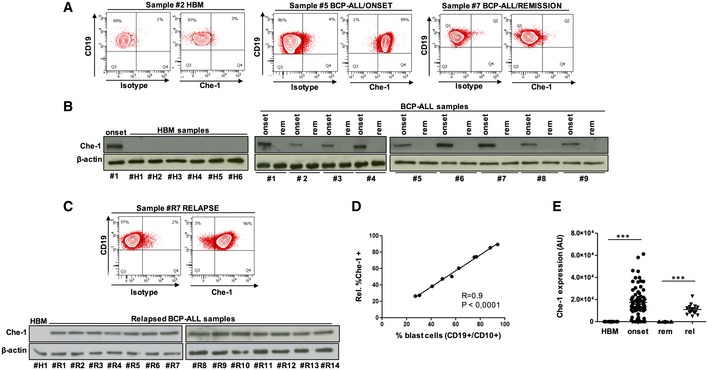
- FACS analysis for Che‐1 expression in the CD19+/CD10+ cellular subsets of representative HBM (#2), BCP‐ALL/ONSET (#5), and BCP‐ALL/REMISSION (#7) samples.
- Evaluation of Che‐1 expression by Western blot (WB) in six representative samples of HBMs (#H1–#H6) and in nine samples of BCP‐ALL BM analyzed at time of diagnosis (onset) and at time of remission (rem) (#1–#9). β‐actin was used as loading control. #1 BCP‐ALL sample (onset) was used as positive control.
- Representative FACS analysis of a RELAPSE sample (#R7) (upper panel). WB analysis of Che‐1 in the BM from 14 samples at time of relapse (#R1–#R14). β‐actin was used as loading control. #H1 sample was used as negative control (bottom panel).
- Graphic representation of the direct correlation existing between the percentage of blast cells and the percentage of Che‐1 expressing cells, evaluated by FACS analysis.
- Distribution of Che‐1 expression (arbitrary units, AU) in the total number of HBMs (15), BCP‐ALL BMs (80), BCP‐ALL/REMISSION (28), and RELAPSE (14). ***P ≤ 0.001 by Mann‐Whitney U‐test.
Source data are available online for this figure.
Table 1.
Summary of patients and disease characteristics
| Newly diagnosed patients | Relapsed patients | |
|---|---|---|
| N. or median (% or range) | N. or median (% or range) | |
| Number of patients | 80 | 14 |
| Gender | ||
| Females | 35 (44%) | 6 (43%) |
| Males | 45 (56%) | 8 (57%) |
| Age at diagnosis (years) | 4.57 (1.11–17.16) | 4.01 (0.90–22.10) |
| Age at relapse (years) | – | 10.32 (2.88–26.25) |
| Disease status | ||
| Diagnosis | 80 (100%) | – |
| 1st relapse | – | 7 (50%) |
| 2nd relapse | – | 6 (42.85%) |
| 3rd relapse | – | 1 (7.15%) |
| Molecular abnormalities | ||
| None | 51 (63.75%) | 12 (35.7%) |
| t(12;21) (TEL/AML1) | 25 (31.25%) | 1 (7.1%) |
| t(1;19) (E2A/PBX1) | 2 (2.5%) | 1 (7.1%) |
| t(9;22) (BCR/ABL) | 2 (2.5%) | 0 (0%) |
| t(4;11) (MLL/AF4) | 0 (0%) | 0 (0%) |
| Hypodiploidya | ||
| Yes | 0 (0%) | 1 (7.15%) |
| No | 80 (100%) | 13 (92.85%) |
Defined as chromosome number ≤ 44 and/or DNA index ≤ 0.8 in leukemic cells.
Che‐1 sustains cell proliferation in BCP‐ALL cell lines
To test the hypothesis that Che‐1 could be involved in BCP‐ALL cell proliferation, we silenced Che‐1 expression by siRNA in a pediatric BCP‐ALL cell line (NALM‐6) and in three primary cell lines obtained by immortalizing BM blasts of our BCP‐ALL patients through Epstein–Barr virus infection (LAL‐B, LAL‐B#2, LAL‐B#3; Figs 2A and EV1A). Interestingly, the abrogation of Che‐1 expression at 36 h from nucleofection was associated with a significant decrease in cell proliferation when compared with control conditions (i.e., with siRNA for a control sequence; Fig 2A), while at 48 h the cells started to dye (Fig EV1B). To validate the specificity of the siRNA approach, a conditional RNAi model was generated by infecting LAL‐B and NALM‐6 cells with either a doxycycline (Dox)‐inducible lentiviral vector carrying a specific hairpin (sh)RNA against Che‐1 or a vector carrying a control hairpin. When these cells were treated with Dox, NALM‐6/LAL‐B‐shChe‐1, but not shControl cells, exhibited a similar reduction in cell growth (Fig 2B). Consistent with these findings, FACS analysis revealed that Che‐1‐silenced cells showed a significant decrease in the percentage of cells in the S and G2/M phases of the cell cycle, with a concomitant increase in cells in G1 phase, when compared to control cells (Fig 2C). Accordingly, Che‐1 silencing produced a significant increase in the expression of G1 phase regulators, namely p21 and Cyclin E, with a concomitant reduction in levels of Cyclin B1, a specific G2 phase marker (Fig 2D). Since Che‐1 has a consolidated role as an anti‐apoptotic factor, we asked whether its downregulation could improve the response of leukemic cells to chemotherapeutic agents. As shown in Fig 2E, Che‐1 silencing affected blast cell viability, increasing the susceptibility to adriamycin (Adr) treatment in two different B‐ALL cell lines. This cytotoxic effect was confirmed by the enhancement of apoptotic molecular markers, such as PUMA, cleaved caspase‐7, and cleaved Parp (p85; Fig 2F). Altogether, these data demonstrate that Che‐1 expression sustains leukemia cell proliferation by supporting cell‐cycle progression at G1/S transition in BCP‐ALL, and that its inhibition sensitizes BCP‐ALL cells to the effect of chemotherapeutic agents.
Figure 2. Che‐1 sustains cell proliferation in BCP‐ALL cell lines.
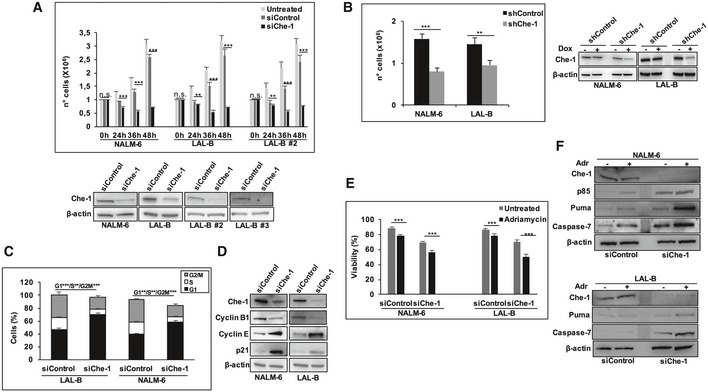
- Proliferation assay was performed in NALM‐6, LAL‐B, and LAL‐B#2 cells upon 24, 36, and 48 h of siRNA nucleoporation. Error bars represent the standard error of three different experiments (upper panel). WB analysis of total cell extracts (TCEs) from NALM‐6, LAL‐B, LAL‐B#2, LAL‐B#3 cells transiently transfected by nucleo‐electroporation with siRNA targeting Che‐1 (siChe‐1) or with siRNA for a control sequence (siControl) for 36 h. β‐actin was used as loading control (bottom panel).
- NALM‐6 and LAL‐B cells were infected with LV‐THsh/Che‐1 (shChe‐1) or LV/THsh/Control (shControl) and LV‐tTR‐KRAB lentiviruses. TCEs from cells induced (+Dox) or not (−Dox) were analyzed by cell number (left panel) and WB (right panel). Error bars represent the standard error of three different experiments.
- Cells treated as in (A) were fixed and stained with propidium iodide (PI) and analyzed for DNA content by flow cytometry. Error bars represent the standard error of three different experiments.
- TCEs from NALM‐6 and LAL‐B cells nucleoporated as in (A) were blotted and analyzed with the indicated Abs. β‐actin was used as loading control.
- Viability assay performed in NALM‐6 and LAL‐B cells interfered for Che‐1 expression and treated for 48 h with adriamycin (2 μM) at the same time. Error bars represent the standard error of three different experiments.
- TCEs from NALM‐6 and LAL‐B cells treated as in (E) were blotted and analyzed with the indicated Abs. β‐actin was used as loading control.
Figure EV1. Che‐1 silencing slightly affects cell viability.
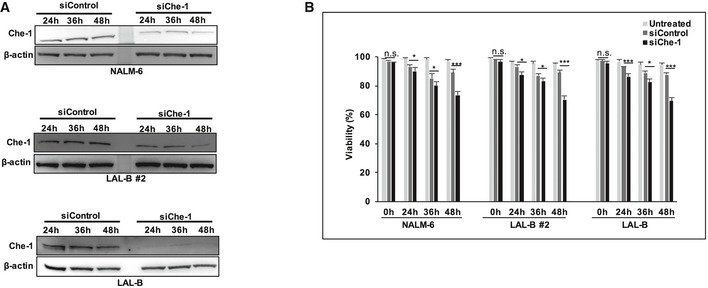
- WB analysis of Che‐1 silencing performed 24, 36, and 48 h postnucleoporation in NALM‐6, LAL‐B, and LAL‐B #2 cell lines.
- Viability assay performed in NALM‐6, LAL‐B, and LAL‐B #2 cell lines treated as in (A). Data are presented as the means and standard deviation (SD) from three independent experiments. *P ≤ 0.05; ***P ≤ 0.001 by Student's t‐test.
Che‐1 regulates transcription and strongly cooperates with the transcriptional machinery on chromatin of BCP‐ALL cells
Since Che‐1 exerts a relevant role in the transcriptional machinery, we performed a RNA‐seq analysis in NALM‐6 and in LAL‐B cells, profiling the transcriptome signature in response to Che‐1 silencing. Differential expression analysis revealed 2,269 and 1,462 genes significantly regulated (q‐value < 0.05) in LAL‐B and NALM‐6 Che‐1‐silenced cells, respectively, in comparison with cells transfected with Control siRNA. From the Gene Ontology analysis of the intersection set of differentially expressed genes, comprising 842 genes, we observed a strong enrichment in cell‐cycle‐related gene clusters (i.e., 167 cell‐cycle‐related genes; Fig 3A, full list in Dataset EV1). To correlate these data with Che‐1 recruitment onto DNA, we performed ChIP‐seq experiments with an anti‐Che‐1 antibody in both NALM‐6 and LAL‐B cell lines. These analyses showed a strong MACS2 peak overlap (Fig 3B), and the regulatory nature of these genomic positions was confirmed by genomewide and fine‐grained enrichment analysis of ChIP‐seq signals on the aforementioned siChe‐1 842‐gene downregulated signature, demonstrating that Che‐1 signal was enriched in both cell lines on 2,205‐derived TSSs (Fig 3C). Among the promoter bound‐regulated genes, we noticed the presence of well‐known genes involved in tumorigenesis and cell‐cycle regulation, such as PTEN, PLK1, and CDK13 (Fig 3D), these findings were also validated by qRT–PCR analysis (Fig 3E). All these genomewide hints point to the transcriptional program mediated by Che‐1 position on the DNA and revealed that Che‐1 is able to regulate the transcription of many gene clusters directly occupying their promoter.
Figure 3. Che‐1 regulates transcription and strongly cooperates with the transcriptional machinery on chromatin of B‐ALL cells.
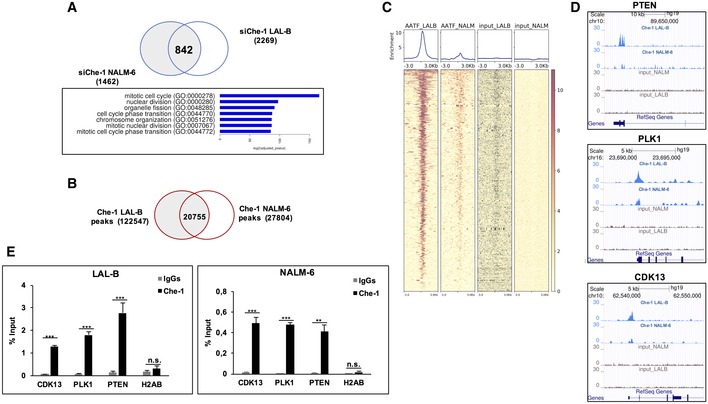
- Intersection of spike‐in‐normalized differential expressed genes in LAL‐B and NALM‐6 cell lines. The 842 genes downregulated in both cell lines show a strong enrichment in several functional clusters.
- Venn diagram of Che‐1 peak sets in LAL‐B and NALM‐6 cell lines computed by bedtools intersect.
- ChIP‐seq signal, centered on 2,205 TSS sites extracted from the 842 RNA‐seq downregulated signature. The Deeptools Heatmap plot shows an enrichment of Che‐1 position with respect to both inputs.
- Genome Browser Screenshots of ChIP‐seq bigWig signal on cell‐cycle‐related genes promoters.
- Quantitative ChIP analysis (ChIP–qPCR) of Che‐1 enrichment on CDK13, PLK1, and PTEN promoters in NALM‐6 and LAL‐B cells. H2AB (Histone Cluster 2 H2A Family Member B) was used as negative control. Data are expressed as percent of input. Error bars represent the standard error of three different experiments. **P ≤ 0.01; ***P ≤ 0.001 by Student's t‐test.
Che‐1 is a c‐Myc target gene
Next, we investigated the mechanism(s) by which Che‐1 is overexpressed in BCP‐ALL blasts. As shown in Fig 4A, BM samples from BCP‐ALL patients showed higher amounts of Che‐1 mRNA when compared to HBMs, suggesting that in BCP‐ALL Che‐1 expression could be regulated at the transcriptional level. In silico analysis via the LASAGNA 22 web tool revealed the presence of several transcriptional factor motifs on Che‐1 promoter, focusing our attention on two canonical c‐Myc motifs (E‐box; data not shown, UCSC Genome Browser Screenshot at Fig 4B), one of them conserved between human and mouse 16, 23 (Fig EV2A). Consistent with this observation, c‐Myc silencing produced a significant reduction in Che‐1 mRNA levels in LAL‐B and NALM‐6 cells (Fig 4C). To confirm these results, we took advantage of the P493‐6 cell system, a B‐cell model of Burkitt's lymphoma, which contains a tetracycline (Tet)‐repressible c‐Myc transgene. Che‐1 mRNA levels were measured in P493‐6 cells either untreated or treated with tetracycline for 72 h, and as shown in Fig EV2B, c‐Myc inhibition produced a significant reduction in Che‐1 mRNA in these cells. In agreement with these results, ChIP assays performed in LAL‐B and NALM‐6 cell lines revealed a physical association of c‐Myc with the Che‐1 promoter (Fig 4D). This finding was further confirmed by a ChIP‐seq experiment performed in the NALM‐6 cell line with a c‐Myc‐specific antibody (Fig 4E) and by another ChIP assay performed in P493‐6 cells either treated or not with Tet (Fig EV2C). In addition, the analysis of a published ChIP‐seq experiment, conducted with a c‐Myc‐specific antibody in P493‐6 cells 20, revealed a strong enrichment (MACS2 log2 q‐value > 70) of c‐Myc signals on Che‐1 promoter (Fig EV2D). Consistent with these findings, a published RNA‐seq experiment in the Eμ‐Myc mouse model of lymphoma 20 demonstrated that Che‐1 expression increased along with c‐Myc activation in the different stages of lymphoma development (Fig EV2E). Moreover, murine Che‐1 promoter activity directly correlated with c‐Myc expression in P493‐6 cells (Fig 4F), and two different specific variants altering the canonical E‐box sequence (CACGTG in TTCGAC) revealed a significant reduction in their transcriptional activation, reinforcing the notion that c‐Myc regulates Che‐1 expression (Fig 4G).
Figure 4. c‐Myc controls Che‐1 expression through promoter binding.
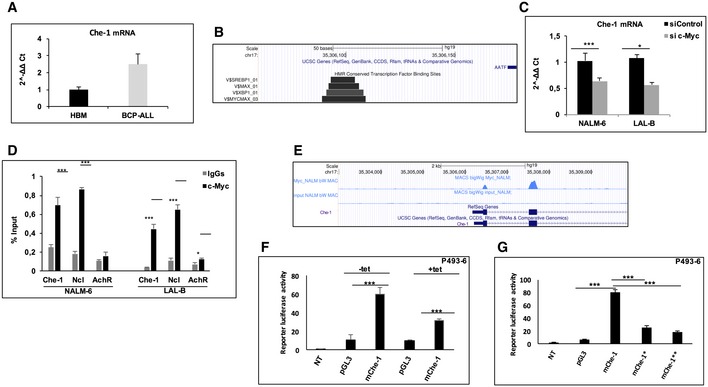
- Che‐1 mRNA levels were analyzed by quantitative RT–PCR (qRT–PCR) in eight bone marrows samples collected at diagnosis from BCP‐ALL patients and were compared with five HBMs samples. Values were normalized with actin mRNA levels using the ∆∆C t method.
- Genome Browser Screenshot showing conserved transcription factor binding sites of Che‐1 promoter, computed from Transfac/Biobase.
- Che‐1 mRNA levels were analyzed by qRT–PCR in NALM‐6 and LAL‐B cell lines interfered for c‐Myc expression by siRNA. Data are presented as the means and standard deviation (SD) from three independent experiments.
- ChIP–qPCR analysis of c‐Myc enrichment on the Che‐1 promoter in LAL‐B and NALM‐6 cells. Ncl (nucleolin) and AchR (acetylcholine receptor) were used as positive and negative controls, respectively. Data are expressed as percent of input. Error bars represent the standard error of three different experiments.
- c‐Myc binding to Che‐1 promoter in NALM‐6 cell line by ChIP‐seq assay.
- P493‐6 cells were transfected with pGL3 basic vector, used as control, or with the plasmid containing the firefly luciferase reporter under the control of murine Che‐1 promoter (mChe‐1). Che‐1 promoter activity was analyzed in high c‐Myc (−tet) or low c‐Myc (+tet) conditions. Data are presented as the means ± SD from three independent experiments.
- Luciferase assay performed upon two different mutations in the E‐box sequence on mChe‐1 promoter (mChe‐1*, mChe‐1**). Data are presented as the means ± standard deviation (SD) from three independent experiments.
Figure EV2. Che‐1 binds c‐Myc promoter and is involved in c‐Myc‐dependent tumorigenesis.
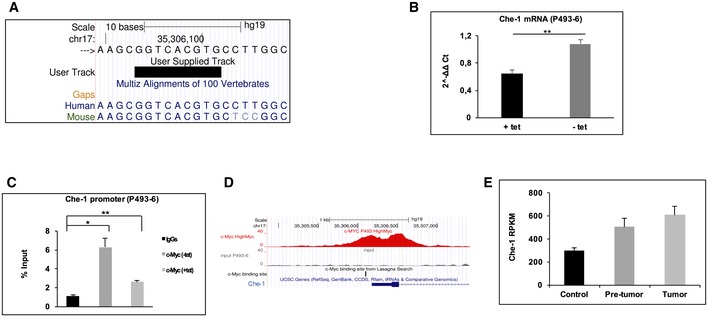
- Genome Browser Screenshot of Che‐1 promoter, showing E‐box conservation among human and mouse.
- qRT–PCR experiment performed in P493‐6 cell line untreated (−tet) or treated with 0.1 μg/ml tetracycline for 72 h (+tet). Values were normalized with actin mRNA levels using the ∆∆C t method. Error bars represent the standard error of three different experiments.
- Cross‐linked chromatin derived from P493‐6 cells untreated or treated with 0.1 μg/ml tetracycline for 72 h was immunoprecipitated with c‐Myc antibody or in the absence of antibody and analyzed by qRT–PCR (ChIP–qPCR). Data are expressed as a percentage of input. Error bars represent the standard error of three different experiments.
- c‐Myc binds Che‐1 promoter in P493‐6 cell line. Data from Amati's group deposited at GSE51011, UCSC Genome Browser Screenshot showing only portion of MACS2‐generated bigWig.
Che‐1 and c‐Myc strictly cooperate to sustain BCP‐ALL cell growth
The findings reported above prompted us to analyze the functional relationship between these two proteins. Silenced c‐Myc expression in NALM‐6, LAL‐B, and LAL‐B#2 cells, produced a significant reduction in Che‐1 protein levels (Fig 5A). This effect was also observed in P493‐6 cells, where Tet treatment was able to regulate Che‐1 expression (Fig EV3A). The interference with c‐Myc expression was also able to reduce B‐ALL cell lines proliferation (Fig EV3B) and to affect cell viability after 48 h of protein silencing (Fig EV3C) as previously observed 24, 25, 26, 27. Next, we analyzed by Western blot c‐Myc expression in the same BM samples from pediatric BCP‐ALL patients analyzed for Che‐1 expression in Fig 1B and C. As shown in Fig 5B, c‐Myc was found to be highly expressed in all BCP‐ALL samples analyzed as compared to HBMs, where c‐Myc expression disappeared. Moreover, c‐Myc expression, like that of Che‐1, was absent in cells collected from BCP‐ALL at time of remission (Fig 5B) and then was found high again in relapsed BM samples (Fig 5C). Distribution of c‐Myc expression in the same cohort of patients already analyzed for Che‐1 revealed that c‐Myc was highly expressed in almost all of the BM samples from BCP‐ALL patients collected both at diagnosis and at the time of recurrence. By contrast, it disappeared in BM samples of BCP‐ALL patients collected at the time of remission (Fig 5D). FACS analysis confirmed that BCP‐ALL cells with high levels of c‐Myc had also high Che‐1 levels (Fig 5E). Based on this evidence, we investigated a possible correlation between the expressions of the two molecules in BCP‐ALL samples. Notably, we observed a statistically significant direct correlation between the two proteins in 35 BCP‐ALL samples analyzed (Fig 5F). Consistent with this experimental evidence, an analysis conducted on a public dataset of 207 pediatric BCP‐ALL patients available on the R2 web platform (http://r2.amc.nl), confirmed a positive correlation between Che‐1 and c‐Myc transcripts (P‐value: 5e‐6, R: 0.311; Fig 5G). This correlation was also confirmed in the Lim dataset comprising several samples of hematological disorders (e.g., Burkitt's lymphoma, diffuse large B‐cell lymphoma; Fig EV3D). To further validate the correlation between c‐Myc‐ and Che‐1‐related transcriptome, we performed a deeper analysis on the aforementioned 207 patient dataset. Exploiting the R2 framework, we extracted all the transcripts significantly and positively correlated with c‐Myc expression and Che‐1 expression. These two transcripts sets, Che‐1‐r‐Plus and c‐Myc‐r‐Plus, revealed a 1,372 gene intersection, in which c‐Myc‐r‐rawset showed a 92% overlap with Che‐1‐correlated transcripts (Fig 5H). In agreement with the activity of these two proteins, this intersection set showed a strong enrichment in translation‐related gene clusters (Fig EV3E) with cell‐cycle genes present in a 64‐gene cluster (corrected P‐value < 2e‐5, full list at Dataset EV2).
Figure 5. Che‐1 and c‐Myc strictly cooperate to sustain BCP‐ALL cell growth.
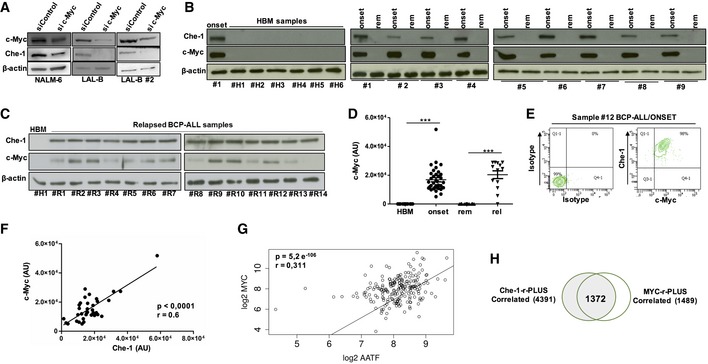
- WB analysis of Che‐1 expression in c‐Myc‐interfered NALM‐6, LAL‐B, and LAL‐B#2 cell lines.
- Evaluation of c‐Myc expression by WB in six representative samples of HBM and in nine BM samples of BCP‐ALL analyzed at time of diagnosis (onset) and at time of remission (rem). β‐actin was used as loading control. #1 BCP‐ALL sample was used as positive control.
- WB analysis for c‐Myc expression in BMs from relapsing patients (#R1–#R14). β‐actin was used as loading control. #H1 sample was used as negative control.
- c‐Myc distribution in HBM samples (15), BCP‐ALL samples collected at diagnosis (35), at remission (28), and at time of relapse (13). ***P ≤ 0.001 by Mann‐Whitney U‐test.
- FACS analysis of c‐Myc and Che‐1 co‐expression in a BCP‐ALL sample collected at diagnosis (#12).
- Che‐1/c‐Myc correlation in 35 BCP‐ALL samples analyzed.
- Scatter plot of Che‐1 and c‐Myc expression levels in Murphy's 207 BCP‐ALL patient's dataset. The two transcripts show a significant (P‐value = 5.2e‐06) positive (R: 0.31) correlation.
- Venn diagram for the Che‐1‐r‐Plus and c‐Myc‐r‐Plus sets.
Source data are available online for this figure.
Figure EV3. c‐Myc silencing affect cell viability and proliferation with a major effort.
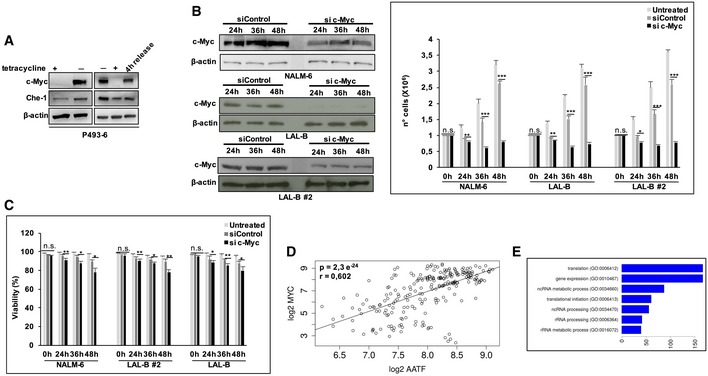
- WB analysis of P493‐6 cells untreated (−tet), treated with tetracycline for 72 h (+tet) and 4 h after release. β‐actin was used as loading control.
- WB and proliferation assay of c‐Myc silencing performed 24, 36, and 48 h postnucleoporation in NALM‐6, LAL‐B, and LAL‐B #2 cell lines. Data are presented as the means and standard deviation (SD) from three independent experiments.
- Viability assay performed in NALM‐6, LAL‐B, and LAL‐B #2 cell lines treated as in (B). Data are presented as the means and standard deviation (SD) from three independent experiments.
- Che‐1/c‐Myc transcript correlation in the “Exp B Cells” dataset comprising of several hematological samples.
- Gene Ontology enrichment for the 1,372 gene Che‐1/c‐Myc‐r‐PLUS overlap showed in Fig 5H.
Che‐1 is a c‐Myc effector involved in BCP‐ALL cell proliferation
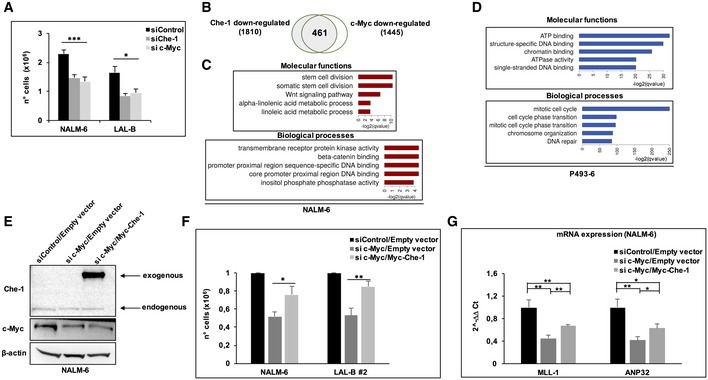
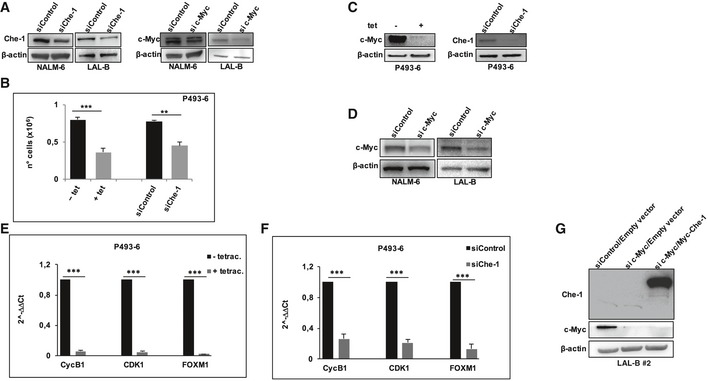
c‐Myc and Che‐1 were both found overexpressed in BCP‐ALL patients. To evaluate whether, besides Che‐1, also c‐Myc was required for cell proliferation, we compared the effects of the RNA interference of these genes. As shown in Fig 6A, NALM‐6 and LAL‐B cells upon c‐Myc downregulation exhibited a reduced cell proliferation, which was comparable to that observed following Che‐1 silencing (Fig EV4A), and similar results were observed in P493‐6 cells (Fig EV4B and C). These findings prompted us to perform RNA‐seq experiments to compare the effects of Che‐1 versus c‐Myc downregulation in NALM‐6 cell line. The intersection of downregulated genes in both siChe‐1 and si c‐Myc samples regarding controls led to a 461 gene set (Figs 6B and EV4D) that revealed an enrichment of genes coding for proteins involved in DNA transcription (molecular functions; Fig 6C, Dataset EV3). To confirm these results, we proceeded to seek a common signature in the inducible P493‐6 system, by either silencing Che‐1 or inhibiting c‐Myc expression with Tet (Fig EV4C). The biological function enrichment for the 1,471‐gene intersection set showed a dramatic enrichment in mitotic, cell‐cycle‐related genes, whereas molecular processes related to the encoded proteins revealed the presence of chromatin binding factors (Fig 6D). qRT–PCR experiments performed in P493‐6 cells confirmed the strong reduction in expression of some genes related to cell cycle (CycB1, CDK1, FOXM1) that resulted downregulated in the RNA‐seq experiment upon c‐Myc or Che‐1 silencing (Fig EV4E and F). Taken together, these results indicate that genes modulated by c‐Myc and Che‐1 have a high degree of overlap, leading to hypothesize that c‐Myc may regulate both their expression and cell proliferation through the activation of Che‐1. To confirm this hypothesis, we silenced c‐Myc expression in NALM‐6 cells either in the absence or in the presence of Che‐1 overexpression. Strikingly, Che‐1 overexpression was able to counteract cell number reduction induced by c‐Myc abrogation in both NALM‐6 and LAL‐B #2 cell lines (Figs 6E and F, and EV4G). Among the most downregulated genes in both Che‐1‐ and c‐Myc‐silenced cellular contexts, there was MLL1 (myeloid/lymphoid or mixed‐lineage leukemia‐1), which plays an essential role in regulating gene expression during both normal and adult hematopoiesis, and ANP32B (acidic nuclear phosphoprotein 32 family member B), implicated in a number of cellular processes including proliferation and differentiation 28, 29. Consistent with the above results, NALM‐6 cells with reduced c‐Myc expression exhibited low mRNA levels of MLL1 and ANP32B genes, whereas Che‐1 ectopic expression was able to counteract the effect of c‐Myc depletion (Fig 6G).
Figure 6. Che‐1 is a c‐Myc effector involved in B‐ALL cell proliferation.
-
ACell number analysis performed 36 h postnucleoporation of NALM‐6 and LAL‐B cells nucleoporated with siRNA targeting Che‐1 (siChe‐1), c‐Myc (si c‐Myc), or with control siRNA (siControl). Error bars represent the standard error of three different experiments.
-
BVenn diagram for Cuffdiff differentially expressed genes (q‐value < 0.1) in both siChe‐1 and si c‐Myc conditions, in NALM‐6 cells.
-
C, DBiological processes and molecular functions enrichment for downregulated signatures in siChe‐1 and si c‐Myc, or +/− tetracycline, in NALM‐6 and P493‐6 cell lines, respectively. Clusters computed via Enrichr API.
-
ENALM‐6 cells were nucleoporated with Control siRNA (siControl) in combination with a Myc‐tagged empty vector (Empty vector) or with siRNA c‐Myc (si c‐Myc) in combination with empty vector, or with si c‐Myc and Myc‐tagged Che‐1 expressing vector (Myc‐Che‐1), and harvested after 36 h. WB analysis of TCEs with the indicated Abs is shown. It is representative of three independent experiments.
-
FCell number analysis performed in NALM‐6 and LAL‐B2 cells treated as in (E). Data are presented as means ± SD from three independent experiments.
-
GQuantitative RT–PCR (qRT–PCR) for the indicated genes was performed in NALM‐6 cells nucleoporated as in (E). Values were normalized to actin expression. Error bars represent the standard error of three different experiments.
Figure EV4. Che‐1 and c‐Myc cooperate in controlling proliferation.
-
AWB analysis of NALM‐6 and LAL‐B cell lines nucleoporated with siRNA targeting Che‐1 (siChe‐1), c‐Myc (si c‐Myc), or with control siRNA (siControl), and subjected to cell number analysis (Fig 6A). β‐actin was used as loading control.
-
BCell number analysis performed on P493‐6 cells transiently transfected either with siRNA targeting Che‐1 (siChe‐1) or with control siRNA (siControl), and untreated or treated with tetracycline for 72 h. Data are presented as the means ± SD from three independent experiments.
-
CWB analysis of P493‐6 cells treated as in (B).
-
DWB analysis of NALM‐6 and LAL‐B cell lines treated as in (A), and subjected to RNA‐seq experiment (Fig 6B).
-
E, FqRT–PCR analysis performed in P493‐6 cells treated as in (B), to validate the downregulation of some genes (Cyclin B1, Cdk1, Foxm1) emerged from the RNA‐seq experiment. Error bars represent the standard error of three different experiments.
-
GLAL‐B #2 cells were nucleoporated with Control siRNA (siControl) in combination with a Myc‐tagged empty vector (Empty vector) or with siRNA c‐Myc (si c‐Myc) in combination with empty vector, or with si c‐Myc and Myc‐tagged Che‐1 expressing vector (Myc‐Che‐1), and harvested after 36 h. WB analysis of TCEs with the indicated Abs is shown. It is representative of three independent experiments.
c‐Myc and Che‐1 interact and co‐localize on a significant cluster of promoters
The sequence specificity of the intersection set and Motif analysis of ChIP‐seq performed with anti‐Che‐1 antibody showed a strong enrichment of several transcription factors motifs, in particular E2F1, SP1, and c‐Myc (Fig EV5A). Based on these results, we compared Che‐1 genomewide signal with a c‐Myc ChIP‐seq performed on P493‐6 cell line 20 extracting a 4,747 peak set overlap. In total, 1,595 (33%) of these peaks were classified as promoter‐TSS, a striking result if compared with background genomewide distribution (Homer stats log2 enrichment fivefold). A high‐level comparison of enriched areas revealed different clusters of c‐Myc‐specific, Che‐1‐specific, and co‐enriched areas of the genome (Fig 7A and B). GO enrichment analysis of these peaks revealed clusters strongly enriched in several processes, including regulation of cell cycle (50 genes, Dataset EV4). Furthermore, we queried our ChIP‐seq data for cell‐cycle‐co‐regulated genes in NALM‐6 RNA‐seq, where the first two GO clusters, stem cell division and somatic cell division, contain well‐known oncogenic and proliferation‐related genes, such as KIT (proto‐oncogene receptor tyrosine kinase), FGFR1 (fibroblast growth factor receptor 1), and LEF1 (lymphoid enhancer‐binding factor 1). From this ChIP‐seq analysis, we found that Che‐1 binds the promoter of these genes, sometimes by itself, other times in concert with c‐Myc (Fig 7C). These findings prompted us to verify a physical interaction between Che‐1 and c‐Myc. As shown in Fig 7D, Che‐1 co‐immunoprecipitated with c‐Myc in all cell lines tested, confirming a physical interaction supporting the functional cooperation. This evidence was confirmed by testing the interaction of Che‐1 fusion protein (GST‐Che‐1) or two Che‐1‐deleted fusion proteins (GST‐36; GST‐34‐35) 6 with in vitro translated c‐Myc protein. As shown in Fig 7E, Che‐1 was able to directly bind c‐Myc, and the C‐terminal domain (GST‐36) was required for this interaction. To evaluate whether Che‐1 was involved in the ability of c‐Myc to bind promoters, we performed a ChIP assay in NALM‐6 cells interfered or not with Che‐1 expression, analyzing genes contained in the overlapping cluster (Fig 7C). Che‐1 downregulation strongly affected c‐Myc recruitment on the promoters of target genes that are occupied by both Che‐1 and c‐Myc (FGFR and LEF1), whereas it showed no effect on c‐Myc occupation of promoters exclusively targeting c‐Myc (SCP2 and ZMYND8; Fig 7F). Altogether, these results show how Che‐1, in addition to being an effector of c‐Myc, contributes to the activity of this oncogene through direct binding on the DNA, acting in a specific way since regulation does not occur globally, but specifically on the promoters of those genes that are targeted by both proteins.
Figure EV5. Significant c‐Myc motifs emerged from Centdist ChIP‐seq MACS2 analysis.
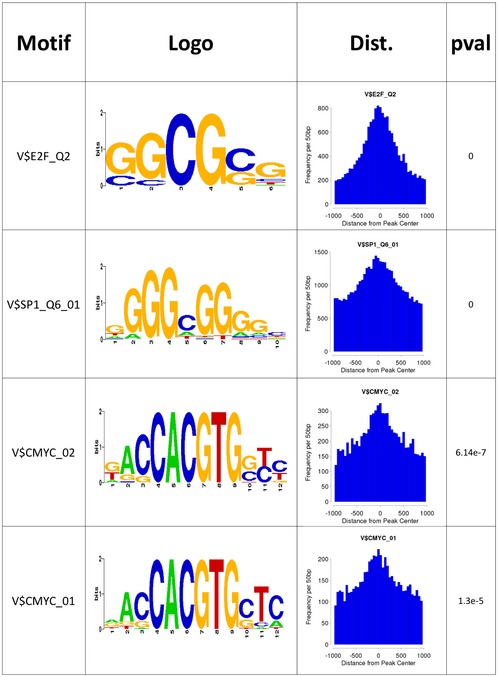
Related to Fig 7.
Figure 7. c‐Myc and Che‐1 interact and co‐localize on a significant cluster of promoters.
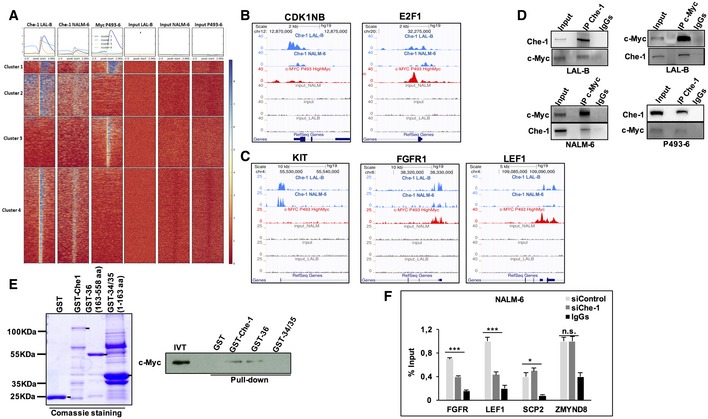
- Deeptools‐generated co‐localization heatmap for a merged peak set (Che‐1 union c‐Myc), showing bigWig enrichment for Che‐1_LALB, Che‐1_NALM, c‐Myc_P493‐6 PLUS input tracks. K‐means clustering (K = 4) has been applied. Cluster 1 (blue) comprises of broad peaks present in all three libraries. Cluster 2 (azure) contains mostly Che‐1‐specific broad domains. Cluster 3 (green) is associated with Myc‐specific narrow peaks. Cluster 4 (orange), again, contains Che‐1‐specific domains, but way narrower when compared to cluster 2.
- ChIP‐seq data for Che‐1 and c‐Myc on CDK1NB and the transcription factor E2F1 shown here, extracted from panel (A), cluster 1. Both the proteins bind the TSS area of the genes with different intensities.
- ChIP‐seq data from co‐downregulated genes in siChe‐1‐sic‐Myc present in stem cell division cluster of Fig 6D.
- Co‐immunoprecipitation experiments with anti‐c‐Myc or anti‐Che‐1 antibodies resolved with reciprocal antibodies, in NALM‐6, P493‐6, and LAL‐B cells.
- GST pull‐down assay performed between GST‐Che‐1, GST‐Che‐1‐deleted fusion proteins (GST‐36, GST‐34‐35), and in vitro translated (IVT) c‐Myc protein. GST sample was used as negative control. GST fusion protein expression is shown by Comassie blue staining.
- ChIP‐seq assay with c‐Myc antibody in Che‐1‐interfered NALM‐6 cell line, resolved by qRT–PCR with FGFR1, LEF1, SCP2, and ZMYND8 primers. Data are presented as the means and standard deviation (SD) from three independent experiments. *P ≤ 0.05; ***P ≤ 0.001 by Student's t‐test.
Source data are available online for this figure.
Discussion
Although the molecular knowledge of BCP‐ALL continues to expand, specific mechanisms involved in leukemia onset have not yet been fully characterized and where mechanisms of blast cell proliferation are still under investigation. In the present study, we identify for the first time an important role played by Che‐1 in the proliferation of BCP‐ALL cells. Indeed, we provide evidence that Che‐1 expression strictly correlates with onset and relapse of the disease. In particular, here we show that Che‐1 is highly expressed in about 90% of pediatric BCP‐ALL samples collected at diagnosis, whereas it is completely downregulated when morphological remission is obtained. Moreover, we demonstrated that the protein is still expressed in all the samples collected from patients at time of relapse. In agreement with previous findings 9, 30, we found that Che‐1 inhibition not only strongly affects BCP‐ALL cell growth, implying that it could be involved in leukemia clonal expansion, but also sensitizes BCP‐ALL cells to chemotherapeutic treatment.
The main function known of Che‐1 is to activate gene transcription 31. RNA‐seq experiments in NALM‐6 and in a primary BCP‐ALL cell line confirmed this role, highlighting how this protein is required for control in the expression of several genes involved in cell growth. Consistent with these findings, ChIP‐seq analyses demonstrated the presence of Che‐1 on 2,205‐derived TSSs, including promoters of cell‐cycle regulatory genes, consolidating the role of Che‐1 as part of the transcriptional apparatus.
Che‐1 resulted to be upregulated at transcriptional level in BCP‐ALL samples, and this effect is mainly due to the specific activity of the oncogene c‐Myc found recruited at both the murine and the human Che‐1 promoter. In agreement with this result, we found a strong increase in c‐Myc expression in most BCP‐ALL patients analyzed, in strict correlation with Che‐1 expression, supporting the evidence that Che‐1 is a direct target of c‐Myc. In addition, the strong correlation between the expressions of these two genes was noticed in a broader dataset including several hematological malignancies. Of note, Che‐1 was recently found to be upregulated during multiple myeloma progression 11, a disease in which c‐Myc was found highly deregulated 32. Aberrations that can alter the expression of c‐Myc are involved in many hematological malignancies, especially in Burkitt's lymphoma and diffuse large B‐cell lymphoma 33, 34. However, so far, only a single previous work by Allen et al 35 suggested a possible association of c‐Myc with a higher risk of relapse in BCP‐ALL.
Our data not only confirm the high expression of this oncogene in patients with BCP‐ALL, but also reveal its importance in the proliferation of this disease. c‐Myc gene is located on the long arm of chromosome 8. In Burkitt's lymphoma and diffuse large B‐cell lymphoma, c‐Myc deregulation is mainly due to the reciprocal translocation of chromosome 8 and chromosomes 14, 2, or 22, containing the light or heavy chain genes of immunoglobulins 36. The patients analyzed in our study did not carry these rearrangements, thus indicating that other molecular mechanisms, such as gene amplification or post‐transcriptional or translational modifications found in numerous other forms of cancer 37, 38, may be the basis of the observed overexpression of c‐Myc. Further studies may shed light on how the expression of this oncogene is regulated in BCP‐ALL.
The data reported in this study indicate that Che‐1 and c‐Myc regulate the expression of the same genes in BCP‐ALL cells, many of them being involved in the control of cell proliferation. Consistent with these findings, Che‐1 overexpression in c‐Myc‐silenced cells was able to rescue the effects of c‐Myc inhibition, indicating that, at least in part, Che‐1 could act as a transcriptional effector of c‐Myc activity. Published studies aimed at clarifying c‐Myc mechanism of action have led to dramatically different models regarding the role of c‐Myc in transcriptional control. One hypothesis proposes a model sustaining c‐Myc as an amplifier of the transcriptional program already active in each cell causing an increased RNA content 39, 40. In contrast, a different scenario was proposed by Kress et al 41, in which c‐Myc activates and represses selected target genes, with RNA amplification occurring only as secondary consequence by an indirect function. In addition, it has been demonstrated that a stretch of chromatin bearing high H3 K4/K79 methylation and H3 acetylation, which is generally associated with a pre‐engaged basal transcription machinery, is a strict pre‐requisite for the recognition of any target site by Myc 42. Our data strongly support the second model, in which Che‐1, a direct target of c‐Myc, plays an important role in cell proliferation, sustaining the transcription of several genes involved in this pathway.
Moreover, co‐immunoprecipitation experiments showed physical interaction between Che‐1 and c‐Myc, and the comparison of the ChIP‐seq experiments performed with c‐Myc or Che‐1 antibodies showed the presence of both proteins on promoters of genes involved in cell proliferation. Notably, Che‐1 downregulation produced a strong reduction in c‐Myc recruitment on these promoters, indicating an additional role of Che‐1 in c‐Myc activity.
In summary, in this study, we identify Che‐1's pivotal role in the control of BCP‐ALL proliferation, supporting c‐Myc recruitment on only a particular cluster of genes, thus clarifying one of the molecular mechanisms responsible for BCP‐ALL onset. Moreover, the central role of Che‐1 in inducing leukemic blast cell division represents a new opportunity for developing novel cancer therapies, in particular in relapsed patients, where failure of available therapeutic options is a common event.
Materials and Methods
Patients’ characteristics
Patients with newly diagnosed or relapsed BCP‐ALL were treated at IRCCS Bambino Gesù Children's Hospital (Rome), a center affiliated with the “Italian Association of Pediatric Hematology/Oncology” (AIEOP) network. The “newly diagnosed” group consisted of 80 patients, 45 males (56%), and 35 females (44%), with a median age at diagnosis of 4.57 years (range 1.11–17.16). The group of relapsed patients included 14 patients, six males (43%), and eight females (57%), with a median age at diagnosis of 4.01 years (range 0.90–22.10) and a median age at relapse of 10.32 (range 2.88–26.25). BM samples exceeding the amount needed for molecular characterization and minimal residual disease (MRD) monitoring were cryopreserved in fetal bovine serum (FBS) with 10% dimethyl‐sulfoxide at time of diagnosis and/or disease relapse and used for in vitro studies, as detailed below. Patients and/or their legal guardians gave written informed consent. BM used as negative controls were obtained from age‐matched or adult healthy donors (HBM) who donated BM for transplantation of a sibling at Bambino Gesù Children's Hospital. The Bambino Gesù Children's Hospital Institutional Review Board approved the study. Informed consent was obtained from all subjects, and the experiments were conformed to the principles set out in the WMA Declaration of Helsinki and the Department of Health and Human Services Belmont Report. Details on patient and disease characteristics are summarized in Table 1.
Cell lines, constructs, and transfections
NALM‐6 cells were bought from ATCC (CRL‐3273), P493‐6 cells were kindly provided by Dr. B. Amati; LAL‐B, LAL‐B#2, and LAL‐B#3 were obtained by BCP‐ALL bone marrow mononuclear cells infected with Epstein–Barr virus for immortalization. All cell lines were cultured in RPMI‐1640 medium supplemented with 10% FBS (NALM‐6 and LAL‐B) or 10% tetracycline‐free FBS (P493‐6). All cell lines were tested for mycoplasma contamination by PCR with the following primers:
Forward 5′‐ACTCCTACGGGAGGCAGCAGTA‐3′
Reverse 5′‐TCGACCATCTGTCACTCTGTTAAC‐3′
To reduce c‐Myc expression, P493‐6 cells were treated with 0.1 μg/ml tetracycline (Merck, Darmstadt, Germany) for 72 h, and then, c‐Myc expression was induced by three washes with RPMI‐1640 medium. Transfections were carried out by Lipofectamine 3000 (Life Technologies, Waltham, MA) following the manufacturer's instructions. Nucleofection of NALM‐6 and LAL‐B cells was made using Amaxa 4D‐Nucleofector X Kit L (Lonza, IT) by following the manufacturer's instructions. The following plasmids were used in transfection experiments: Myc‐Che‐1 10, pCS2‐MT as control vector, the plasmid containing the firefly luciferase reporter under the control of murine Che‐1 (mChe‐1) promoter.
Total cell extracts, immunoprecipitation, and Western blotting
Cells were treated as described in Bruno et al 10. An equal amount of proteins was taken, pre‐cleared with 20 μl of protein G Agarose (Life Technologies, Waltham, MA), and then immunoprecipitated with 2 μg of desired antibody overnight at 4°C. Western blotting analysis of protein samples was carried out by standard procedures using the following antibodies: The rabbit polyclonal antibodies were anti‐Che‐1 6, anti‐AATF (A301‐032A, Bethyl, TX), anti‐c‐Myc (N‐262) (sc‐764, Santa Cruz, CA), anti‐p21 (Santa Cruz, CA); anti‐PARP p85 (G7341, Promega, WI), anti‐PUMA (PC686, Merck, DK), and anti‐Caspase‐7 (9492, Cell Signaling, MA), and mouse monoclonal antibodies were anti‐β‐actin (clone AC‐15, Merck, DK), anti‐Cyclin B1 (D5C10, Cell Signaling, Beverly, MA), anti‐Cyclin E (HE12, Santa Cruz, CA). Secondary antibodies used were goat anti‐mouse and goat anti‐rabbit, conjugated to horseradish peroxidase (Bio‐Rad, CA). Immunostained bands were detected by the chemiluminescent method (Pierce, Euroclone, IT), and the images were acquired using Alliance system by UVITECH, Cambridge.
Samples preparation
Mononuclear cells were isolated from BM samples by density gradient centrifugation on Ficoll–Hypaque (Uppsala, Sweden).
FACS analysis
Cells were first labeled with Pc7‐anti‐CD19 (J3‐119), PE‐anti‐CD10 (ALB1), BV421‐anti‐CD34 (581), and PerCP‐anti‐CD45 (5B1) mAbs 8 (BD, NY), followed by sequential fixation and permeabilization. Then, the cells were stained with anti‐Che‐1 antibody followed by Alexa‐Fluor 488‐conjugated anti‐rabbit antibody (Immunological Sciences, SIC, IT) and/or FITC‐anti‐c‐Myc (9E10, ABCAM, IT). Cytofluorimetric analysis of cellular DNA content was performed on propidium iodide‐stained cells by Guava easyCyte Cytometer (Merck, DK).
siRNA
siRNA experiments of Che‐1 and c‐Myc expression were performed by transfecting a specific pool of three double‐stranded RNA oligonucleotides [siChe‐1 (nucleotides: 893–917; 994–1,018; 1,093–1,117); si c‐Myc (nucleotides: 22–47; 746–771; 1,270–1,295) (Stealth, Life Technologies, MA)] using nucleofector (Lonza, IT), or Lipofectamine 3000 (Life Technologies, MA)]. Stealth siRNA negative control oligos (siControl) were purchased from Life Technologies (Waltham, MA).
Viral vectors
Lentiviral vectors pLV‐TH (shControl), pLV‐shChe‐1 TH, and pLV‐tTR‐KRAB 43 were produced as previously described (shChe‐1 sequence: nucleotides 824–842) 21. Lentiviral stocks were titrated following standard protocols 43, and, routinely, a viral titer of 106 transducing units per ml (TU/ml) was achieved. NALM‐6 and LAL‐B cell lines were infected with shControl or shChe‐1 lentiviral particles by spin inoculation at MOI of 3. After 24 h, cells were sorted for GFP expression using a BD FACS ARIA III cell sorter and infected with pLV‐tTR‐KRAB lentiviral particles by spin inoculation at MOI of 3.
Proliferation and viability assay
NALM‐6, LAL‐B, and LAL‐B #2 cells (1 × 10⁶) were nucleoporated as described for silencing of Che‐1 or c‐Myc proteins. At the indicated time points (24, 36, 48 h), cells were harvested and analyzed by Countess automated cell counter (Thermo Fisher Scientific, IT), that performs cell count and viability measurements using trypan blue stain. Downregulation of protein expression was verified for each time points by WB.
RNA isolation and quantitative RT–PCR analysis
Total RNA from NALM‐6 and LAL‐B cells, from HBMs and BCP‐ALL patients, was isolated using TRizol reagent (Life Technologies, MA) following the manufacturer's instructions. The first‐strand cDNA was synthesized with random primers and M‐MLV reverse transcriptase (Life Technologies, MA). The cDNA was used for quantitative real‐time PCR (qRT–PCR) experiments carried out in a 7500 Fast Real‐Time PCR System (Applied Biosystems, CA). ΔΔC t values were normalized with those obtained from the amplification of the endogenous β‐actin gene. The following human‐specific primers were employed in RT–PCR amplifications:
| Che‐1 forward | 5′‐CCGGAATTCGGATAAGACCAAACTGGCT‐3′ |
| Che‐1 reverse | 5′‐CCGCTCGAGGAGTTCTCGAAGGAGCTG‐3′ |
| MLL1 forward | 5′‐GACACATGGATGCAGACCAC‐3′ |
| MLL1 reverse | 5′‐CGGGCCAGGACTATCAGTAG‐3′ |
| ANP32 forward | 5′‐TCCGCCGCTAGCAAACCCTTC‐3′ |
| ANP32 reverse | 5′‐GGTCCGGTTCCTCAGCTCCAG‐3′ |
| FOXM1 forward | 5′‐CACCCCAGTGCCAACCGCTACTTG‐3′ |
| FOXM1 reverse | 5′‐AAAGAGGAGCTATCCCCTCCTCAG‐3′ |
| CDK1 forward | 5′‐GGAAGGGGTTCCTAGTACTGC‐3′ |
| CDK1 reverse | 5′‐TGGAATCCTGCATAAGCACA‐3′ |
| Cyclin B1 forward | 5′‐GTTCCTACGGCCCCTGCT‐3′ |
| Cyclin B1 reverse | 5′‐ATTTTGGCCTGCAGTTGTT‐3′ |
| β‐actin forward | 5′‐GACAGGATGCAGAAGGAGATTACT‐3′ |
| β‐actin reverse | 5′‐TGATCCACATCTGCTGGAAGGT‐3′ |
Mutagenesis
Mutagenesis of mChe‐1 promoter was performed using the QuikChange Mutagenesis kit (Stratagene, CA), altering the canonical E‐box sequence CACGTG in TTCGAC. Sequencing was realized by Genechron (Rome, IT).
Luciferase assay
Cell extracts were prepared and assayed for luciferase activity according to the manufacturer's instructions (Promega, WI) using the GloMax Luminometer (Promega, WI). Total protein quantification in the extracts was determined by Bradford assay, and luciferase activity of an equal amount of proteins was determined.
Pull‐down assay
Che‐1 deletions were cloned into the pGEX4T3 vector to produce glutathione‐S‐transferase (GST) fusion proteins as previously described (Fanciulli et al 6). For in vitro binding assays, comparable amounts of resin‐bound GST fusion proteins were incubated with 10 μl of in vitro transcribed/translated c‐Myc reaction for 1 h at 4°C. The resins were then pelleted and extensively washed in the same buffer. The bound proteins were separated by SDS–PAGE, and the gels were analyzed by Western blot using anti‐c‐Myc antibody. Immunoreactivity was detected by ECL chemiluminescence reaction (Amersham). In vitro transcription and translation were carried out with 1‐Step Human High‐Yield Mini IVT Kit (Thermo Scientific, IT) by following the manufacturer's instructions.
Chromatin immunoprecipitation assay (ChIP)
ChIP assays in P493‐6, NALM‐6 and LAL‐B cells were performed as previously described 9 by using anti‐Che‐1 (A301‐032A Bethyl, TX) or anti‐c‐Myc (sc‐764X, Santa Cruz, CA) antibodies. Immunoprecipitations with immunoglobulins (Santa Cruz, CA) were performed as negative controls. For quantitative ChIP analysis (ChIP–qPCR), 1 μl of purified DNA was used for amplification on an Applied Biosystems 7500 Fast Real‐Time PCR system (Applied Biosystem SYBR Green). The following human promoter‐specific primers were employed in RT–PCR amplifications:
| Che‐1 promoter forward | 5′‐AGCGCTTTGCCGACTTTACA‐3′ |
| Che‐1 promoter reverse | 5′‐GCTTGGTCTGTGTCCTTCGAA‐3′ |
| FGFR1 promoter forward | 5′‐GGGAACAATGGAGCCGGAGCT‐3′ |
| FGFR1 promoter reverse | 5′‐GGTCTGCAAGGAAAGTGAGGC‐3′ |
| LEF1 promoter forward | 5′‐GTATCCAACCCTTCGCCCT‐3′ |
| LEF1 promoter reverse | 5′‐CGATATAAGGCACGGCTCG‐3′ |
| SCP2 promoter forward | 5′‐AAACGTGGCCTCGGCTTAAT‐3′ |
| SCP2 promoter reverse | 5′‐AACTTGCCTCTTTCCGGCTT‐3′ |
| ZMYND8 promoter forward | 5′‐GCCACATGCCTGGATCTACA‐3′ |
| ZMYND8 promoter reverse | 5′‐TAACAGGCAGGAAGCCGAAG‐3′ |
| PTEN promoter forward | 5′‐AGTCGCCTGTCACCATTTCC‐3′ |
| PTEN promoter reverse | 5′‐GCCCGGGTCCCTGGATGTGC‐3′ |
| PLK1 promoter forward | 5′‐AACCGCAGGAGCTTTCCCGGA‐3′ |
| PLK1 promoter reverse | 5′‐GGGAAAACCTGATTGACACGG‐3′ |
| CDK13 promoter forward | 5′‐CATCTGGTGTTTTCGCTGCC‐3′ |
| CDK13 promoter reverse | 5′‐TTCCAGGTCACAGTGGGGTA‐3′ |
| Ncl promoter forward | 5′‐TTTTGCGACGCGTACGAG‐3′ |
| Ncl promoter reverse | 5′‐ACTAGGGCCGATACCGCC‐3′ |
| AchR promoter forward | 5′‐CCTTCATTGGGATCACCACG‐3′ |
| AchR promoter reverse | 5′‐AGGAGATGAGTACCAGCAGGTTG‐3′ |
| H2AB promoter forward | 5′‐ACTCTCCTTACGGGTCCTCTTG‐3′ |
| H2AB promoter reverse | 5′‐AGTGCTGTGTAACCCTGGAAAA‐3′ |
ChIP‐sequencing
ChIP assays were performed as previously described in Ref. 9 by using rabbit polyclonal antibodies ChIP grade, anti‐Che‐1 (Bethyl), and anti‐c‐Myc (sc‐764X, Santa Cruz). The quantity of the immunoprecipitated material was determined by Qubit 2.0 fluorometer (Life Technologies). About 10 ng of the immunoprecipitated chromatin was used to prepare the libraries for sequencing by following the manufacturer's instructions including DNA and repairing, adaptor ligation, and amplification (Illumina, CA). The libraries were then sequenced using the NextSeq 500 system (Illumina, CA).
RNA‐sequencing
Total RNA was extracted from NALM‐6, LAL‐B, and P493‐6 cells using Qiazol (Qiagen, IT), purified from DNA contamination through a DNase I (Qiagen, IT) digestion step, and further enriched by Qiagen RNeasy columns for gene expression profiling (Qiagen, IT). Quantity and integrity of the extracted RNA were assessed by NanoDrop Spectrophotometer (NanoDrop Technologies, DE) and by Agilent 2100 Bioanalyzer (Agilent Technologies, CA), respectively. RNA libraries for sequencing were generated in triplicate according to the Illumina TruSeq Stranded Total RNA kit with an initial ribosomal depletion step using Ribo Zero Gold (Illumina, CA). The libraries were quantified by qPCR and sequenced in paired‐end mode (2 × 75 bp) with NextSeq 500 (Illumina, CA). For each sample generated by the Illumina platform, a pre‐process step for quality control was performed to assess sequence data quality and to discard low‐quality reads.
Bioinformatic analysis
RNA‐seq data were analyzed thanks to the RAP pipeline 44, a Tuxedo‐suite‐based workflow, with a “second strand” parameter to take into account the stranded read library. For spike‐in‐normalized results, we extracted HTseq raw counts from the pipeline results, normalized them and calculated final DE genes with DEseq2 package (Bioconductor) 45. For the common transcriptional signature on NALM‐6 cells, we used a corrected P‐value filter of 0.1 to extract the 461 gene set overlap. The overlap on downregulated P493‐6 signatures was carried out on both samples via standard Cufflinks–Cuffdiff analysis 46.
ChIP‐seq data underwent basic analysis (QC; mapping; MACS2 peak calling) with the CAST pipeline at CINECA. Multiple library ChIP‐seq comparison was generated with Deeptools (computeMatrix command on multiple bigwigs and plotHeatmap) 47. For Che‐1 versus c‐Myc libraries enrichment, a simple bed tool intersect command was executed on MACS2 peaks for the three libraries (Che‐1 LAL‐B, Che‐1 NALM‐6, and c‐Myc P493‐6 high Myc) 48. The peaks were annotated with Homer and analyzed for GO with Enrichr web tool 49. Motif analysis was carried out with the Centdist tool 50. All high‐throughput data (ChIP‐seq and RNA‐seq) were submitted to the GEO archive (GSE93628).
Statistical analysis
All statistical tests were carried out using GraphPad Prism version 5.0 for Windows, GraphPad Software, San Diego California, USA (www.graphpad.com). Mann–Whitney U‐test was used to compare patients’ data because of distribution. Probability values generated by Student's t‐test or Mann–Whitney U‐test considered to be statistically significant are *P ≤ 0.05; **P ≤ 0.01; ***P ≤ 0.001.
Author contributions
VF, CS, MP, FDN, FG, VB, PR, GS, SI, VC, and TB performed the experiments, analyzed the data, and contributed to the study design; LS and AP followed the patients and provided leukemia samples; CP, EM, and GB contributed to the study design; VF, CS, MP, LS, FL, and MF conceived the study and drafted the manuscript; MF and FL supervised the study and critically revised the manuscript.
Conflict of interest
The authors declare that they have no conflict of interest.
Supporting information
Expanded View Figures PDF
Dataset EV1
Dataset EV2
Dataset EV3
Dataset EV4
Source Data for Expanded View
Review Process File
Source Data for Figure 1
Source Data for Figure 2
Source Data for Figure 5
Source Data for Figure 6
Source Data for Figure 7
Acknowledgements
We acknowledge the CINECA award under the ISCRA initiative, for the availability of high‐performance computing resources and support. Dr. Cristina Sorino's fellowship is supported by a grant from Veronesi Foundation. We thank Mrs. Tania Merlino for the English revision of the paper. This work was also supported by grants from AIRC (Special Grant “5xmille”‐9962 to F.L.), (Grant number 15255 to M.F.), Ministero della Salute (RF‐2010‐2316606 to F.L.; Ricerca Corrente to F.L.), and Regione Lazio (Grant FILAS to F.L.).
EMBO Reports (2018) 19: e44871
Contributor Information
Valentina Folgiero, Email: valentina.folgiero@opbg.net.
Maurizio Fanciulli, Email: maurizio.fanciulli@ifo.gov.it.
References
- 1. Locatelli F, Schrappe M, Bernardo ME, Rutella S (2012) How I treat relapsed childhood acute lymphoblastic leukemia. Blood 120: 2807–2816 [DOI] [PubMed] [Google Scholar]
- 2. Wiemels J (2012) Perspectives on the causes of childhood leukemia. Chem Biol Interact 196: 59–67 [DOI] [PMC free article] [PubMed] [Google Scholar]
- 3. Uderzo C, Conter V, Dini G, Locatelli F, Miniero R, Tamaro P (2001) Treatment of childhood acute lymphoblastic leukemia after the first relapse: curative strategies. Haematologica 86: 1–7 [PubMed] [Google Scholar]
- 4. Zhou Y, Kanagal‐Shamanna R, Zuo Z, Tang G, Medeiros LJ, Bueso‐Ramos CE (2016) Advances in B‐lymphoblastic leukemia: cytogenetic and genomic lesions. Ann Diagn Pathol 23: 43–50 [DOI] [PubMed] [Google Scholar]
- 5. Inaba H, Greaves M, Mullighan CG (2013) Acute lymphoblastic leukaemia. Lancet 381: 1943–1955 [DOI] [PMC free article] [PubMed] [Google Scholar]
- 6. Fanciulli M, Bruno T, Di Padova M, De Angelis R, Iezzi S, Iacobini C, Floridi A, Passananti C (2000) Identification of a novel partner of RNA polymerase II subunit 11, Che‐1, which interacts with and affects the growth suppression function of Rb. FASEB J 14: 904–912 [DOI] [PubMed] [Google Scholar]
- 7. Thomas T, Voss AK, Petrou P, Gruss P (2000) The murine gene, Traube, is essential for the growth of preimplantation embryos. Dev Biol 227: 324–342 [DOI] [PubMed] [Google Scholar]
- 8. Bruno T, Valerio M, Casadei L, De Nicola F, Goeman F, Pallocca M, Catena V, Iezzi S, Sorino C, Desantis A et al (2017) Che‐1 sustains hypoxic response of colorectal cancer cells by affecting Hif‐1alpha stabilization. J Exp Clin Cancer Res 36: 32 [DOI] [PMC free article] [PubMed] [Google Scholar]
- 9. Bruno T, De Angelis R, De Nicola F, Barbato C, Di Padova M, Corbi N, Libri V, Benassi B, Mattei E, Chersi A et al (2002) Che‐1 affects cell growth by interfering with the recruitment of HDAC1 by Rb. Cancer Cell 2: 387–399 [DOI] [PubMed] [Google Scholar]
- 10. Bruno T, De Nicola F, Iezzi S, Lecis D, D'Angelo C, Di Padova M, Corbi N, Dimiziani L, Zannini L, Jekimovs C et al (2006) Che‐1 phosphorylation by ATM/ATR and Chk2 kinases activates p53 transcription and the G2/M checkpoint. Cancer Cell 10: 473–486 [DOI] [PubMed] [Google Scholar]
- 11. Desantis A, Bruno T, Catena V, De Nicola F, Goeman F, Iezzi S, Sorino C, Ponzoni M, Bossi G, Federico V et al (2015) Che‐1‐induced inhibition of mTOR pathway enables stress‐induced autophagy. EMBO J 34: 1214–1230 [DOI] [PMC free article] [PubMed] [Google Scholar]
- 12. Page G, Lodige I, Kogel D, Scheidtmann KH (1999) AATF, a novel transcription factor that interacts with Dlk/ZIP kinase and interferes with apoptosis. FEBS Lett 462: 187–191 [DOI] [PubMed] [Google Scholar]
- 13. Guo Q, Xie J (2004) AATF inhibits aberrant production of amyloid beta peptide 1‐42 by interacting directly with Par‐4. J Biol Chem 279: 4596–4603 [DOI] [PubMed] [Google Scholar]
- 14. De Nicola F, Bruno T, Iezzi S, Di Padova M, Floridi A, Passananti C, Del Sal G, Fanciulli M (2007) The prolyl isomerase Pin1 affects Che‐1 stability in response to apoptotic DNA damage. J Biol Chem 282: 19685–19691 [DOI] [PubMed] [Google Scholar]
- 15. Di Certo MG, Corbi N, Bruno T, Iezzi S, De Nicola F, Desantis A, Ciotti MT, Mattei E, Floridi A, Fanciulli M et al (2007) NRAGE associates with the anti‐apoptotic factor Che‐1 and regulates its degradation to induce cell death. J Cell Sci 120: 1852–1858 [DOI] [PubMed] [Google Scholar]
- 16. Kaul D, Mehrotra A (2007) Functional characterization of AATF transcriptome in human leukemic cells. Mol Cell Biochem 297: 215–220 [DOI] [PubMed] [Google Scholar]
- 17. Bacalini MG, Tavolaro S, Peragine N, Marinelli M, Santangelo S, Del Giudice I, Mauro FR, Di Maio V, Ricciardi MR, Caiafa P et al (2012) A subset of chronic lymphocytic leukemia patients display reduced levels of PARP1 expression coupled with a defective irradiation‐induced apoptosis. Exp Hematol 40: 197–206.e1 [DOI] [PubMed] [Google Scholar]
- 18. Miller DM, Thomas SD, Islam A, Muench D, Sedoris K (2012) c‐Myc and cancer metabolism. Clin Cancer Res 18: 5546–5553 [DOI] [PMC free article] [PubMed] [Google Scholar]
- 19. Worch J, Rohde M, Burkhardt B (2013) Mature B‐cell lymphoma and leukemia in children and adolescents‐review of standard chemotherapy regimen and perspectives. Pediatr Hematol Oncol 30: 465–483 [DOI] [PubMed] [Google Scholar]
- 20. Sabo A, Kress TR, Pelizzola M, de Pretis S, Gorski MM, Tesi A, Morelli MJ, Bora P, Doni M, Verrecchia A et al (2014) Selective transcriptional regulation by Myc in cellular growth control and lymphomagenesis. Nature 511: 488–492 [DOI] [PMC free article] [PubMed] [Google Scholar]
- 21. Bruno T, Desantis A, Bossi G, Di Agostino S, Sorino C, De Nicola F, Iezzi S, Franchitto A, Benassi B, Galanti S et al (2010) Che‐1 promotes tumor cell survival by sustaining mutant p53 transcription and inhibiting DNA damage response activation. Cancer Cell 18: 122–134 [DOI] [PubMed] [Google Scholar]
- 22. Lee C, Huang CH (2013) LASAGNA‐Search: an integrated web tool for transcription factor binding site search and visualization. Biotechniques 54: 141–153 [DOI] [PubMed] [Google Scholar]
- 23. Kuleshov MV, Jones MR, Rouillard AD, Fernandez NF, Duan Q, Wang Z, Koplev S, Jenkins SL, Jagodnik KM, Lachmann A et al (2016) Enrichr: a comprehensive gene set enrichment analysis web server 2016 update. Nucleic Acids Res 44: W90–W97 [DOI] [PMC free article] [PubMed] [Google Scholar]
- 24. Kohrer S, Havranek O, Seyfried F, Hurtz C, Coffey GP, Kim E, Ten Hacken E, Jager U, Vanura K, O'Brien S et al (2016) Pre‐BCR signaling in precursor B‐cell acute lymphoblastic leukemia regulates PI3K/AKT, FOXO1 and MYC, and can be targeted by SYK inhibition. Leukemia 30: 1246–1254 [DOI] [PMC free article] [PubMed] [Google Scholar]
- 25. Hiratsuka T, Takei Y, Ohmori R, Imai Y, Ozeki M, Tamaki K, Haga H, Nakamura T, Tsuruyama T (2016) ZFP521 contributes to pre‐B‐cell lymphomagenesis through modulation of the pre‐B‐cell receptor signaling pathway. Oncogene 35: 3227–3238 [DOI] [PubMed] [Google Scholar]
- 26. Saba NS, Angelova M, Lobelle‐Rich PA, Levy LS (2015) Disruption of pre‐B‐cell receptor signaling jams the WNT/beta‐catenin pathway and induces cell death in B‐cell acute lymphoblastic leukemia cell lines. Leuk Res 39: 1220–1228 [DOI] [PubMed] [Google Scholar]
- 27. Ma S, Pathak S, Mandal M, Trinh L, Clark MR, Lu R (2010) Ikaros and Aiolos inhibit pre‐B‐cell proliferation by directly suppressing c‐Myc expression. Mol Cell Biol 30: 4149–4158 [DOI] [PMC free article] [PubMed] [Google Scholar]
- 28. Mishra BP, Zaffuto KM, Artinger EL, Org T, Mikkola HK, Cheng C, Djabali M, Ernst P (2014) The histone methyltransferase activity of MLL1 is dispensable for hematopoiesis and leukemogenesis. Cell Rep 7: 1239–1247 [DOI] [PMC free article] [PubMed] [Google Scholar]
- 29. Yang S, Zhou L, Reilly PT, Shen SM, He P, Zhu XN, Li CX, Wang LS, Mak TW, Chen GQ et al (2016) ANP32B deficiency impairs proliferation and suppresses tumor progression by regulating AKT phosphorylation. Cell Death Dis 7: e2082 [DOI] [PMC free article] [PubMed] [Google Scholar]
- 30. Sorino C, Bruno T, Desantis A, Di Certo MG, Iezzi S, De Nicola F, Catena V, Floridi A, Chessa L, Passananti C et al (2013) Centrosomal Che‐1 protein is involved in the regulation of mitosis and DNA damage response by mediating pericentrin (PCNT)‐dependent Chk1 protein localization. J Biol Chem 288: 23348–23357 [DOI] [PMC free article] [PubMed] [Google Scholar]
- 31. Bruno T, Iezzi S, Fanciulli M (2016) Che‐1/AATF: a critical cofactor for both wild‐type‐ and mutant‐p53 proteins. Front Oncol 6: 34 [DOI] [PMC free article] [PubMed] [Google Scholar]
- 32. Szabo AG, Gang AO, Pedersen MO, Poulsen TS, Klausen TW, Norgaard P (2016) Overexpression of c‐myc is associated with adverse clinical features and worse overall survival in multiple myeloma. Leuk Lymphoma 57: 2526–2534 [DOI] [PubMed] [Google Scholar]
- 33. Li Z, Van Calcar S, Qu C, Cavenee WK, Zhang MQ, Ren B (2003) A global transcriptional regulatory role for c‐Myc in Burkitt's lymphoma cells. Proc Natl Acad Sci USA 100: 8164–8169 [DOI] [PMC free article] [PubMed] [Google Scholar]
- 34. Yoon SO, Jeon YK, Paik JH, Kim WY, Kim YA, Kim JE, Kim CW (2008) MYC translocation and an increased copy number predict poor prognosis in adult diffuse large B‐cell lymphoma (DLBCL), especially in germinal centre‐like B cell (GCB) type. Histopathology 53: 205–217 [DOI] [PubMed] [Google Scholar]
- 35. Allen A, Gill K, Hoehn D, Sulis M, Bhagat G, Alobeid B (2014) C‐myc protein expression in B‐cell acute lymphoblastic leukemia, prognostic significance? Leuk Res 38: 1061–1066 [DOI] [PubMed] [Google Scholar]
- 36. Wasylishen AR, Penn LZ (2010) Myc: the beauty and the beast. Genes Cancer 1: 532–541 [DOI] [PMC free article] [PubMed] [Google Scholar]
- 37. Alitalo K, Schwab M, Lin CC, Varmus HE, Bishop JM (1983) Homogeneously staining chromosomal regions contain amplified copies of an abundantly expressed cellular oncogene (c‐myc) in malignant neuroendocrine cells from a human colon carcinoma. Proc Natl Acad Sci USA 80: 1707–1711 [DOI] [PMC free article] [PubMed] [Google Scholar]
- 38. Dalla‐Favera R, Wong‐Staal F, Gallo RC (1982) Onc gene amplification in promyelocytic leukaemia cell line HL‐60 and primary leukaemic cells of the same patient. Nature 299: 61–63 [DOI] [PubMed] [Google Scholar]
- 39. Lin CY, Loven J, Rahl PB, Paranal RM, Burge CB, Bradner JE, Lee TI, Young RA (2012) Transcriptional amplification in tumor cells with elevated c‐Myc. Cell 151: 56–67 [DOI] [PMC free article] [PubMed] [Google Scholar]
- 40. Nie Z, Hu G, Wei G, Cui K, Yamane A, Resch W, Wang R, Green DR, Tessarollo L, Casellas R et al (2012) c‐Myc is a universal amplifier of expressed genes in lymphocytes and embryonic stem cells. Cell 151: 68–79 [DOI] [PMC free article] [PubMed] [Google Scholar]
- 41. Kress TR, Sabo A, Amati B (2015) MYC: connecting selective transcriptional control to global RNA production. Nat Rev Cancer 15: 593–607 [DOI] [PubMed] [Google Scholar]
- 42. Guccione E, Martinato F, Finocchiaro G, Luzi L, Tizzoni L, Dall'Olio V, Zardo G, Nervi C, Bernard L, Amati B (2006) Myc‐binding‐site recognition in the human genome is determined by chromatin context. Nat Cell Biol 8: 764–770 [DOI] [PubMed] [Google Scholar]
- 43. Wiznerowicz M, Trono D (2003) Conditional suppression of cellular genes: lentivirus vector‐mediated drug‐inducible RNA interference. J Virol 77: 8957–8961 [DOI] [PMC free article] [PubMed] [Google Scholar]
- 44. D'Antonio M, D'Onorio De Meo P, Pallocca M, Picardi E, D'Erchia AM, Calogero RA, Castrignano T, Pesole G (2015) RAP: RNA‐Seq Analysis Pipeline, a new cloud‐based NGS web application. BMC Genom 16: S3 [DOI] [PMC free article] [PubMed] [Google Scholar]
- 45. Love MI, Huber W, Anders S (2014) Moderated estimation of fold change and dispersion for RNA‐seq data with DESeq2. Genome Biol 15: 550 [DOI] [PMC free article] [PubMed] [Google Scholar]
- 46. Trapnell C, Roberts A, Goff L, Pertea G, Kim D, Kelley DR, Pimentel H, Salzberg SL, Rinn JL, Pachter L (2012) Differential gene and transcript expression analysis of RNA‐seq experiments with TopHat and Cufflinks. Nat Protoc 7: 562–578 [DOI] [PMC free article] [PubMed] [Google Scholar]
- 47. Ramirez F, Dundar F, Diehl S, Gruning BA, Manke T (2014) deepTools: a flexible platform for exploring deep‐sequencing data. Nucleic Acids Res 42: W187–W191 [DOI] [PMC free article] [PubMed] [Google Scholar]
- 48. Feng J, Liu T, Qin B, Zhang Y, Liu XS (2012) Identifying ChIP‐seq enrichment using MACS. Nat Protoc 7: 1728–1740 [DOI] [PMC free article] [PubMed] [Google Scholar]
- 49. Chen EY, Tan CM, Kou Y, Duan Q, Wang Z, Meirelles GV, Clark NR, Ma'ayan A (2013) Enrichr: interactive and collaborative HTML5 gene list enrichment analysis tool. BMC Bioinformatics 14: 128 [DOI] [PMC free article] [PubMed] [Google Scholar]
- 50. Zhang Z, Chang CW, Goh WL, Sung WK, Cheung E (2011) CENTDIST: discovery of co‐associated factors by motif distribution. Nucleic Acids Res 39: W391–W399 [DOI] [PMC free article] [PubMed] [Google Scholar]
Associated Data
This section collects any data citations, data availability statements, or supplementary materials included in this article.
Supplementary Materials
Expanded View Figures PDF
Dataset EV1
Dataset EV2
Dataset EV3
Dataset EV4
Source Data for Expanded View
Review Process File
Source Data for Figure 1
Source Data for Figure 2
Source Data for Figure 5
Source Data for Figure 6
Source Data for Figure 7


