Abstract
AKT signaling is modulated by a complex network of regulatory proteins and is commonly deregulated in cancer. Here, we present a dual mechanism of AKT regulation by the ERBB receptor feedback inhibitor 1 (ERRFI1). We show that in cells expressing high levels of EGFR, ERRF1 inhibits growth and enhances responses to chemotherapy. This is mediated in part through the negative regulation of AKT signaling by direct ERRFI1‐dependent inhibition of EGFR. In cells expressing low levels of EGFR, ERRFI1 positively modulates AKT signaling by interfering with the interaction of the inactivating phosphatase PHLPP with AKT, thereby promoting cell growth and chemotherapy desensitization. These observations broaden our understanding of chemotherapy response and have important implications for the selection of targeted therapies in a cell context‐dependent manner. EGFR inhibition can only sensitize EGFR‐high cells for chemotherapy, while AKT inhibition increases chemosensitivity in EGFR‐low cells. By understanding these mechanisms, we can take advantage of the cellular context to individualize antineoplastic therapy. Finally, our data also suggest targeting of EFFRI1 in EGFR‐low cancer as a promising therapeutic approach.
Keywords: AKT, AKT inhibitor, EGFR, ERRFI1, PHLPP
Subject Categories: Cancer, Signal Transduction
Introduction
The signaling network defined by the phosphatidylinositol 3‐kinase (PI3K) and AKT, also known as protein kinase B (PKB), controls a series of hallmarks of cancer, including the cell cycle, survival, metabolism, and genomic instability 1. PI3K synthesizes the second messenger PtdIns(3,4,5)P3 (PIP3), which can recruit AKT to the plasma membrane, where AKT is phosphorylated at Thr308 and Ser473 and activated 2. AKT Thr308 is phosphorylated by the 3‐phosphoinositide‐dependent protein kinase PDK1 3, and dephosphorylated by protein phosphatase 2A (PP2A) 4, whereas Ser473 is phosphorylated by mammalian target of rapamycin (mTOR) complex 2 (mTORC2) 5, and dephosphorylated by PH domain leucine‐rich repeat protein phosphatase (PHLPP) 6. The PI3K/AKT signaling pathway is inappropriately activated in many cancers 7, 8, 9, 10, 11, 12. The most widely observed mechanism of PI3K/AKT activation in human cancers is through the activation of receptor tyrosine kinases (RTKs) such as epidermal growth factor receptor (EGFR). Somatic mutations in specific components of the pathway could significantly affect the pathway activation. Various inhibitors have been developed to target this pathway. However, early results from clinical trials in advanced solid tumors showed limited single‐agent activity of inhibitors targeting this pathway 13, 14, 15, 16, 17, 18. Importantly, the mechanisms of AKT pathway activation will affect the likelihood of clinical benefit from PI3K/AKT inhibition. Interestingly, in lung cancers, the regulation of PI3K/AKT signaling affects their susceptibility to EGFR inhibitors. In EGFR inhibitor‐sensitive lung cancers, both AKT signaling and ERK signaling are under the sole control of EGFR. After treatment with EGFR inhibitors, both pathways shut down and the lung cancer cells undergo apoptosis. Reactivation of AKT signaling is almost invariably observed in cancers that naturally develop acquired resistance to EGFR inhibitors. In some resistance models, AKT signaling is reactivated and the extracellular regulated kinase (ERK) phosphorylation remains suppressed 19. Findings like this have spurred intensive studied on the regulation of AKT signaling. However, the understanding of the complexity and the scope of AKT regulation remains incomplete. Advancements in high‐throughput sequencing‐based genomewide association study now enable systems‐wide investigation of this regulation 20.
In this study, we employed an unbiased genomewide association study (GWAS) approach using genomewide SNPs, transcriptomics, and cytotoxicity of an AKT inhibitor, triciribine (TCN) in 263 human lymphoblastoid cell lines (LCLs) to help identify new candidate genes and new mechanisms that might be involved in AKT regulation 20. Triciribine, even though has other function beyond AKT inhibition, has been tested in phase I and II clinical trials where objective response was observed, although infrequently 21, 22. We demonstrate that a group of genes correlated with TCN response, suggesting their roles in regulation of AKT pathway. Subsequent functional validation studies revealed that ERBB receptor feedback inhibitor 1 (ERRFI1) significantly altered AKT activity in cancer cell lines.
ERRFI1 (the product of mitogen‐inducible gene 6, also known as MIG6) is known to inhibit EGFR activation as well as downstream signaling by docking onto EGFR kinase domain via its ERBB binding region 23. Specifically, ERRFI1 binds to the EGFR kinase domain, thus precluding formation of asymmetric kinase dimers and locking the EGFR kinase in a catalytically unproductive configuration 23. ERRFI1 can downregulate EGFR downstream MAP kinase ERK 24. We showed that ERRFI1 differentially regulate AKT and EGFR in a cellular context‐dependent manner, in this case, dependent on cellular EGFR levels. In cells expressing high EGFR level, as expected, ERRFI1 functions as a negative regulator of EGFR. However, in cells with low EGFR, we identified a novel mechanism of ERRFI1‐mediated AKT regulation that ERRFI1 positively modulates AKT signaling by blocking PHLPP accessing and dephosphorylating AKT, suggesting ERRFI1 as a potential target in EGFR‐low cancer. These results provide novel insight into AKT regulation, especially in relationship to EGFR level, and may help us to better stratify cancer patients and personalize therapy by selecting targeted drugs based on differing cellular contexts.
Results
AKT inhibitor GWAS
We took an unbiased approach to perform GWAS of cytotoxicity of AKT inhibitor to use drug as a probe to help identify potential new regulators involved in AKT regulation. Triciribine cytotoxicity studies were performed to determine the range of variation in TCN IC50 values among individual LCLs for which we have SNPs, expression data and for which we have used for various biomarker discovery 20. Figure 1A shows representative TCN cytotoxicity data. No significant differences were observed in IC50 values among the three racial groups studied (P = 0.183; Fig 1B). Gender also did not have a significant effect on IC50 values (P = 0.707; Fig 1C).
Figure 1. TCN cytotoxicity.
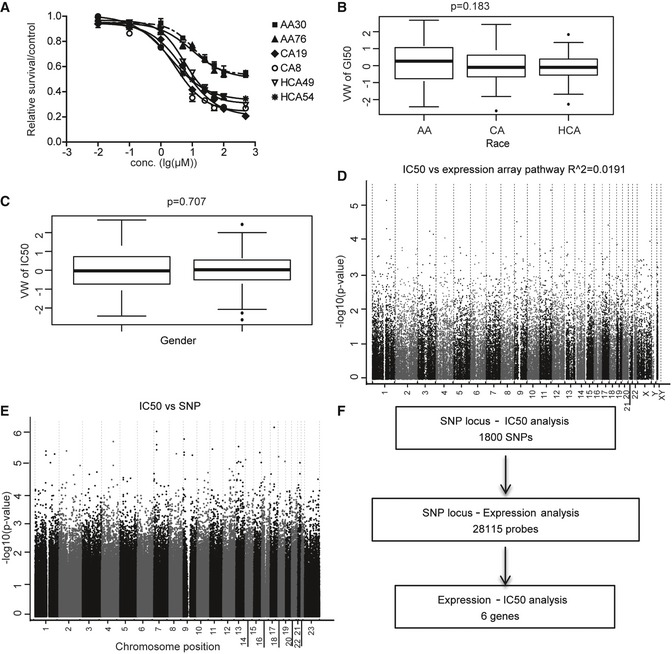
- Representative TCN cytotoxicity dose–response curves. Two cell lines from each of the three ethnic groups were selected to illustrate a range of TCN cytotoxicity “dose–response” curves. AA (African Americans), CA (Caucasian Americans), HCA (Han Chinese Americans). The x‐axis indicates TCN dose, and the y‐axis indicates the surviving fraction after TCN exposure. Data represent mean ± SEM of three replicates.
- TCN IC50 among three ethnic groups. Horizontal line: median; box limits: first and third quantiles; whiskers: if no points exist reaching beyond 1.5*IQR (inter‐quartile range) of the 1st and 3rd quantiles, then it's the smallest or largest data value, otherwise it is 1st quantile – 1.5*IQR or 3rd quantile + 1.5*IQR; dots: values outside of 1.5*IQR of the 1st and 3rd quantile. Statistical analyses were performed with the F‐test from a linear regression model of gender (1 numerator df) or race (2 numerator df) vs. van der Waerdan transformed IC50.
- Gender effect on TCN IC50 values. Horizontal line: median; box limits: first and third quantiles; whiskers: if no points exist reaching beyond 1.5*IQR (inter‐quartile range) of the 1st and 3rd quantiles, then it's the smallest or largest data value, otherwise it is 1st quantile – 1.5*IQR or 3rd quantile + 1.5*IQR; dots: values outside of 1.5*IQR of the 1st and 3rd quantile. Statistical analyses were performed with the F‐test from a linear regression model of gender (1 numerator df) or race (2 numerator df) vs. van der Waerdan transformed IC50.
- Association of basal expression with TCN IC50 for 263 LCLs. The y‐axis represents the −log10 (P‐value) for the association of individual expression array probe set. Expression probe sets are plotted on the x‐axis based on the chromosomal locations. If genes had more than one probe set, the one with the lowest P‐value was plotted.
- Genomewide SNP association with TCN IC50 for 263 LCLs. The y‐axis represents −log10 (P‐value) for the association of each SNP with TCN IC50. SNPs are plotted on the x‐axis based on their chromosomal locations.
- Schematic diagram of the strategy of integrated analysis used to select genes for functional validation.
The effect of genetic variation on TCN‐induced cytotoxicity might result, in part, from the regulation of gene expression. Previous studies performed with LCLs have shown that gene expression can be regulated by SNPs through either cis‐ or trans‐regulation 25, 26. Therefore, we also performed an “integrated analysis” that included data for SNPs, basal expression, and TCN IC50 (Fig 1D and E). Specifically, we identified 1,800 SNPs that were associated with IC50 with P < 10−3. These 1,800 SNPs were associated with 28,115 expression probe sets (Dataset EV1) with P < 10−4, and of these 28,115 probe sets, only six genes associated with IC50 with P < 10−3 expressed in LCLs We selected a less‐stringent P‐value cutoff to capture as much information as possible, realizing that many of the associations would be false positives. This overall selection strategy is depicted graphically in Fig 1F. This integrated analysis identified six unique SNPs associated with six expression probe sets representing six unique annotated genes, and those gene expression levels were also associated with TCN IC50 with P < 10−3 (Table EV1). Those six genes, RIT1, ZNF544, VEZT, JMJD3, AHCYL1, and FAM32A, were included in our functional validation studies.
We also applied gene‐level analysis to 16,778 unique genes, which assessed the overall evidence of association of a phenotype with variation in these individual genes 27, 28. These genes were nonpseudogenes and also contained genotyped or imputed SNPs that mapped to the defined gene regions based on build 36 and the NCBI's seq gene at the time when the project was initiated. Our gene‐level association with IC50 identified 26 genes with P < 0.001 (Table EV2). Among these 26 genes, 14 were not detectable at mRNA levels in LCLs. The other 12 genes were included in our functional validation studies including DCLRE1A, TAGLN2, GOLGA8B, LRRC47, SEMA4A, NFIL3, PIGS, MOV10, CAB39, GLOD4, SLC7A5, and ERRFI1.
Functional validation of candidate genes in tumor cell lines
Our initial association experiments were performed with human LCLs. Since non‐genetic factors might confound the results of those association studies, gene expression has tissue specificity 29. Therefore, to be more biologically relevant, we next used a pancreatic cell line, SU86, and a breast cancer cell line, MDA‐MB‐231 to functionally validate the genes identified during the association studies performed in LCLs. Specifically, we selected 18 candidate genes for siRNA screening followed by TCN cytotoxicity assays (Figs EV1 and EV2). This group included six genes based on SNP‐IC50 association (Table EV1) and 12 genes (Table EV2) that were selected based on gene‐level SNP analysis.
Figure EV1. Functional validation of candidate genes in human tumor cell lines.
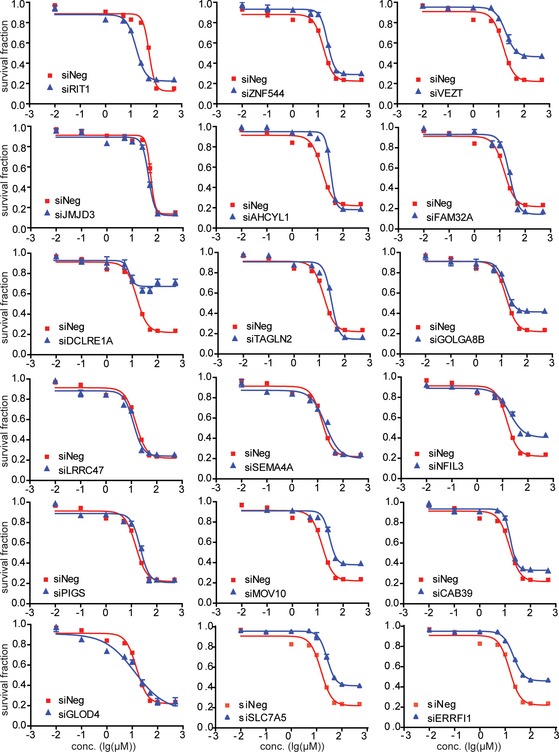
SU86 cells were transfected with specific siRNA and then treated with 0, 0.01, 0.1, 1, 10, 25, 50, 100, and 500 μM TCN for 72 h. Cell survival was determined. The x‐axis indicates drug dose, and the y‐axis indicates the survival fraction after TCN exposure. Each point shows the mean values for three independent experiments; error bars represent ± SEM.
Figure EV2. Functional validation of candidate genes in human tumor cell lines.
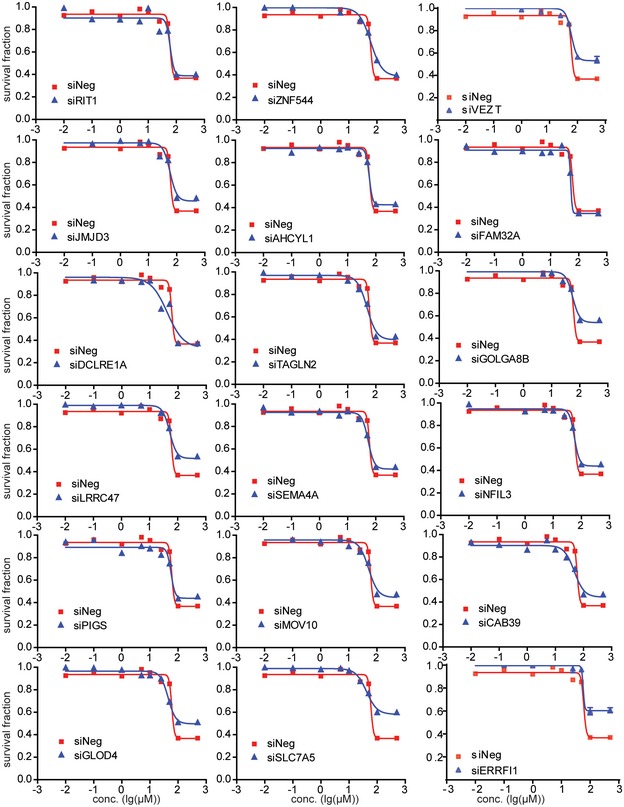
MDA‐MB‐231 cells were transfected with specific siRNA and then treated with 0, 0.01, 0.1, 1, 10, 25, 50, 100, and 500 μM TCN for 72 h. Cell survival was determined. Each point shows the mean values for three independent experiments; error bars represent ± SEM.
Knocking down four of those genes had a significant effect on TCN sensitivity in both cell lines (Table 1). We also used LCL to validate these four genes and found that knocking down of VEZT, GOLGA8B, and SLC7A5 resulted in decreased TCN sensitivity (Fig EV3), consistent with the results from SU86 and MDA‐MB‐231. However, knocking down of ERRFI1 significantly increased TCN sensitivity in LCL (Fig EV3), opposite from the results obtained in two cancer cells, a phenomenon that will be explained later. We then tested the effect of those four genes, VEZT, GOLGA8B, SLC7A5, and ERRFI1, on AKT activation. Knockdown of ERRFI1 resulted in reduced phosphorylation of AKT Ser473 and, to a lesser degree, decreased phosphorylation at Thr308 site. This effect also led to reduced phosphorylation of the AKT downstream substrate, GSK3β and FOXO1 (Fig 2A). As a feedback inhibitor of EGFR, ERRFI1 binds directly to EGFR and inhibits its signaling, including downstream AKT 23. Therefore, our results in both MDA‐MB‐231 and SU86 cells showed an opposite effect on AKT activity from what was expected. We hypothesized that in this case, additional mechanisms might be involved in AKT regulation by ERRFI1.
Table 1.
MTS assay of candidate genes selected for siRNA screening
| Candidate genes selected for siRNA screening with MTS assay results | |||||
|---|---|---|---|---|---|
| ID | Gene symbol | Basis for selectiona | MTS assay (siRNA KD)b | ||
| Integrated analysis (SNP vs. Exp. P < 10−4)(Exp. vs. IC50. P < 10−3) | Gene set analysis | SU86 | BT549 MDA‐MB‐231 | ||
| 1 | RIT1 | – | Yes | – | – |
| 2 | ZNF544 | – | Yes | – | – |
| 3 | VEZT | – | Yes | Yes | Yes |
| 4 | JMJD3 | – | Yes | – | – |
| 5 | AHCYL1 | – | Yes | – | – |
| 6 | FAM32A | – | Yes | – | – |
| 7 | DCLRE1A | Yes | – | Yes | – |
| 8 | TAGLN2 | Yes | – | – | – |
| 9 | GOLGA8B | Yes | – | Yes | Yes |
| 10 | LRRC47 | Yes | – | – | – |
| 11 | SEMA4A | Yes | – | – | – |
| 12 | NFIL3 | Yes | – | Yes | – |
| 13 | PIGS | Yes | – | – | – |
| 14 | MOV10 | Yes | – | – | – |
| 15 | CAB39 | Yes | – | – | – |
| 16 | GLOD4 | Yes | – | – | – |
| 17 | SLC7A5 | Yes | – | Yes | Yes |
| 18 | ERRFI1 | Yes | – | Yes | Yes |
Eighteen genes selected for siRNA screening are listed.
“Yes'' indicates individual candidate genes with the P‐value listed.
“Yes'' indicates that knockdown of the gene altered TCN cytotoxicity (IC50 values) when compared with control siRNA. “–'' indicates that knockdown of the gene did not alter TCN cytotoxicity (IC50 values) when compared with control siRNA.
Figure EV3. Functional validation of candidate genes in LCL.
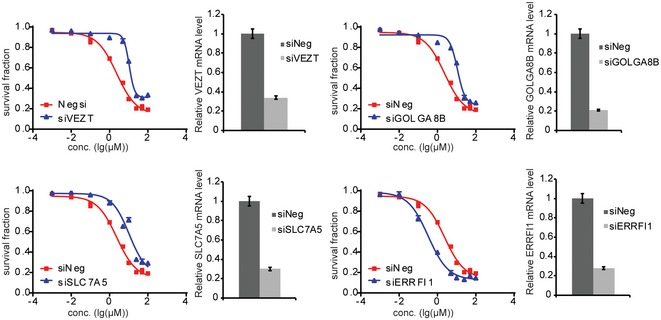
LCL were transfected with specific siRNA and then treated with 0, 0.01, 0.1, 1, 10, 25, 50, 100, and 500 μM TCN for 72 h. Cell survival was determined using CYQUANT assay. Knockdown efficiency was determined using qRT–PCR. Each point shows the mean values for three independent experiments; error bars represent ± SEM.
Figure 2. ERRFI1 differentially regulates AKT phosphorylation in EGFR‐high and EGFR‐low cells.
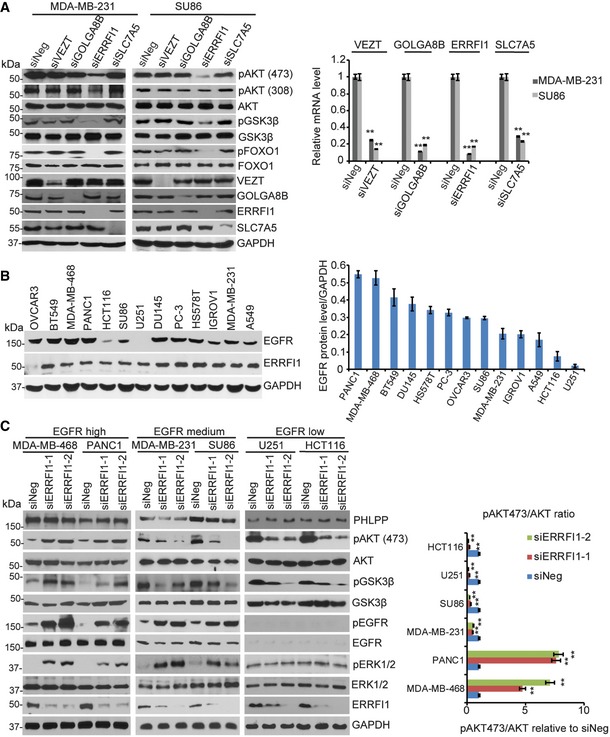
- MDA‐MB‐231 and SU86 cells were transfected with negative siRNA (siNeg) or indicated siRNA. Cell lysates were then blotted with the indicated antibodies. The mRNAs were extracted from the rest of the cells and subjected to qRT–PCR to determine knockdown efficiency. Error bars represent the SEM of three independent experiments. **P < 0.01. Statistical analyses were performed with Student's t‐test.
- Cell lysates from 13 human cancer cell lines were blotted with anti‐EGFR antibody. Quantification of EGFR protein relative to the GAPDH was determined. Error bars represent the SEM of three independent experiments.
- MDA‐MB‐468, PANC1, MDA‐MB‐231, SU86, U251, and HCT116 cells were transfected with two ERRFI1 siRNAs; 48 h later, cell lysates were subjected to Western blot. The ratio of phospho‐AKT473 /total AKT signal (pAKT473/AKT) was quantified using ImageJ. pAKT473/AKT in siNeg is set to 1 within each cell line. Error bars represent ± SEM of three independent experiments. The significant difference between siNeg and siERRFI1 is indicated by: **P < 0.01. Statistical analyses were performed with Student's t‐test.
Source data are available online for this figure.
ERRFI1 regulates AKT activation through interacting with the AKT and PHLPP complex
Since ERRFI1 is a known negative regulator of EGFR, to further study the relationship between EGFR and the AKT pathway, we screened 13 human cancer cell lines available in the laboratory to determine EGFR levels (Dataset EV2). As shown in Fig 2B, MDA‐MB‐231 and SU86 cells express moderate EGFR protein level. We then chose cells representing two extreme ends of EGFR levels including the PANC1 and MDA‐MB‐468, two cells expressing high EGFR, and the U251 and HCT116, two cells with very low EGFR level based on the Western blot in addition to the MDA‐MB‐231 and SU86, to determine the effects of ERRFI1 on EGFR and AKT signaling. As shown in Fig 2C, in the two cells expressing high EGFR level, downregulation of ERRFI1 using two different ERRFI1‐specific short interfering RNAs (siRNAs) significantly increased EGFR phosphorylation, and downstream pERK and pAKT (Ser473), consistent with the known function of ERRFI1 reported by previous studies 30. On the contrary, in EGFR‐low cell lines, similar to that observed in the MDA‐MB231 and SU86 cells that have intermedium EGFR levels, downregulation of ERRFI1 reduced AKT phosphorylation at Ser473 (Fig 2C), Since downregulation of ERRFI1 had similar effect on AKT activity in both EGFR‐medium and EGFR‐low cells, we mainly focused on the cells with high EGFR, PANC1, and MDA‐MB‐468, and U251 and HCT116, two cells with very low EGFR for all of the following studies.
To test whether ERRFI1 could directly regulate AKT phosphorylation at Ser473 and/or Thr308, we determined its interactions with kinases and phosphatases that regulate the Ser473 and Thr308 sites 5. The AKT Ser473 is phosphorylated by mTORC2 and dephosphorylated by PHLPP 6, 31, 32, and the Thr308 is phosphorylated by PDK1 and dephosphorylated by PP2A. However, we could not detect any interactions between ERRFI1 and mTOR, PDK1, or PP2A using co‐immunoprecipitation (IP), even though we observed change in Thr308 phosphorylation (Fig EV4A). Furthermore, depletion of ERRFI1 did not change the AKT‐PDK1 interaction or AKT‐PP2A interaction (Fig EV4B). Instead, we found that PHLPP and AKT were co‐immunoprecipitated with ERRFI1 (Fig 3A). Moreover, we observed more ERRFI‐EGFR interaction and less ERRFI1‐AKT interaction in EGFR‐high cells (Fig 3A), while ERRFI1 mainly bound to AKT in EGFR‐low cells (Fig 3A). Furthermore, in EGFR‐high cells, epidermal growth factor (EGF) treatment resulted in a significant increase in the ERRFI1‐EGFR interaction, and decrease in ERRFI1‐AKT interaction (Fig EV5A), while in EGFR‐low cells, ERRFI1 constantly bound to AKT regardless of EGF treatment (Fig EV5A). Furthermore, using purified His‐ERRFI1 and GST‐AKT, we showed a direct interaction between the two (Fig 3B). These results suggest that ERRFI1, AKT, and PHLPP might coexist in a complex in cells, indicating a novel mechanism of ERRFI1 in regulating AKT in EGFR‐low cancer cells.
Figure EV4. ERRFI1 does not directly regulate the phosphorylation of AKT at Thr308.
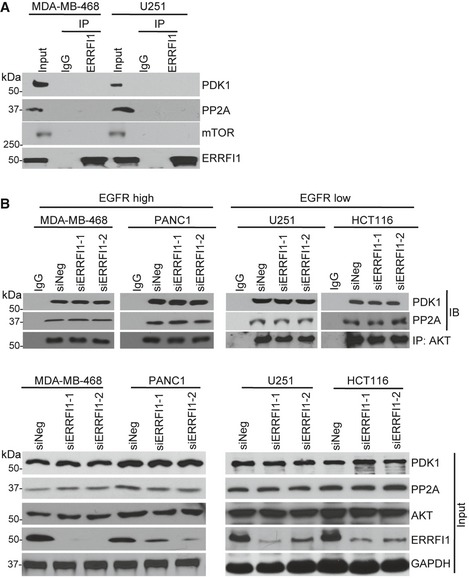
- MDA‐MB‐468 and U251 cell lysates were subjected to immunoprecipitation with control IgG or anti‐ERRFI1 antibody. The immunoprecipitates were blotted with the indicated antibodies.
- MDA‐MB‐468, PANC1, U251, and HCT116 cells were transfected with siERRFI1. Cell lysates were subjected to immunoprecipitation with control IgG or anti‐AKT antibody. The immunoprecipitates were blotted with the indicated antibodies.
Source data are available online for this figure.
Figure 3. ERRFI1 regulates AKT‐PHLPP interaction.
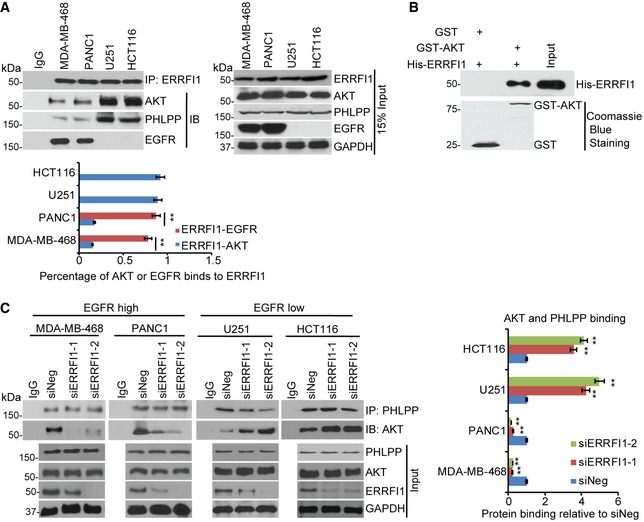
- MDA‐MB‐468, PANC1, U251, and HCT116 cell lysates were subjected to immunoprecipitation with control IgG or anti‐ERRFI1 antibody. The immunoprecipitates were then blotted with the indicated antibodies. Quantifications of the Western blots were analyzed by ImageJ. To quantify each interaction, the amount of AKT or EGFR was first normalized back to the input level for each protein and then corrected by the amount of IPed protein, ERRFI1. Error bars represent ± SEM of three independent experiments. The significant difference between ERRFI1‐EGFR binding and ERRFI1‐AKT binding is indicated by: **P < 0.01. Statistical analyses were performed with Student's t‐test.
- Purified recombinant GST, GST‐AKT, and His‐ERRFI1 were incubated in cell‐free conditions. The interaction between AKT and ERRFI1 was then examined.
- MDA‐MB‐468, PANC1, U251, and HCT116 cell lysates were subjected to immunoprecipitation with control IgG or anti‐PHLPP antibody. The immunoprecipitates were blotted with the indicated antibodies. The interaction was then quantified in each cell line. The amount of AKT corrected by IPed PHLPP was calculated in each of the four cancer cells transfected with siNeg or siERRFI1s. The results were then corrected by the siNeg. The interaction in siNeg is set to 1 within each cell line. Error bars represent ± SEM of three independent experiments. The significant difference between siNeg and siERRFI1 is indicated by: **P < 0.01. Statistical analyses were performed with Student's t‐test.
Source data are available online for this figure.
Figure EV5. ERRFI1 regulates AKT‐PHLPP interaction.
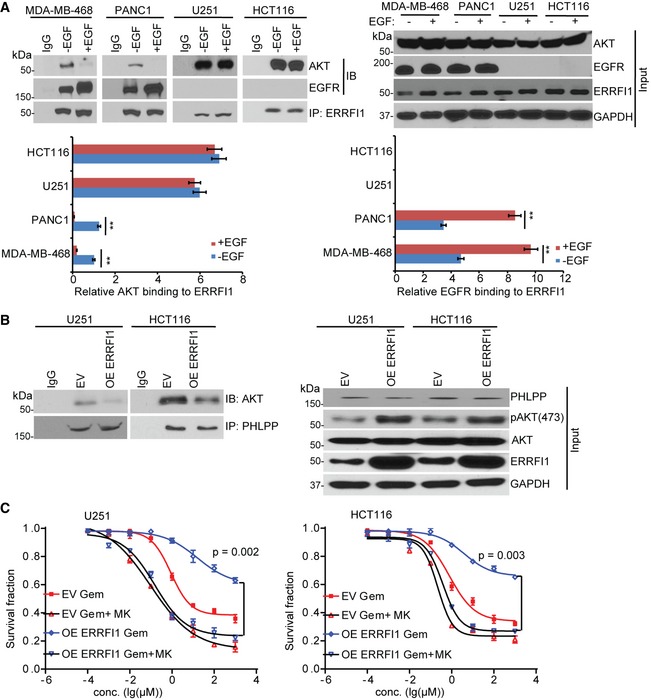
- MDA‐MB‐468, PANC1, U251, and HCT116 cells were serum‐starved for 36 h and then treated with EGF (100 ng/ml) for 30 min prior to cell lysis. Cells lysates were subjected to immunoprecipitation with control IgG or anti‐ERRFI1 antibody. The immunoprecipitates were blotted with the indicated antibodies. The ERRFI1‐AKT and ERRFI1‐EGFR interaction was quantified using ImageJ. The immunoprecipitated ERRFI1 levels were normalized for each interaction and then corrected for MDA‐MB‐468 no EGF treatment. The interaction in no EGF‐treated (‐EGF) MDA‐MB‐468 is set to 1. Error bars represent ± SEM of three independent experiments. The significant difference between vehicle and EGF treatment is indicated by: **P < 0.01. Statistical analyses were performed with Student's t‐test.
- U251 and HCT116 cells were transfected with ERRFI1 construct. After 48 h, cells were lysed and subjected to immunoprecipitation with control IgG or anti‐PHLPP antibody. The immunoprecipitates were then blotted with the indicated antibodies.
- U251 and HCT116 cells from (B) were treated with increasing dose of gemcitabine (Gem) alone or in combination with 10 μM MK‐2206 2HCl (MK) for 72 h. Cell survival was then determined. Each point shows the mean values for three independent experiments; error bars represent ± SEM.
Source data are available online for this figure.
Our finding that ERRFI1 interacted with PHLPP and AKT especially in EGFR‐low cancer cells led us to hypothesize that ERRFI1 could regulate the interaction between AKT and PHLPP, thereby regulating AKT phosphorylation 33. As shown in Fig 3C, ERRFI1 depletion increased PHLPP‐AKT interactions in EGFR‐low cell lines. The change in interaction translated to the reduction in AKT phosphorylation (Fig 2C). This also explained the results observed in LCLs that knockdown of siERRFI1 led to sensitization to TCN, because LCLs express low level of EGFR based on gene expression array data (Fig EV3 and Dataset EV3). However, ERRFI1 depletion decreased PHLPP‐AKT interactions in EGFR‐high cell lines (Fig 3C). This might be due to the fact that ERRFI1 depletion increases EGFR activity, and downstream PI3K‐AKT activity 34, 35 and activated AKT creates a cage in the ATP‐bound form to prevent its access to phosphatases 36.
Identification of specific binding domains in ERRFI1 that interact with AKT
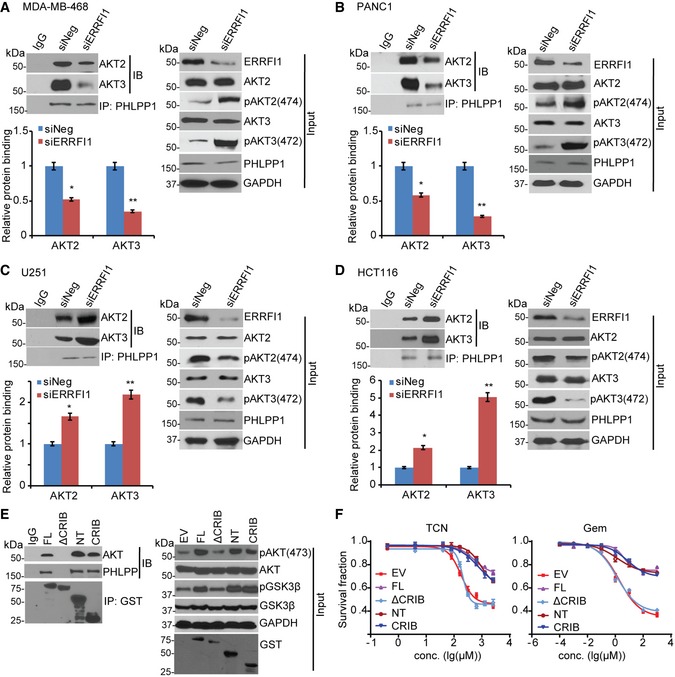
AKT has three isoforms (AKT1, AKT2, and AKT3) 37. The antibodies that we used in the previous experiments recognized all three isoforms. In addition, PHLPP has two isoforms (PHLPP1 and PHLPP2) 6, 31. Previous studies have established that PHLPP1 and PHLPP2 inhibit AKT signaling differently by interacting with distinct AKT isoforms. PHLPP1 specially regulates AKT2 and AKT3, and PHLPP2 regulates AKT1 and AKT3 31. We found that ERRFI1 mainly co‐IPed with AKT2 and AKT3 within the same complex with PHLPP1 (Fig 4A). After taking into account of different endogenous levels of the three AKT isoforms in these cell lines (Fig 4B), quantitative analysis suggested that ERRFI1 mainly bound to AKT2 and AKT3 (Fig 4C). Reciprocal immunoprecipitation with ERRFI1 antibody also brought down more AKT2 and AKT3 compared with AKT1 (Fig 4D). We next confirmed the ERRFI1 effect on these isoform‐specific interactions. Downregulation of ERRFI1 decreased interactions between PHLPP1 and AKT2 or AKT3, especially interactions between PHLPP1 and AKT3 in EGFR‐high cells (Fig 5A and B). However, downregulation of ERRFI1 increased interactions between PHLPP1 and AKT2 or AKT3, especially interactions between PHLPP1 and AKT3 in EGFR‐low cells (Fig 5C and D).
Figure 4. Binding of ERRFI1 to AKT2 and AKT3.
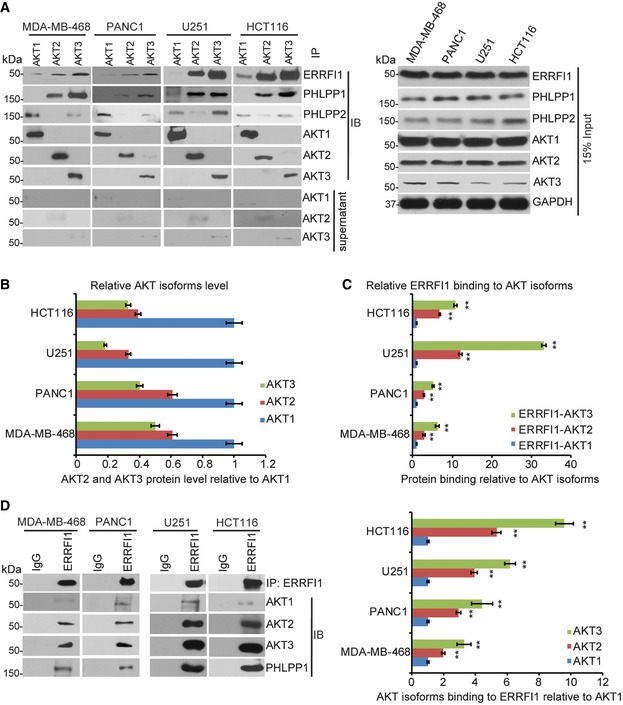
- MDA‐MB‐468, PANC1, U251, and HCT116 cells lysates were subjected to immunoprecipitation with control IgG, anti‐AKT1, anti‐AKT2, or anti‐AKT3 antibody. The immunoprecipitates were blotted with the indicated antibodies. The supernatant of the precipitation were blotted with AKT1, AKT2, and AKT3 antibodies to ensure that the majority of the AKT isoform was precipitated with specific antibody.
- Quantification analysis of all three AKT isoforms. In the input sample, each AKT isoform was normalized to GAPDH, and then the normalized levels of AKT2 and AKT3 relative to AKT1 were determined within each cell line. Error bars represent ± SEM of three independent experiments.
- Quantifications of the interaction between ERRFI1 and three AKT isoforms using ImageJ. Antibodies against three AKT isoforms was used to pull down ERRFI1. The ERRFI1‐AKT isoform interactions were determined in a similar fashion as Fig 3C. Error bars represent ± SEM of three independent experiments. The significant difference between AKT2/or AKT3‐ERRFI1 and AKT1‐ERRFI1 interaction is indicated by: **P < 0.01. Statistical analyses were performed with Student's t‐test.
- Cells lysates from (A) were subjected to immunoprecipitation with control IgG or anti‐ERRFI1 antibody. The immunoprecipitates were blotted with the indicated antibodies. The interactions were quantified in a similar fashion as in (C). Error bars represent ± SEM of three independent experiments. The significant difference between AKT2/or AKT3‐ERRFI1 and AKT1‐ERRFI1 interaction is indicated by: **P < 0.01. Statistical analyses were performed with Student's t‐test.
Source data are available online for this figure.
Figure 5. ERRFI1 regulating AKT2/3‐PHLPP interaction depends on EGFR level.
-
A–DMDA‐MB‐468 (A), PANC1 (B), U251 (C), and HCT116 (D) were transfected with siNeg or siERRFI1. Cell lysates were subjected to immunoprecipitation with control IgG or anti‐PHLPP1 antibody. The immunoprecipitates were blotted with the indicated antibodies. AKT‐PHLPP interaction was quantified as described before. Error bars represent ± SEM of three independent experiments. The significant difference between siNeg and siERRFI1 is indicated by: *P < 0.05, **P < 0.01. Statistical analyses were performed with Student's t‐test.
-
EU251 cells were transfected with GST‐tagged full‐length ERRFI1 (FL) or ERRFI1 truncation constructs; 48 h later, half of the cells were harvested and lysates were subjected to immunoprecipitation with control IgG or anti‐GST antibody. The immunoprecipitates were then blotted with the indicated antibodies.
-
FThe rest of the U251 cells from (E) were treated with increasing doses of TCN or gemcitabine for 3 days. Survival fraction was determined by CYQUANT assay. The x‐axis indicates drug dose, and the y‐axis indicates the survival fraction after drug exposure. Overexpression efficiency is shown in (E, input). Error bars represent ± SEM of three independent experiments.
Source data are available online for this figure.
To investigate how ERRFI1 regulates the AKT‐PHLPP interaction, we used a series of ERRFI1 deletion constructs and found that deletion of the CRIB domain abolished the interactions between ERRFI1 and AKT as well as PHLPP in EGFR‐low cells (Fig 5E), suggesting that the CRIB domain was required for this interaction. The interaction through the CRIB domain was sufficient for the regulation of AKT phosphorylation (Fig 5E, input). Indeed, in EGFR‐low cell, overexpression of the CRIB domain deletion construct (ΔCRIB), compared with the full‐length (FL) construct, failed to increase AKT phosphorylation (Fig 5E, input). Therefore, cells were more sensitive to TCN and gemcitabine responses compared with cells overexpressing full‐length protein (Fig 5F, P < 0.05).
EGFR level affects ERRFI1 binding to AKT
It has been shown previously that ERRFI1 interacts with and inhibits EGFR, which in turn, inhibits EGFR downstream signaling, including AKT activation 23. We showed that ERRFI1 also directly bound to AKT, resulting in activation of AKT (Figs 2 and 3). We next asked how these two opposite effects on AKT activation might be regulated. We hypothesized that EGFR levels determines the binding of ERRFI1 to AKT. If this is correct, we would expect that downregulation of EGFR in EGFR‐high cells to mimic EGFR‐low system would increase the interaction between ERRFI1 and AKT. Our results in EGFR‐high cells confirmed this hypothesis. Knockdown of EGFR resulted in an increased association of ERRFI1 with AKT (Fig 6). Furthermore, overexpressing EGFR in two EGFR‐low cell lines to mimic EGFR‐high system resulted in a decrease in ERRFI1‐AKT interaction (Fig 6).
Figure 6. EGFR level affects AKT‐ERRFI1 interaction.
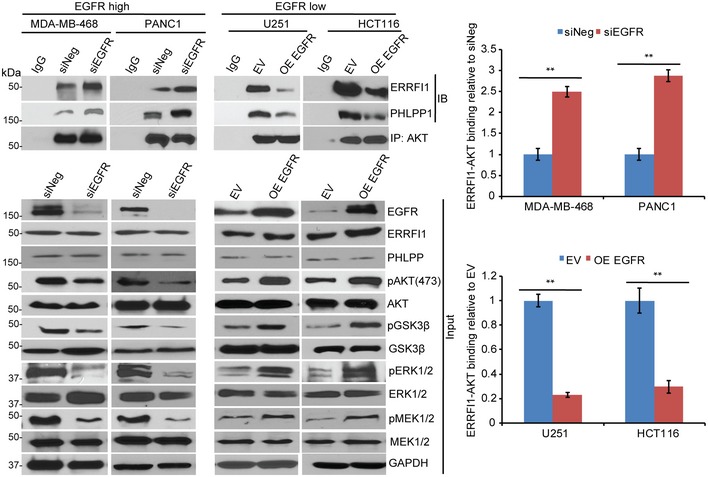
- MDA‐MB‐468 and PANC1 cells were transfected with siEGFR, and U251 and HCT116 cells were transfected with empty vector (EV) or EGFR construct; 48 h later, cell lysates were subjected to immunoprecipitation with control IgG, or anti‐AKT antibody. The immunoprecipitates were blotted with the indicated antibodies. Quantification of the binding was calculated. The interaction in cells transfected with siNeg or EV was set to 1 within each cell line. Error bars represent ± SEM of three independent experiments. The significant difference between siNeg and siEGFR, or EV and OE EGFR is indicated by: **P < 0.01. Statistical analyses were performed with Student's t‐test.
Source data are available online for this figure.
The effect of ERRFI1 on AKT and cell proliferation is dependent on basal EGFR level
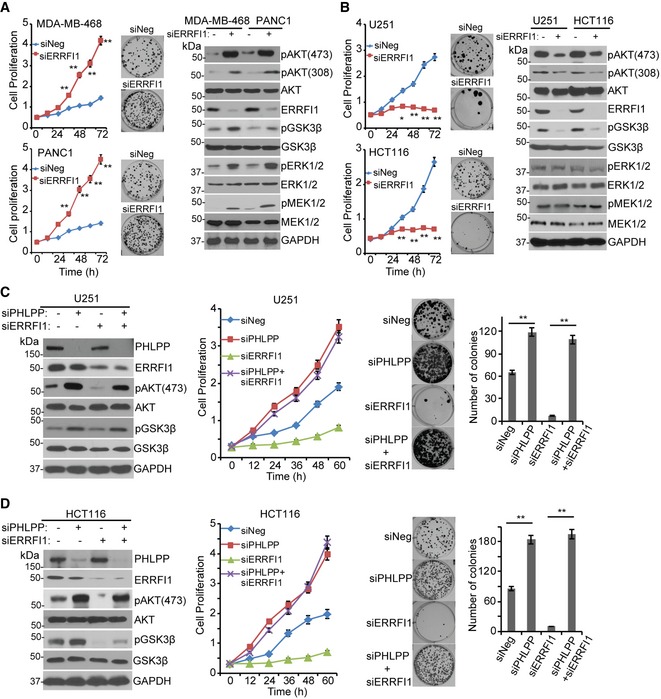
Having observed that levels of EGFR could affect ERRFI1's ability to regulate AKT activity, we next examined how this regulation might influence cell proliferation. We hypothesized that in cells with high EGFR expression, downregulation of ERRFI1 would enhance EGFR signaling and thus increase AKT activity while, on the other hand, in EGFR‐low cells, ERRFI1 would interact with AKT and decrease AKT activity. The strength of these two opposing signals would determine the ultimate cellular phenotypes. Knockdown of ERRFI1 in EGFR‐high cell lines resulted in significant activation of EGFR signaling, while decreased AKT signaling in EGFR‐low cell lines (Figs 2 and 3). One outcome of increased EGFR signaling is increased cell proliferation and colony formation, which was true in MDA‐MB‐468 and PANC1 cells (Fig 7A, left panel). This effect was due to the inhibitory effect of ERRFI1 on EGFR, which was confirmed by increased EGFR downstream MEK‐ERK signaling (Fig 7A, right panel). On the contrary, knockdown of ERRFI1 in EGFR‐low U251 and HCT116 cells resulted in decreased cell proliferation and colony formation (Fig 7B, left panel), and this was due to the fact that ERRFI1 positively regulated AKT signaling by directly blocking PHLPP access to AKT in cell lines with low levels of EGFR (Fig 3C), resulting in inactivation of AKT (Fig 7B, right panel). To further confirm that ERRFI1 regulates AKT Ser473 through the regulation of the access of PHLPP to AKT, especially in cell lines lacking EGFR, we knocked down ERRFI1 while at the same time downregulating PHLPP in the two EGFR‐low cell lines. Similar to what we demonstrated earlier, knockdown of ERRFI1 alone decreased pAKT Ser473 (Fig 7C and D, left panel) and inhibited cell proliferation and colony formation (Fig 7C and D, middle and right panel, P < 0.01). However, further depleting PHLPP significantly increased pAKT Ser473 (Fig 7C and D, left panel), cell proliferation, and colony formation (Fig 7C and D, middle and right panel, P < 0.01). These results provide additional evidence supporting the conclusion that ERRFI1 regulates AKT Ser473 through AKT‐PHLPP, and further emphasize that the balance between EGFR and AKT signaling regulated by ERRFI1 is dependent on cellular EGFR level.
Figure 7. The effect of ERRFI1 on AKT activation and cell proliferation depends on the basal EGFR level.
-
A, BKnockdown of ERRFI1 increased proliferation and colony formation in MDA‐MB‐468 and PANC1, two EGFR‐high cells (A). Knockdown of ERRFI1 decreased proliferation and colony formation in U251 and HCT116 EGFR‐low cells (B). Cell proliferation was monitored every 12 h. The x‐axis indicates time post‐treatment, and the y‐axis indicates cell proliferation rate. The representative colony formation pictures from triplicate experiments are shown. Error bars represent ± SEM of three independent experiments; *P < 0.05, **P < 0.01 compared to siNeg. Statistical analyses were performed with Student's t‐test. Remaining cells were blotted with the indicated antibodies.
-
C, DU251 and HCT116 cells were transfected with indicated siRNA. Cell lysates were blotted with the indicated antibodies. Cell proliferation and colony formation were assessed. Quantification of colony formation is shown. Error bars represent ± SEM of three independent experiments. **P < 0.01. Statistical analyses were performed with Student's t‐test.
Source data are available online for this figure.
The effect of ERRFI1 on response to therapy is dependent on basal EGFR level
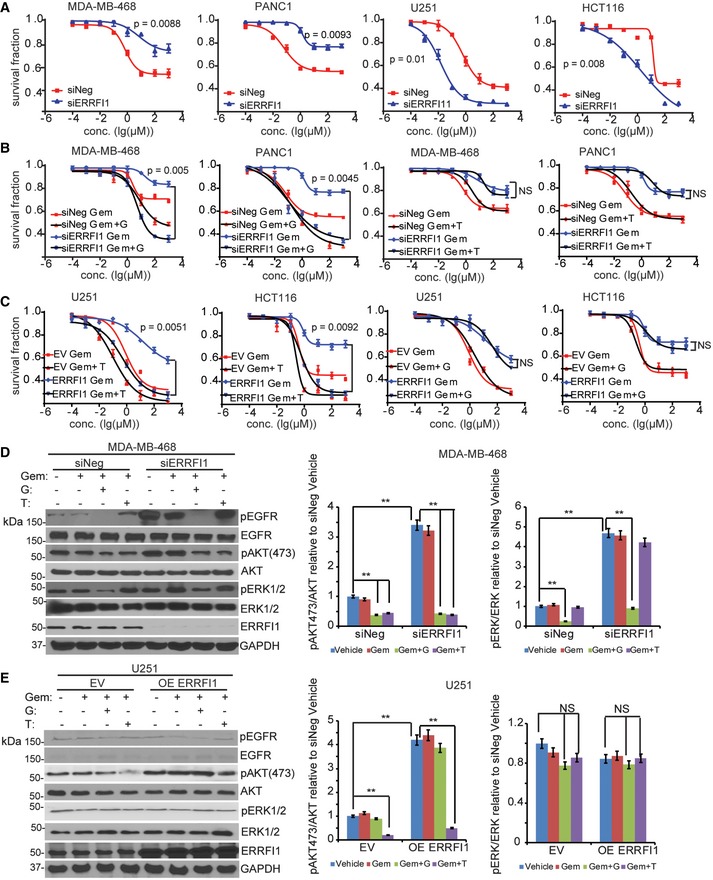
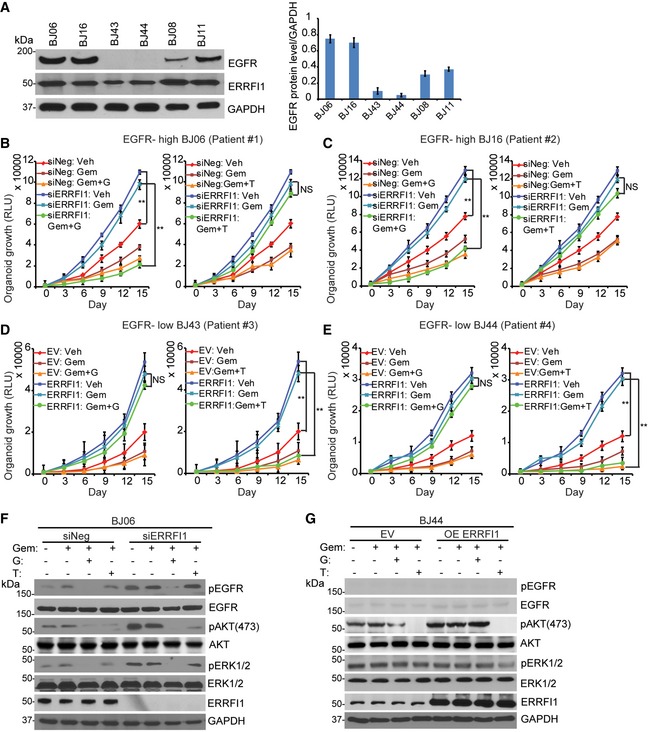
To examine how the dual role of ERRFI1 on AKT and EGFR signaling might affect response to chemotherapy, we used gemcitabine as an example to treat cell lines with different EGFR levels. Gemcitabine is first‐line treatment for pancreatic cancer and is also used to treat breast cancer. Downregulation of ERRFI1 resulted in increased resistance to gemcitabine in EGFR‐high cells (Fig 8A, left panel, P < 0.01). As expected, this was due to the upregulation of EGFR signaling in ERRFI1 knockdown cells relative to siNeg control (Fig 7A, right panel). On the contrary, downregulation of ERRFI1 resulted in sensitization to gemcitabine in EGFR‐low cells (Fig 8A, right panel, P < 0.01). This can be explained by the downregulation of AKT signaling in ERRFI1 knockdown cells relative to siNeg control (Fig 7B, right panel). Based on the evidence that ERRFI1 mainly inhibits EGFR in EGFR‐high cells (Figs 2C and 7A), but activates AKT directly in EGFR‐low cells (Figs 2C and 7B), we hypothesize that EGFR inhibitor and AKT inhibitor will have differential sensitization effects depending on the EGFR level. We tested whether the addition of the EGFR inhibitor, gefitinib, could overcome gemcitabine resistance due to downregulation of ERRFI1 in EGFR‐high cells. As expected, we observed that the addition of 10 μM gefitinib significantly sensitized the two EGFR‐high cell lines to gemcitabine (Fig 8B, left panel, P < 0.01). However, addition of the AKT inhibitor, TCN, had no effect on gemcitabine sensitivity (Fig 8B, right panel). On the contrary, in cell lines with low EGFR, overexpressing ERRFI1 rendered resistance to gemcitabine treatment (Fig 8C) through decreased interaction between AKT and PHLPP and increased phosphorylation of AKT (Fig EV5B). Furthermore, addition of TCN significantly reversed the resistance phenotype caused by ERRFI1 overexpression in the EGFR‐low cells (Fig 8C, left panel, P < 0.01), while addition of gefitinib had no effect on gemcitabine sensitivity (Fig 8C, right panel). We observed similar sensitization effects of a second AKT inhibitor, MK‐2206 2HCl, on gemcitabine response (Fig EV5C). Finally, we choose MDA‐MB‐468 and U251 to represent EGFR‐high and EGFR‐low cells to determine the effect of ERRFI1 and drugs on EGFR and AKT activity. Depletion of ERRFI1 significantly increased the phosphorylation of AKT at serine 473 in MDA‐MB‐468 cells compared with negative siRNA control (Fig 8D). Compared with vehicle or gemcitabine alone, treatment of gemcitabine plus gefitinib dramatically reduced the phosphorylation of EGFR, ERK, and AKT in MDA‐MB‐468 cells transfected with control or ERRFI1 siRNAs (Fig 8D). Addition of TCN only reduced pAKT but not pEGFR and pERK levels (Fig 8D). In EGFR‐low U251 cells treated with vehicle, overexpression of ERRFI1 resulted in an increased pAKT (Fig 8E). Due to low level of EGFR, compared with vehicle treatment, combination treatment of gemcitabine and gefitinib did not alter AKT phosphorylation in U251 cells transfected with control or ERRFI1 siRNAs (Fig 8E). However, addition of TCN dramatically reduced pAKT, but not pERK level in the same cell line (Fig 8E). To investigate the role of ERRFI1 on AKT signaling in patients' relevant model, we grew organoids from primary breast cancer patients' derived xenograft (PDX) tumors 38. Based on the availability of the PDXs, we screened six organoids from PDX tumors established from six patients to determine the levels of EGFR. We then chose two organoids expressing high EGFR (BJ06 and BJ16) and two organoids with very low EGFR levels (BJ43 and BJ44) based on the Western blot (Fig 9A), to determine the effects of ERRFI1 on 3D organoid growth. EGFR‐high organoids transfected with ERRFI1 siRNA showed increased growth compared to siNeg control (Fig 9B and C, vehicle treatment). On the contrary, upregulation of ERRFI1 resulted in increased growth in EGFR‐low cells (Fig 9D and E, vehicle treatment). Organoids from each group were treated with either gemcitabine alone or in combination with gefitinib or TCN. In EGFR‐high organoids transfected with siERRFI1, organoid growth at days 9, 12 and 15 was statistically significantly slower in gemcitabine plus gefitinib‐treated arm than gemcitabine alone (Fig 9B and C, P < 0.01). However, addition of the TCN had no effect on gemcitabine sensitivity (Fig 9B and C). In EGFR‐low organoids, the addition of TCN, but not gefitinib, significantly reversed the resistance phenotype caused by ERRFI1 overexpression (Fig 9D and E, P < 0.01). We examined pAKT and pEGFR levels in organoids obtained from the growth experiments. Consistent with cell line data (Fig 8D and E), in EGFR‐high organoids, ERRFI1 mainly regulated EGFR activity (Fig 9F), while in EGFR‐low organoids, ERRFI1 directly regulated AKT phosphorylation (Fig 9G). Overall, these results indicate an important role for ERRFI1 in regulating cellular response to gemcitabine in an EGFR level‐dependent manner, providing insight into the dual roles of ERRFI1 in regulation of the EGFR and AKT pathway.
Figure 8. The effect of ERRFI1 on response to therapy and AKT activation is cell context dependent.
-
AMDA‐MB‐468, PANC1, U251, and HCT116 cells transfected with siERRFI1 were treated with increasing doses of gemcitabine for 72 h, and cell survival was then determined. The x‐axis indicates drug dose, and the y‐axis indicates the survival fraction after gemcitabine exposure. Knockdown efficiency is shown in (D). Error bars represent the SEM of three independent experiments. Statistical analyses were performed with Student's t‐test.
-
BMDA‐MB‐468 and PANC1 cells transfected with siERRFI1 were treated with increasing doses of gemcitabine (Gem) alone or in combination with either 10 μM gefitinib (G) or 10 μM TCN (T) for 72 h. Cell survival was then determined. Knockdown efficiency is shown in (D). Error bars represent the SEM of three independent experiments. Statistical analyses were performed with Student's t‐test.
-
CU251 and HCT116 transfected with ERRFI1 plasmid were treated with Gem alone or in combination with either 10 μM T or 10 μM G for 72 h. Cell survival was then determined. Overexpression efficiency is shown in (E). Error bars represent the SEM of three independent experiments. Statistical analyses were performed with Student's t‐test.
-
D, EMDA‐MB‐468 and U251 cells from (B and C) were treated with vehicle or 20 nM of Gem alone or in combination with either 10 μM of G or 10 μM of T for 12 h. Cells lysates were blotted with the indicated antibodies. The pAKT473/AKT ratio and pERK473/ERK ratio were quantified. The ratio in siNeg or EV is set to 1 within each cell line. Data represent the SEM of three independent experiments. **P < 0.01. Statistical analyses were performed with Student's t‐test.
Source data are available online for this figure.
Figure 9. ERRFI1 regulates organoid growth, therapy response and AKT activation depending on EGFR level.
-
AOrganoid lysates from six human breast cancer PDX tumors were blotted with EGFR antibody. Quantification of EGFR protein relative to the GAPDH was determined. Error bars represent the SEM of three independent experiments.
-
B, CEGFR‐high BJ06 and BJ16 organoids transfected with siERRFI1 were treated with vehicle (Veh) or 50 nM of gemcitabine (Gem) alone or in combination with either 10 μM gefitinib (G) or 10 μM TCN (T). Organoid growth was monitored every 3 days. Knockdown efficiency is shown in (F). Error bars represent the SEM of three independent experiments. **P < 0.01. Statistical analyses were performed with Student's t‐test.
-
D, EEGFR‐low BJ43 and BJ44 organoids transfected with ERRFI1 plasmid were treated as above. Organoid growth was monitored every 3 days. Overexpression efficiency is shown in (G). Error bars represent the SEM of three independent experiments. **P < 0.01. Statistical analyses were performed with Student's t‐test.
-
F, GBJ06 and BJ44 organoids were treated with vehicle or 50 nM of Gem alone or in combination with either 10 μM of G or 10 μM of T for 72 h. Organoid lysates were blotted with the indicated antibodies.
Source data are available online for this figure.
Discussion
We have identified ERRFI1 as an important determinant of cancer cell response to AKT inhibitors and chemotherapeutic agents such as gemcitabine. ERRFI1 was originally identified as a feedback inhibitor of EGFR 39, 40. EGFR is highly expressed in a range of solid tumors 41. On average, 50–70% of lung, colon, and breast carcinomas have been found to express EGFR 42, while only 15% of invasive breast cancers express EGFR 43, suggesting that significant percentage (about 30–50%) of cancers express very low level of EGFR. The level of EGFR expression in tumors will certainly affect EGFR activation. The prognostic significance of EGFR has been investigated in numerous studies; however, no clear association between EGFR levels and response to EGFR‐targeted agents or chemotherapeutic agents has been described 44, 45. A common mechanism of resistance to chemotherapy involves the direct activation of mediators in the RAS/RAF/MEK or PI3K/AKT pathway, resulting in cancer cells escaping from growth inhibition by using alternative growth pathways 46. It has been shown that the AKT pathway is regulated at multiple levels both in positive and negative ways 33, 47. Dysregulation of the AKT pathway has been linked to resistance to a variety of chemotherapeutics such as gemcitabine and taxane 48.
In this study, we have identified ERRFI1 as a novel AKT binding partner, modulating its activation especially in cancer cells expressing very low level of EGFR (Figs 2 and 3). At the mechanistic level, we found that the CRIB (residues 1–38) domain was important to regulate the interaction between ERRFI1 and AKT and this interaction was sufficient to regulate AKT phosphorylation (Fig 5E and F). Interestingly, this domain also seemed to be essential for the interaction with PHLPP based on the IP results (Fig 5E and F), which might be due to the fact that PHLPP is in the protein complex with AKT. However, we failed to obtain PHLPP recombinant protein to determine if ERRFI1 directly interacts with PHLPP. The structure relationships among these three proteins need to be further investigated. Although ERRFI1 is known to be an important tumor suppressor through negative regulation of EGFR signaling, we found that ERRFI1 has a novel dual function in the regulation of AKT and EGFR signaling. ERRFI1 differentially affected cell proliferation and chemotherapeutic response depending on the EGFR level in cancer cells using both cancer cell lines and organoids derived from breast cancer patient xenograft tumors (Figs 7, 8, 9). In EGFR‐high cancer cells, ERRFI1 functions as a negative regulator of EGFR signaling, a well‐known mechanism 23, resulting in reduced cell proliferation and sensitivity to gemcitabine (Figs 7A, 8A and 9B and C), while in EGFR‐low cancer cells, ERRFI1 mainly interacts with AKT as a positive regulator of AKT Ser473 by regulating the interaction between AKT and PHLPP, resulting in increased cell proliferation and resistance to gemcitabine (Figs 7B, 8 and 9D and E). We also observed change in AKT phosphorylation at Thr308, which might be a secondary effect related to the change in Ser473 phosphorylation (Fig EV4) 49. Although ERRFI1 binds to both EGFR and AKT, ERRFI1 mainly bound to EGFR upon EGF activation in EGFR‐high cells as a tumor suppressor (Figs 3A and EV5A). While in EGFR‐low cancer cells, ERRFI1 constantly bound to and activated AKT directly, regardless of EGF stimulus (Figs 3A and EV5A), suggesting that ERRFI1 had almost no direct inhibitory effect on EGFR activity in EGFR‐low cancer cells. Therefore, cellular EGFR level is an important determinant of ERRFI1 function. The strength of the two pathways determines the cellular phenotypes. With the two EGFR intermedium cell lines, MDA‐MB‐231 and SU86, downregulation of ERRFI1 increased AKT‐PHLPP interaction and decreased AKT activity. However, at the same time, EGFR pathway is also activated by removing the inhibitory effector, ERRFI1 (Fig 2C), which resulted in decreased sensitivity to treatment (Figs EV1 and EV2). Therefore, future studies need to investigate the dynamic regulation of EGFR/AKT by ERRFI1 depending on EGFR levels. ERRFI1 bound to AKT through N‐terminal CRIB domain (Fig 5E) while the binding to EGFR is known to be through the C terminal domain 23. Future structural characterizations are required for fully understanding the interplay of the relationship. At mechanistic level, how ERRFI1 preferentially regulates AKT vs. EGFR needs additional studies. Overexpression of ERRFI1 did not increase its binding to EGFR in EGFR‐low cells. Therefore, the regulation might be dependent on ERRFI1 post‐translational modifications or specific protein–protein interactions occurred in EGFR‐low or EGFR‐high cells. This dual regulation also affects the selection of therapies to help overcome chemoresistance (Figs 8 and 9). In EGFR‐high cancer cell, EGFR inhibitor sensitized ERRFI1‐depleted cells to gemcitabine (Figs 8B and 9B and C), while in EGFR‐low cells, AKT inhibitor sensitized ERRFI1‐overexpressed cells to gemcitabine treatment (Figs 8C and 9D and E). Hyperphosphorylation of AKT has also been linked to poor prognosis in a variety of cancers 48. Based on our studies, in EGFR‐low tumors, we would expect that higher expression of ERRFI1 might be associated with poor prognosis, which could be tested in the future using clinical patients' samples.
We understand that the cell lines which we used all had different genetic backgrounds. MDA‐MB‐468 and PANC1 cells harbor TP53 mutations that actively promote tumorigenesis 50, 51. Mechanistically, mutant p53‐mediated miR‐27a suppression increases cellular levels of EGFR and promotes downstream activation 52. MDA‐MB‐468 is also PTEN deficient, resulting in the activation of PI3K/AKT. Therefore, these cells have relatively high EGFR or AKT signaling. However, our experiments showed that knocking down ERRFI1 in these two cell lines, compared with siNeg control, resulted in further increased EGFR and downstream signaling, which contributed to resistance to gemcitabine, and that the addition of EGFR inhibitors could reverse the resistance phenotype (Fig 8). U251 cells contain PTEN and TP53 mutations 53, 54, leading to increased PI3K activity. However, on that background, downregulation of ERRFI1 reduced AKT activity by facilitating PHLPP access to AKT to catalyze dephosphorylation (Figs 2C and 3C). HCT116 cells contain KRAS mutations associated with upregulation of the MEK/ERK pathway. Overexpression of ERRFI1 further increased AKT activity in HCT116 cells (Fig EV5B) and, therefore, only the addition of an AKT inhibitor, not an EGFR inhibitor, sensitized the cells to gemcitabine (Fig 8C). The combination of an AKT inhibitor and MEK inhibitor might achieve better effect, and this needs to be further tested. Therefore, our results indicated that ERRFI1 level, together with EGFR level, could contribute to the selection of different therapeutic approaches. Furthermore, the individual organoid from four individual breast cancer tumors that showed very similar response profiles based on the EGFR levels significantly enhances the clinical relevance of our finding (Fig 9). Regardless of the genetic background, in cells or subjects with high EGFR expression, low ERRFI1 might contribute significantly to the activation of EGFR signaling and in this case, the addition of EGFR inhibitors might have greater benefit. However, in subjects with low EGFR expression, high EFFRI1 contributed significantly to increased AKT activity, and therefore, the addition of AKT inhibitors might have more benefit. Future clinical studies are needed to test the potential benefit of different combinations of targeted therapy based on the levels of these two proteins. Finally, to define the relationship between EGFR and ERRFI1 levels for prediction of response and for selection of therapies definitely required further study by using experimental data together with computational modeling approach.
In summary, our findings will have a significant impact on the dissection of components in the pathways controlling AKT and EGFR activity. Furthermore, because dysregulation of the these two pathways is frequently linked to cancer predisposition and poor prognosis, our findings might also have important implications for cancer development in addition to their contribution to variation in response to therapy and to stratifying patients for individualized combination therapy.
Materials and Methods
Cell lines and antibodies
EBV‐transformed LCLs from 90 African American (AA), 85 Caucasian American (CA), and 88 Han Chinese American (HCA) unrelated healthy were purchased from the Coriell Cell Repository. These samples had been collected and anonymized by NIGMS, and all subjects had provided written consent for their experimental use. This study was reviewed and approved by the Mayo Clinic Institutional Review Board. SU86 cell line was a gift from Dr. Daniel D. Billadeau, Mayo Clinic. OVCAR3, BT549, DU145, PC‐3, HS578T, IGROV1, A549, PANC1, MDA‐MB‐231, MDA‐MB‐468, U251, and HCT116 cell lines were obtained from the American Type Culture Collection (Manassas, VA). OVCAR3, BT549, DU145, PC‐3, IGROV1, A549, and SU86 cells were maintained in RPMI 1640 with 10% FBS. MDA‐MB‐231 and MDA‐MB‐468 cells were in L‐15 medium containing 10% FBS. HS578T, PANC1, and U251 cells were in DMEM with 10% FBS. LCLs were cultured in RPMI 1640 containing 15% FBS. Antibodies against GAPDH (#5174), GST (#2625), AKT (#4685), pAKT (Ser473) (#4060), pAKT (Thr308) (#4056), AKT1 (#2938), AKT2 (#3063), pAKT2 (Ser474) (#8599), AKT3 (#3788), GSK3β (#5676), p‐GSK3β (#9327), FOXO1 (#2880), p‐FOXO1 (#84192), EGFR (#2085), pEGFR (#3777), ERK1/2 (#9194), p‐ERK1/2 (#9101), MEK1/2 (#9146), p‐MEK1/2 (#9154), PDK1 (#13037), mTOR (#2972), and PP2A (#2259) were purchased from Cell Signaling Inc (Danvers, MA). Anti‐VEZT antibody (HPA017066) was from Sigma‐Aldrich. pAKT3 (Ser472) (#OAAB16215) was from Aviva Systems Biology. PHLPP1 (#A300‐660A) and PHLPP2 (#A300‐661A) antibodies were obtained from Bethyl Laboratories (Montgomery, TX). ERRFI1 (#ab198834), GOLGA8B (#ab174623), and SLC7A5 (#ab85226) antibodies were obtained from Abcam (Cambridge, MA). Human EGF was purchased from Sigma.
Cytotoxicity assay
Cytotoxicity assays in LCLs were performed in triplicate at each dose. Specifically, 100 ml of cells (5 × 10⁵ cells/ml) was plated into 96‐well plates 55 and was treated with TCN at 0, 0.01, 0.1, 1, 10, 25, 50, 100, and 500 μM for 3 days; 20 μl of MTS assay solution (Promega Corporation, Madison, WI) was added. Plates were read in a Safire2 plate reader (Tecan AG). Cytotoxicity for human tumor cell lines was determined by quantification of DNA content using CyQUANT Assay kit (#C35012, Invitrogen) following the manufacturer's instructions. Cells were treated with gemcitabine at 0, 0.0001, 0.001, 0.01, 0.1, 1, 10, 100, 1,000 μM for 3 days; 100 μl of CyQUANT assay solution was added, and plates were incubated at 37°C for 1 h, and then read in a Safire2 plate reader with filters appropriate for 480 nm excitation and 520 nm emission. TCN was purchased from EMD Biosciences (San Diego, CA). Gemcitabine was purchased from Sigma‐Aldrich (St. Louis, MO). MK‐2206 2HCl (#S1078) and Gefitinib (ZD1839) was purchased from Selleckchem (Houston, TX).
Cell proliferation assay
Cells transfected with specific siRNA were seeded (3,000 cells/100 μl/well) in a 96‐well plate (Corning, Corning, NY). The CyQUANT assay (Invitrogen) was used to determine the cell viability every 12 h in six replicates following the manufacturer's instructions, and plates were incubated at 37°C for 1 h and then read in a Safire2 plate reader with filters for 480 nm excitation and 520 nm emission.
Colony‐forming assays
Cells transfected with specific siRNA were plated (800–1,000 cells/well) in 6‐well culture plates (Corning) in triplicates. Subsequently, the cells were cultured for up to 14 days. Colonies were washed with cold PBS, fixed with frozen methanol, and then stained with Giemsa stain solution (Sigma‐Aldrich). Colonies (> 50 cells) were accounted with the ImageJ software (version 1.42q).
RNA interference and qRT–PCR
SMARTpool siRNAs for the candidate genes and negative control siRNA were purchased from Dharmacon. A second siRNA for ERRFI1 was purchased from OriGene (Rockville, MD). Reverse transfection was performed using lipofectamine RNAiMAX reagent (Invitrogen, Carlsbad, CA) following the manufacturer's instructions.
Total RNA was isolated with the Qiagen RNeasy kit, followed by qRT–PCR performed with the one‐step, Brilliant SYBR Green qRT–PCR master mix kit, using the Stratagene Mx3005P Real‐Time PCR detection system. Primers for VEZT (#QT01022609), GOLGA8B (#QT01840587), ERRFI1 (#QT00003969), and SLC7A5 (#QT00089145) were purchased from QIAGEN (Valencia, CA). All experiments were performed in triplicate with GAPDH as an internal control.
Plasmids
EGFR‐pCMV6 plasmid was purchased from OriGene. GST‐tagged ERRFI1 full‐length and deletion mutant constructs were gifts from Dr. Rüdiger Klein, Max Planck Institute of Neurobiology. In brief, PCR‐amplified ERRFI1 full‐length and deletion mutants were recombined into pDONOR201 vector. The pDONOR201 vectors containing ERRFI1 full‐length or deletion mutants were shuttled into pDEST 27 NH2‐terminal‐GST for mammalian expression 56. Full‐length ERRFI1 was cloned into pET28a vector (Clontech), and AKT was cloned into the pGEX4T‐1 vector (Amersham Biosciences) for bacterial expression. These plasmids were expressed in BL21 cells, and proteins were purified with His magnetic agarose Beads (Sigma, St. Louis, MO) and glutathione beads (Amersham Biosciences) according to the manufacturer's instruction.
Co‐immunoprecipitation assay and in vitro binding assay
Cells were lysed with NETN buffer (20 mM Tris–HCl, pH 8.0, 100 mM NaCl, 1 mM EDTA, 0.5% Nonidet P‐40) containing 50 mM β‐glycerophosphate, 10 mM NaF, and 1 mg/ml each of pepstatin A and aprotinin on ice for 25 min. After centrifugation, cell lysates were incubated with 2 μg antibody and protein A sepharose beads (Amersham Biosciences) for 3 h at 4°C. The immunocomplexes were then washed with NETN buffer for four times, and the immunocomplexes were separated by SDS–PAGE. Immunoblotting was performed following standard procedures.
Cells expressing empty vector or GST‐tagged ERRFI1 mutants were lysed with high‐salt NETN buffer (20 mM Tris–HCl, pH 8.0, 300 mM NaCl, 1 mM ethylenediaminetetraacetic acid (EDTA), 0.5% Nonidet P‐40) containing 50 mM β‐glycerophosphate, 10 mM NaF, and 1 μg/ml each of pepstatin A and aprotinin on ice for 25 min. Cell lysates were diluted 1:1 with NET buffer (NETN buffer without NaCl) and incubated with anti‐GST beads (Sigma) overnight at 4°C. After washing with NETN buffer five times, protein samples were resolved by sodium dodecyl sulfate–polyacrylamide gel electrophoresis (SDS–PAGE) in 4–15% TGX SDS gels (Bio‐Rad, Hercules, CA) and were transferred to PVDF membranes. Membranes were blocked in TBS with 5% BSA and 0.1% Tween‐20 and then incubated overnight at 4°C with the following primary antibodies. Membranes were washed with TBS‐T (TBS with 0.1% Tween‐20) and then incubated with HRP‐conjugated anti‐mouse IgG or HRP‐conjugated anti‐rabbit IgG (Cell signaling) for 1 h at room temperature. All blots were visualized with Supersignal WestPico chemiluminescent ECL kit (Thermo Fisher) and blue X‐ray films (Phenix, Candler, NC). Quantitative Western blot analysis was done using ImageJ.
To assay the in vitro binding between ERRFI1 and AKT, the recombinant GST‐AKT and His‐ERRFI1 were expressed in BL21 cells and purified following standard protocol; 5 μg of GST protein or 5 μg of the GST‐AKT protein was incubated with approximately the same amount of His‐ERRFI1 in binding buffer containing 0.2% Triton X‐100, 50 mM Tris–HCl (pH 7.5), 100 mM NaCl, 15 mM EGTA, 1 mM DTT, and 1 mM PMSF. Protein complex was pulled down with glutathione–sepharose beads (Thermo Scientific), washed four times with washing buffer (0.5% Triton X‐100, 50 mM Tris–Cl (pH 7.5), 100 mM NaCl, 15 mM EGTA, 1 mM DTT, and 1 mM PMSF), and then subjected to Western blot analysis.
LCL expression array assays
Total RNA was extracted using Qiagen RNeasy Mini kits (QIAGEN, Inc.) 57. RNA quality was tested using an Agilent 2100 Bioanalyzer, followed by hybridization to Affymetrix U133 Plus 2.0 Gene‐Chips. A total of 54,613 probe sets were used in the analyses. The microarray data have been submitted to the NCBI Gene Expression Omnibus under SuperSeries accession no. GSE24277.
Genomewide SNP analysis
DNA from all of the LCLs was genotyped using Illumina HumanHap 550K and 510S BeadChips as described previously 29 (SuperSeries accession no. GSE24277). We also obtained publicly available Affymetrix SNPArray 6.0 Chip SNP data for the same cell lines 57, which involved 643,600 SNPs unique to the Affymetrix SNP array. SNPs that deviated from Hardy–Weinberg equilibrium (HWE) based on the minimum P‐value from an exact test for HWE 58 and the stratified test for HWE (P < 0.001); SNPs with call rates < 95%; or SNPs with minor allele frequencies (MAFs) < 5% were removed from the analysis.
Patient‐derived xenografts generation and organoid derivation, 3D cell culture, and growth assay
Breast cancer patient‐derived xenografts (PDXs) from the Breast Cancer Genome Guided Therapy Study (BEAUTY) (NCT02022202) were generated according to previously described protocol 38. All patients provided written informed consent. All procedures of animal studies were performed according to the National Institutes of Health guideline with approval obtained from the Mayo Clinic Institutional Animal Care and Use Committee (IACUC) and Biosafety Committee. Female nonobese diabetic (NOD)‐Cg‐Prkdcscid Il2rgtm1Wjl/SzJ (NSG) mice (6–8 weeks) from Jackson Laboratories (Bar Harbor, ME) were randomized and blinded. Percutaneous breast cancer biopsies obtained prior to neoadjuvant chemotherapy in all patients were used for xenograft establishment 38. Mice were killed by CO2 inhalation once the tumor size met the IACUC guideline.
Tumor cells from breast cancer PDXs were isolated using the human tumor dissociation kit (Miltenyi Biotec, San Diego, CA). Briefly, tumors were minced into small pieces of 2–4 mm and then transferred into the gentle MACS C tube and run the 7C_h_TDK3 program according to manufacturer's protocol. The tubes were then centrifuged to collect the sample material. The cell suspension was then applied to a MACS SmartStrainer (70 μm). Mouse Cell Depletion Kit (Miltenyi Biotec) was used to enrich human cells. Specifically, cell pellet was suspended in buffer, 20 μl of the Mouse Cell Depletion Cocktail added and incubated for 15 min at 4°C. Then, magnetic separation with LS columns was performed to collect human cells. Human tumor cells were plated in 96‐well low binding NanoCulture plate (Organogenix) (104 cells/well) in DMEM supplemented with 10% FCS, 1% glutamax (Life Technologies), 1% sodium pyruvate (Life Technologies), non‐essential amino acids (Life Technologies), and 1% penicillin–streptomycin (Life Technologies) at 37°C, 5% CO2. After 3 days, 5 μM of ROCK inhibitor (Tocris Bioscience) was added to the culture medium and cultured for a week. Then, it was transferred to medium without ROCK inhibitor and cultured for 3 days.
EGFR‐high organoids were transfected with siERRFI1, while EGFR‐low organoids were transfected with ERRFI1 plasmids using Lipofectamine 2000 (Invitrogen). Organoid growth assays were performed in six replicates at each treatment. Specifically, organoids were treated with vehicle or 50 nM of gemcitabine alone or in combination with either 10 μM of gefitinib or 10 μM of TCN. Organoid growth was monitored every 3 days using the luminescent CellTiter‐Glo Viability assay (Promega); 100 μl of CellTiter‐Glo reagent was added into each well, followed by mixing contents for 2 min on an orbital shaker to induce cell lysis. Plates were incubated at 37°C for one hour, and the luminescent signal was measured in a Safire2 plate reader. Organoids were lysates with SDS buffer and subjected to Western blot.
Statistical analysis
TCN IC50 was calculated based on a logistic model. Three different logistic functions (a four‐parameter logistic model, a three‐parameter logistic model with a fixed asymptote at 0%, and a three‐parameter logistic model with a fixed asymptote at 100%) were used to fit the data with the R package “drc” (http://cran.r-project.org/web/packages/drc/drc.pdf). Log‐transformed IC50 values were then compared between genders, batches of samples on the basis of time since purchase by using independent‐samples t‐tests. An overall comparison of transformed IC50 values among ethnic groups was done by using an F‐test on the basis of ANOVA. Expression array data were normalized on a log2 scale using GCRMA. The normalized expression data and van der Waerden rank‐transformed IC50 values were then regressed on gender. Since the LCLs were from multiple races/ethnic groups, stratification was assessed using the method developed by Price et al 59, which uses an eigen analysis for detecting and adjusting SNPs. The log‐transformed IC50‐ and GCRMA‐normalized expression data were adjusted for race by five eigen vectors. The GWAS of SNP vs IC50 or SNP vs expression was done with Pearson correlations by using adjusted SNP, IC50, and expression values for each individual. For the siRNA knockdown experiments, group mean values of IC50 were compared using Student's t‐test.
Gene‐level association with IC50 values
To assess the association of a set of SNPs located in a gene with IC50, first SNPs were mapped to genes including 20 kb up‐ and downstream of a gene and SNPs could be mapped to multiple genes. Then, the SNPs were modeled as dosage counts of rare alleles and then principal components analysis (PCA) was performed on the SNPs, and principal components (PCs) capturing 80% of the variation in SNPs were retained as predictors. An F‐test was used to test the association of the PCs and van der Waerden rank‐transformed IC50 in an ordinary linear regression model.
For cell survival, cell proliferation, colony‐forming assays, and quantifications, data are represented as the mean ± SEM of three independent experiments. Statistical analyses were performed with Student's t‐test. Statistical significance is represented in figures by: *P < 0.05; **P < 0.01.
Author contributions
JC and LW designed the study; JC executed all the experiments in this study, analyzed data, and played a major role in interpretation of data and preparation of the manuscript; BLF and GDJ did the GWAS analysis and helped with preparation of the manuscript; YZ and JY contributed to the establishment of the patients' derived xenografts.
Conflict of interest
The authors declare that they have no conflict of interest.
Supporting information
Expanded View Figures PDF
Table EV1
Table EV2
Dataset EV1
Dataset EV2
Dataset EV3
Source Data for Expanded View
Review Process File
Source Data for Figure 2
Source Data for Figure 3
Source Data for Figure 4
Source Data for Figure 5
Source Data for Figure 6
Source Data for Figure 7
Source Data for Figure 8
Source Data for Figure 9
Acknowledgements
We thank Dr. Jian Yuan (Mayo Clinic) for discussion. We thank Dr. Rüdiger Klein (Max Planck Institute of Neurobiology) for the ERRFI1 deletion constructs. We thank collaborators who contributed to the development and conduct of the BEAUTY studies where the PDX tumors were collected, but who did not directly contribute to the current study. This work was supported by NIH grants R01CA196648, R01 CA138461, and U19 GM61388 (The Pharmacogenomics Research Network) and Mayo Center for Individualized Medicine (CIM).
EMBO Reports (2018) 19: e44767
References
- 1. Hanahan D, Weinberg RA (2011) Hallmarks of cancer: the next generation. Cell 144: 646–674 [DOI] [PubMed] [Google Scholar]
- 2. Stephens L, Anderson K, Stokoe D, Erdjument‐Bromage H, Painter GF, Holmes AB, Gaffney PR, Reese CB, McCormick F, Tempst P, et al (1998) Protein kinase B kinases that mediate phosphatidylinositol 3,4,5‐trisphosphate‐dependent activation of protein kinase B. Science 279: 710–714 [DOI] [PubMed] [Google Scholar]
- 3. Alessi DR, Deak M, Casamayor A, Caudwell FB, Morrice N, Norman DG, Gaffney P, Reese CB, MacDougall CN, Harbison D, et al (1997) 3‐Phosphoinositide‐dependent protein kinase‐1 (PDK1): structural and functional homology with the Drosophila DSTPK61 kinase. Curr Biol 7: 776–789 [DOI] [PubMed] [Google Scholar]
- 4. Padmanabhan S, Mukhopadhyay A, Narasimhan SD, Tesz G, Czech MP, Tissenbaum HA (2009) A PP2A regulatory subunit regulates C. elegans insulin/IGF‐1 signaling by modulating AKT‐1 phosphorylation. Cell 136: 939–951 [DOI] [PMC free article] [PubMed] [Google Scholar]
- 5. Sarbassov DD, Guertin DA, Ali SM, Sabatini DM (2005) Phosphorylation and regulation of Akt/PKB by the rictor‐mTOR complex. Science 307: 1098–1101 [DOI] [PubMed] [Google Scholar]
- 6. Gao T, Furnari F, Newton AC (2005) PHLPP: a phosphatase that directly dephosphorylates Akt, promotes apoptosis, and suppresses tumor growth. Mol Cell 18: 13–24 [DOI] [PubMed] [Google Scholar]
- 7. Beagle B, Fruman DA (2011) A lipid kinase cousin cooperates to promote cancer. Cancer Cell 19: 693–695 [DOI] [PMC free article] [PubMed] [Google Scholar]
- 8. Graupera M, Potente M (2013) Regulation of angiogenesis by PI3K signaling networks. Exp Cell Res 319: 1348–1355 [DOI] [PubMed] [Google Scholar]
- 9. Hirsch E, Ciraolo E, Franco I, Ghigo A, Martini M (2014) PI3K in cancer‐stroma interactions: bad in seed and ugly in soil. Oncogene 33: 3083–3090 [DOI] [PubMed] [Google Scholar]
- 10. Lemmon MA (2008) Membrane recognition by phospholipid‐binding domains. Nat Rev Mol Cell Biol 9: 99–111 [DOI] [PubMed] [Google Scholar]
- 11. Vanhaesebroeck B, Leevers SJ, Ahmadi K, Timms J, Katso R, Driscoll PC, Woscholski R, Parker PJ, Waterfield MD (2001) Synthesis and function of 3‐phosphorylated inositol lipids. Annu Rev Biochem 70: 535–602 [DOI] [PubMed] [Google Scholar]
- 12. Zhao JJ, Roberts TM (2006) PI3 kinases in cancer: from oncogene artifact to leading cancer target. Sci STKE 2006: pe52 [DOI] [PubMed] [Google Scholar]
- 13. Evangelisti C, Ricci F, Tazzari P, Chiarini F, Battistelli M, Falcieri E, Ognibene A, Pagliaro P, Cocco L, McCubrey JA, et al (2011) Preclinical testing of the Akt inhibitor triciribine in T‐cell acute lymphoblastic leukemia. J Cell Physiol 226: 822–831 [DOI] [PubMed] [Google Scholar]
- 14. Klempner SJ, Myers AP, Cantley LC (2013) What a tangled web we weave: emerging resistance mechanisms to inhibition of the phosphoinositide 3‐kinase pathway. Cancer Discov 3: 1345–1354 [DOI] [PMC free article] [PubMed] [Google Scholar]
- 15. Petrich AM, Leshchenko V, Kuo PY, Xia B, Thirukonda VK, Ulahannan N, Gordon S, Fazzari MJ, Ye BH, Sparano JA, et al (2012) Akt inhibitors MK‐2206 and nelfinavir overcome mTOR inhibitor resistance in diffuse large B‐cell lymphoma. Clin Cancer Res 18: 2534–2544 [DOI] [PMC free article] [PubMed] [Google Scholar]
- 16. Rodon J, Dienstmann R, Serra V, Tabernero J (2013) Development of PI3K inhibitors: lessons learned from early clinical trials. Nat Rev Clin Oncol 10: 143–153 [DOI] [PubMed] [Google Scholar]
- 17. Yap TA, Yan L, Patnaik A, Tunariu N, Biondo A, Fearen I, Papadopoulos KP, Olmos D, Baird R, Delgado L, et al (2014) Interrogating two schedules of the AKT inhibitor MK‐2206 in patients with advanced solid tumors incorporating novel pharmacodynamic and functional imaging biomarkers. Clin Cancer Res 20: 5672–5685 [DOI] [PMC free article] [PubMed] [Google Scholar]
- 18. Zhang C, Elkahloun AG, Liao H, Delaney S, Saber B, Morrow B, Prendergast GC, Hollander MC, Gills JJ, Dennis PA (2011) Expression signatures of the lipid‐based Akt inhibitors phosphatidylinositol ether lipid analogues in NSCLC cells. Mol Cancer Ther 10: 1137–1148 [DOI] [PMC free article] [PubMed] [Google Scholar]
- 19. Guix M, Faber AC, Wang SE, Olivares MG, Song Y, Qu S, Rinehart C, Seidel B, Yee D, Arteaga CL, et al (2008) Acquired resistance to EGFR tyrosine kinase inhibitors in cancer cells is mediated by loss of IGF‐binding proteins. J Clin Invest 118: 2609–2619 [DOI] [PMC free article] [PubMed] [Google Scholar]
- 20. Niu N, Qin Y, Fridley BL, Hou J, Kalari KR, Zhu M, Wu TY, Jenkins GD, Batzler A, Wang L (2010) Radiation pharmacogenomics: a genome‐wide association approach to identify radiation response biomarkers using human lymphoblastoid cell lines. Genome Res 20: 1482–1492 [DOI] [PMC free article] [PubMed] [Google Scholar]
- 21. Garrett CR, Coppola D, Wenham RM, Cubitt CL, Neuger AM, Frost TJ, Lush RM, Sullivan DM, Cheng JQ, Sebti SM (2011) Phase I pharmacokinetic and pharmacodynamic study of triciribine phosphate monohydrate, a small‐molecule inhibitor of AKT phosphorylation, in adult subjects with solid tumors containing activated AKT. Invest New Drugs 29: 1381–1389 [DOI] [PMC free article] [PubMed] [Google Scholar]
- 22. Hoffman K, Holmes FA, Fraschini G, Esparza L, Frye D, Raber MN, Newman RA, Hortobagyi GN (1996) Phase I‐II study: triciribine (tricyclic nucleoside phosphate) for metastatic breast cancer. Cancer Chemother Pharmacol 37: 254–258 [DOI] [PubMed] [Google Scholar]
- 23. Zhang X, Pickin KA, Bose R, Jura N, Cole PA, Kuriyan J (2007) Inhibition of the EGF receptor by binding of MIG6 to an activating kinase domain interface. Nature 450: 741–744 [DOI] [PMC free article] [PubMed] [Google Scholar]
- 24. Descot A, Hoffmann R, Shaposhnikov D, Reschke M, Ullrich A, Posern G (2009) Negative regulation of the EGFR‐MAPK cascade by actin‐MAL‐mediated Mig6/Errfi‐1 induction. Mol Cell 35: 291–304 [DOI] [PubMed] [Google Scholar]
- 25. Ellsworth KA, Moon I, Eckloff BW, Fridley BL, Jenkins GD, Batzler A, Biernacka JM, Abo R, Brisbin A, Ji Y, et al (2013) FKBP5 genetic variation: association with selective serotonin reuptake inhibitor treatment outcomes in major depressive disorder. Pharmacogenet Genomics 23: 156–166 [DOI] [PMC free article] [PubMed] [Google Scholar]
- 26. Huang RS, Duan S, Bleibel WK, Kistner EO, Zhang W, Clark TA, Chen TX, Schweitzer AC, Blume JE, Cox NJ, et al (2007) A genome‐wide approach to identify genetic variants that contribute to etoposide‐induced cytotoxicity. Proc Natl Acad Sci USA 104: 9758–9763 [DOI] [PMC free article] [PubMed] [Google Scholar]
- 27. Menashe I, Maeder D, Garcia‐Closas M, Figueroa JD, Bhattacharjee S, Rotunno M, Kraft P, Hunter DJ, Chanock SJ, Rosenberg PS, et al (2010) Pathway analysis of breast cancer genome‐wide association study highlights three pathways and one canonical signaling cascade. Cancer Res 70: 4453–4459 [DOI] [PMC free article] [PubMed] [Google Scholar]
- 28. Torkamani A, Topol EJ, Schork NJ (2008) Pathway analysis of seven common diseases assessed by genome‐wide association. Genomics 92: 265–272 [DOI] [PMC free article] [PubMed] [Google Scholar]
- 29. Dimas AS, Deutsch S, Stranger BE, Montgomery SB, Borel C, Attar‐Cohen H, Ingle C, Beazley C, Gutierrez Arcelus M, Sekowska M, et al (2009) Common regulatory variation impacts gene expression in a cell type‐dependent manner. Science 325: 1246–1250 [DOI] [PMC free article] [PubMed] [Google Scholar]
- 30. Ferby I, Reschke M, Kudlacek O, Knyazev P, Pante G, Amann K, Sommergruber W, Kraut N, Ullrich A, Fassler R, et al (2006) Mig6 is a negative regulator of EGF receptor‐mediated skin morphogenesis and tumor formation. Nat Med 12: 568–573 [DOI] [PubMed] [Google Scholar]
- 31. Brognard J, Sierecki E, Gao T, Newton AC (2007) PHLPP and a second isoform, PHLPP2, differentially attenuate the amplitude of Akt signaling by regulating distinct Akt isoforms. Mol Cell 25: 917–931 [DOI] [PubMed] [Google Scholar]
- 32. Liu J, Weiss HL, Rychahou P, Jackson LN, Evers BM, Gao T (2009) Loss of PHLPP expression in colon cancer: role in proliferation and tumorigenesis. Oncogene 28: 994–1004 [DOI] [PMC free article] [PubMed] [Google Scholar]
- 33. Pei H, Li L, Fridley BL, Jenkins GD, Kalari KR, Lingle W, Petersen G, Lou Z, Wang L (2009) FKBP51 affects cancer cell response to chemotherapy by negatively regulating Akt. Cancer Cell 16: 259–266 [DOI] [PMC free article] [PubMed] [Google Scholar]
- 34. Burgering BM, Coffer PJ (1995) Protein kinase B (c‐Akt) in phosphatidylinositol‐3‐OH kinase signal transduction. Nature 376: 599–602 [DOI] [PubMed] [Google Scholar]
- 35. Macreadie IG, Horaitis O, Verkuylen AJ, Savin KW (1991) Improved shuttle vectors for cloning and high‐level Cu(2 + )‐mediated expression of foreign genes in yeast. Gene 104: 107–111 [DOI] [PubMed] [Google Scholar]
- 36. Chan TO, Zhang J, Rodeck U, Pascal JM, Armen RS, Spring M, Dumitru CD, Myers V, Li X, Cheung JY, et al (2011) Resistance of Akt kinases to dephosphorylation through ATP‐dependent conformational plasticity. Proc Natl Acad Sci USA 108: E1120–E1127 [DOI] [PMC free article] [PubMed] [Google Scholar]
- 37. Manning BD, Cantley LC (2007) AKT/PKB signaling: navigating downstream. Cell 129: 1261–1274 [DOI] [PMC free article] [PubMed] [Google Scholar]
- 38. Goetz MP, Kalari KR, Suman VJ, Moyer AM, Yu J, Visscher DW, Dockter TJ, Vedell PT, Sinnwell JP, Tang X, et al (2017) Tumor sequencing and patient‐derived xenografts in the neoadjuvant treatment of breast cancer. J Natl Cancer Inst 109: djw306 [DOI] [PMC free article] [PubMed] [Google Scholar]
- 39. Fiorentino L, Pertica C, Fiorini M, Talora C, Crescenzi M, Castellani L, Alema S, Benedetti P, Segatto O (2000) Inhibition of ErbB‐2 mitogenic and transforming activity by RALT, a mitogen‐induced signal transducer which binds to the ErbB‐2 kinase domain. Mol Cell Biol 20: 7735–7750 [DOI] [PMC free article] [PubMed] [Google Scholar]
- 40. Hackel PO, Gishizky M, Ullrich A (2001) Mig‐6 is a negative regulator of the epidermal growth factor receptor signal. Biol Chem 382: 1649–1662 [DOI] [PubMed] [Google Scholar]
- 41. Klijn JG, Berns PM, Schmitz PI, Foekens JA (1992) The clinical significance of epidermal growth factor receptor (EGF‐R) in human breast cancer: a review on 5232 patients. Endocr Rev 13: 3–17 [DOI] [PubMed] [Google Scholar]
- 42. Normanno N, De Luca A, Bianco C, Strizzi L, Mancino M, Maiello MR, Carotenuto A, De Feo G, Caponigro F, Salomon DS (2006) Epidermal growth factor receptor (EGFR) signaling in cancer. Gene 366: 2–16 [DOI] [PubMed] [Google Scholar]
- 43. Abd El‐Rehim DM, Pinder SE, Paish CE, Bell JA, Rampaul RS, Blamey RW, Robertson JF, Nicholson RI, Ellis IO (2004) Expression and co‐expression of the members of the epidermal growth factor receptor (EGFR) family in invasive breast carcinoma. Br J Cancer 91: 1532–1542 [DOI] [PMC free article] [PubMed] [Google Scholar]
- 44. Nicholson RI, Gee JM, Harper ME (2001) EGFR and cancer prognosis. Eur J Cancer 37(Suppl. 4): S9–S15 [DOI] [PubMed] [Google Scholar]
- 45. Shepherd FA, Rodrigues Pereira J, Ciuleanu T, Tan EH, Hirsh V, Thongprasert S, Campos D, Maoleekoonpiroj S, Smylie M, Martins R, et al (2005) Erlotinib in previously treated non‐small‐cell lung cancer. N Engl J Med 353: 123–132 [DOI] [PubMed] [Google Scholar]
- 46. Chakravarti A, Loeffler JS, Dyson NJ (2002) Insulin‐like growth factor receptor I mediates resistance to anti‐epidermal growth factor receptor therapy in primary human glioblastoma cells through continued activation of phosphoinositide 3‐kinase signaling. Cancer Res 62: 200–207 [PubMed] [Google Scholar]
- 47. Jahn T, Seipel P, Urschel S, Peschel C, Duyster J (2002) Role for the adaptor protein Grb10 in the activation of Akt. Mol Cell Biol 22: 979–991 [DOI] [PMC free article] [PubMed] [Google Scholar]
- 48. West KA, Castillo SS, Dennis PA (2002) Activation of the PI3K/Akt pathway and chemotherapeutic resistance. Drug Resist Updat 5: 234–248 [DOI] [PubMed] [Google Scholar]
- 49. Freed‐Pastor WA, Mizuno H, Zhao X, Langerod A, Moon SH, Rodriguez‐Barrueco R, Barsotti A, Chicas A, Li W, Polotskaia A, et al (2012) Mutant p53 disrupts mammary tissue architecture via the mevalonate pathway. Cell 148: 244–258 [DOI] [PMC free article] [PubMed] [Google Scholar]
- 50. Lang D, Miknyoczki SJ, Huang L, Ruggeri BA (1998) Stable reintroduction of wild‐type P53 (MTmp53ts) causes the induction of apoptosis and neuroendocrine‐like differentiation in human ductal pancreatic carcinoma cells. Oncogene 16: 1593–1602 [DOI] [PubMed] [Google Scholar]
- 51. Wang W, Cheng B, Miao L, Mei Y, Wu M (2013) Mutant p53‐R273H gains new function in sustained activation of EGFR signaling via suppressing miR‐27a expression. Cell Death Dis 4: e574 [DOI] [PMC free article] [PubMed] [Google Scholar]
- 52. Bianco R, Shin I, Ritter CA, Yakes FM, Basso A, Rosen N, Tsurutani J, Dennis PA, Mills GB, Arteaga CL (2003) Loss of PTEN/MMAC1/TEP in EGF receptor‐expressing tumor cells counteracts the antitumor action of EGFR tyrosine kinase inhibitors. Oncogene 22: 2812–2822 [DOI] [PubMed] [Google Scholar]
- 53. Abe T, Terada K, Wakimoto H, Inoue R, Tyminski E, Bookstein R, Basilion JP, Chiocca EA (2003) PTEN decreases in vivo vascularization of experimental gliomas in spite of proangiogenic stimuli. Cancer Res 63: 2300–2305 [PubMed] [Google Scholar]
- 54. Benvenuti S, Sartore‐Bianchi A, Di Nicolantonio F, Zanon C, Moroni M, Veronese S, Siena S, Bardelli A (2007) Oncogenic activation of the RAS/RAF signaling pathway impairs the response of metastatic colorectal cancers to anti‐epidermal growth factor receptor antibody therapies. Cancer Res 67: 2643–2648 [DOI] [PubMed] [Google Scholar]
- 55. Li L, Fridley B, Kalari K, Jenkins G, Batzler A, Safgren S, Hildebrandt M, Ames M, Schaid D, Wang L (2008) Gemcitabine and cytosine arabinoside cytotoxicity: association with lymphoblastoid cell expression. Cancer Res 68: 7050–7058 [DOI] [PMC free article] [PubMed] [Google Scholar]
- 56. Pante G, Thompson J, Lamballe F, Iwata T, Ferby I, Barr FA, Davies AM, Maina F, Klein R (2005) Mitogen‐inducible gene 6 is an endogenous inhibitor of HGF/Met‐induced cell migration and neurite growth. J Cell Biol 171: 337–348 [DOI] [PMC free article] [PubMed] [Google Scholar]
- 57. Li L, Fridley BL, Kalari K, Jenkins G, Batzler A, Weinshilboum RM, Wang L (2009) Gemcitabine and arabinosylcytosin pharmacogenomics: genome‐wide association and drug response biomarkers. PLoS One 4: e7765 [DOI] [PMC free article] [PubMed] [Google Scholar]
- 58. Wigginton JE, Cutler DJ, Abecasis GR (2005) A note on exact tests of Hardy‐Weinberg equilibrium. Am J Hum Genet 76: 887–893 [DOI] [PMC free article] [PubMed] [Google Scholar]
- 59. Price AL, Patterson NJ, Plenge RM, Weinblatt ME, Shadick NA, Reich D (2006) Principal components analysis corrects for stratification in genome‐wide association studies. Nat Genet 38: 904–909 [DOI] [PubMed] [Google Scholar]
Associated Data
This section collects any data citations, data availability statements, or supplementary materials included in this article.
Supplementary Materials
Expanded View Figures PDF
Table EV1
Table EV2
Dataset EV1
Dataset EV2
Dataset EV3
Source Data for Expanded View
Review Process File
Source Data for Figure 2
Source Data for Figure 3
Source Data for Figure 4
Source Data for Figure 5
Source Data for Figure 6
Source Data for Figure 7
Source Data for Figure 8
Source Data for Figure 9


