Abstract
Mitochondrial dysfunction in the nigrostriatal dopaminergic system is a critical hallmark of Parkinson's disease (PD). Mitochondrial toxins produce cellular and behavioural dysfunctions resembling those in patients with PD. Causative gene products for familial PD play important roles in mitochondrial function. Therefore, targeting proteins that regulate mitochondrial integrity could provide convincing strategies for PD therapeutics. We have recently identified a novel 13‐kDa protein (p13) that may be involved in mitochondrial oxidative phosphorylation. In the current study, we examine the mitochondrial function of p13 and its involvement in PD pathogenesis using mitochondrial toxin‐induced PD models. We show that p13 overexpression induces mitochondrial dysfunction and apoptosis. p13 knockdown attenuates toxin‐induced mitochondrial dysfunction and apoptosis in dopaminergic SH‐SY5Y cells via the regulation of complex I. Importantly, we generate p13‐deficient mice using the CRISPR/Cas9 system and observe that heterozygous p13 knockout prevents toxin‐induced motor deficits and the loss of dopaminergic neurons in the substantia nigra. Taken together, our results suggest that manipulating p13 expression may be a promising avenue for therapeutic intervention in PD.
Keywords: cell death, complex I, mitochondria, p13, Parkinson's disease
Subject Categories: Molecular Biology of Disease, Neuroscience
Introduction
Parkinson's disease (PD), one of the most common motor disorders, is caused by the progressive and specific loss of nigrostriatal dopaminergic neurons 1, 2. Dopamine modulators are first‐line therapeutics for PD, but they face tolerability issues and have limited efficacy 3. Therefore, there is a compelling need for novel therapeutic strategies for PD 4, 5, 6.
Although the aetiology of PD remains unclear, the involvement of mitochondrial dysfunction in PD has been increasingly convincing 7, 8, 9, 10. Mitochondrial complex I deficiencies are detected in postmortem nigrostriatal tissues of patients with PD 11, 12, 13. Inhibitors of mitochondrial complex I such as rotenone and 1‐methyl‐4‐tetramethyl‐p‐phenylenediamine (MPTP) induce several hallmarks of PD, including motor deficits and nigrostriatal dopaminergic cell death in rodents and primates 14, 15, 16. Furthermore, mutations in mitochondrial DNA (mtDNA) leading to mitochondrial dysfunction have been considered a risk factor for PD 17, 18. The current model of PD proposes that defects in PTEN‐induced putative kinase 1 (PINK1) and Parkin, well‐known causative gene products for familial PD, cause an accumulation of dysfunctional mitochondria 19, 20. These findings argue that maintaining mitochondrial integrity could be a powerful and convincing strategy for PD treatment.
We have recently identified a novel 13‐kDa protein named p13, whose expression is decreased in pancreatic islets exposed to oxidative stress by a high‐fat diet 21. Oxidative stress is caused by the excessive accumulation of reactive oxygen species generated in dysfunctional mitochondria 22, 23. Recent proteomic analysis has identified human p13 (C7orf55) as a novel protein that may interact with mitochondrial proteins such as NDUFAB1, a complex I subunit, and ATPAF2, a complex V subunit 24. Furthermore, p13 has been demonstrated to partially co‐localize with mtDNA by immunostaining 25. We therefore hypothesized that p13 is a regulator of mitochondrial function. However, the mitochondrial function of p13 and its involvement in the molecular pathogenesis of PD are currently unknown.
In the present study, we examined the roles of p13 in mitochondrial function in both in vitro and in vivo PD models. Our results suggest that the reduction in p13 expression acts as a protective factor against PD pathogenesis via the maintenance of mitochondrial function.
Results and Discussion
p13 overexpression exacerbates rotenone‐induced mitochondrial dysfunction and apoptosis in SH‐SY5Y cells
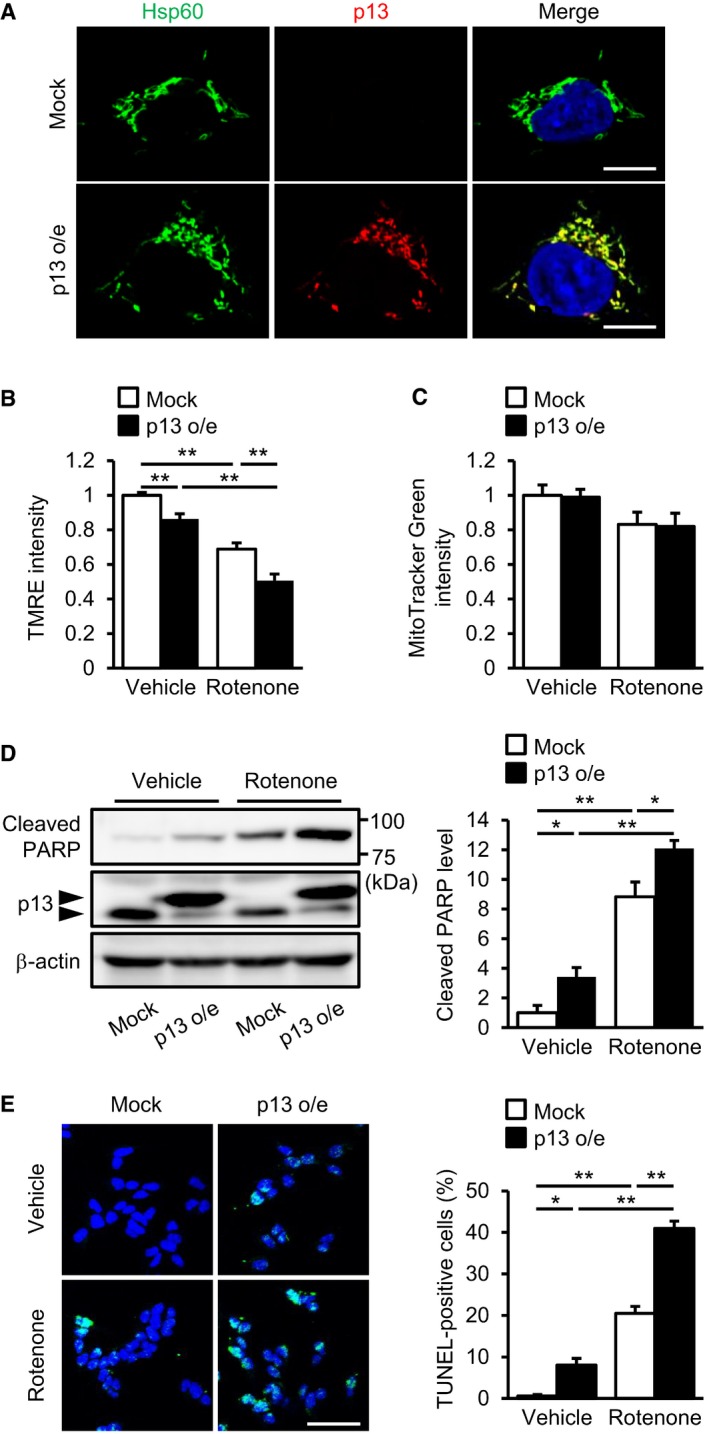
We found that p13 was co‐localized with Hsp60, a mitochondrial matrix‐localized protein in SH‐SY5Y cells, a human neuroblastoma cell line (Fig 1A). Next, we measured mitochondrial membrane potential (ΔΨm) using tetramethylrhodamine ethyl ester perchlorate (TMRE), which is sensitive to ΔΨm. We found that p13 overexpression significantly decreased ΔΨm compared with the levels measured in mock‐infected cells (Fig 1B). The ΔΨm decrease induced by rotenone, a mitochondrial complex I inhibitor, was exacerbated in p13‐overexpressed SH‐SY5Y cells (Fig 1B). The signal of MitoTracker Green FM, which localizes to mitochondria regardless of ΔΨm, did not differ between mock‐ and p13‐overexpressed cells under basal or rotenone‐treated conditions (Fig 1C), suggesting that p13 overexpression does not affect mitochondrial mass. Because mitochondria play a key role in apoptosis 26, 27, we evaluated the effects of p13 overexpression on apoptosis induction by measuring the levels of cleavage of poly (ADP‐ribose) polymerase (PARP). We observed that p13 overexpression significantly increased the levels of PARP cleavage in both the vehicle‐ and the rotenone‐treated cells (Fig 1D). We also applied the terminal deoxynucleotidyl transferase (TdT)‐mediated deoxyuridine triphosphate (dUTP) nick‐end labelling (TUNEL) method to detect apoptotic cells. We found that the overexpression of p13 increased the number of TUNEL‐positive cells under basal conditions and exacerbated the rotenone‐induced increase in TUNEL‐positive cells (Fig 1E). These data demonstrate that p13 overexpression induces mitochondrial dysfunction and apoptosis in SH‐SY5Y cells.
Figure 1. p13 overexpression exacerbates rotenone‐induced mitochondrial dysfunction and apoptosis in SH‐SY5Y cells.
-
ACo‐localization of overexpressed p13 and Hsp60, a mitochondrial matrix protein, in p13‐infected cells. Nucleus was stained with Hoechst (blue). Scale bars, 10 μm.
-
B, CExacerbated rotenone‐induced decrease in ΔΨm but no change in mitochondrial mass in p13‐infected cells. ΔΨm and mitochondrial mass were determined by measuring the fluorescence levels of TMRE (B) and MitoTracker Green FM (C), respectively.
-
D, EExacerbated rotenone‐induced apoptosis in p13‐infected cells. Apoptosis levels were evaluated by measuring the increases in PARP cleavage (D) and in percentage of TUNEL‐positive cells (E). The levels of cleaved PARP were normalized to those of β‐actin (D). The percentage of TUNEL‐positive cells was determined by TUNEL (green) and Hoechst (blue, a nuclear marker) staining (E). Representative images (left) and their quantification (right) were shown. Scale bar, 50 μm.
p13 knockdown prevents parkinsonian toxicant‐induced mitochondrial dysfunction and apoptosis in SH‐SY5Y cells
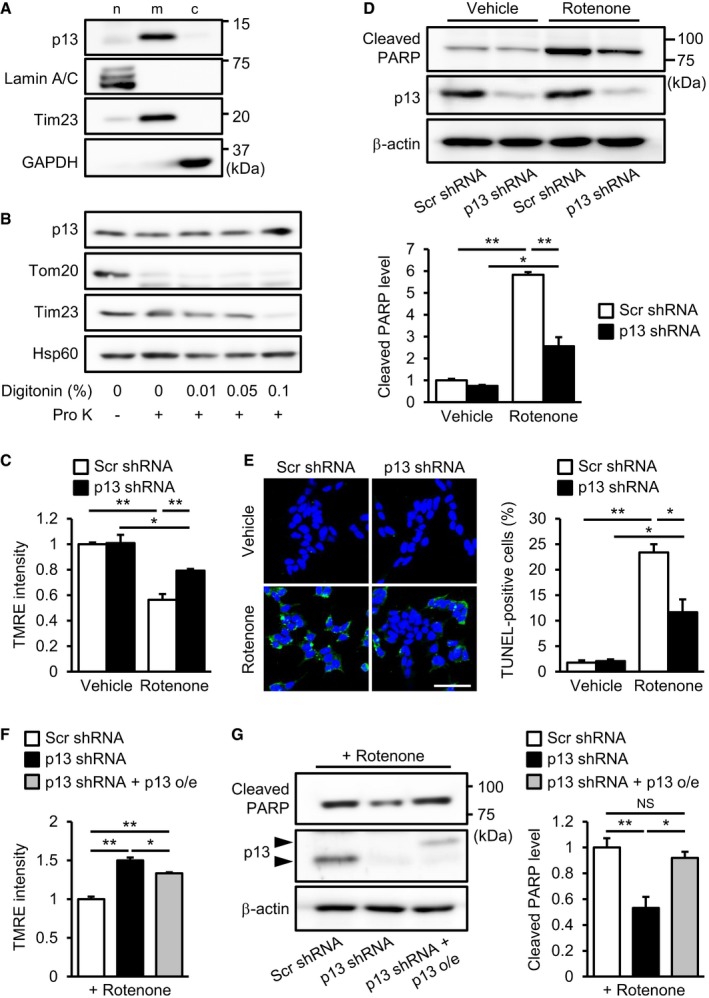
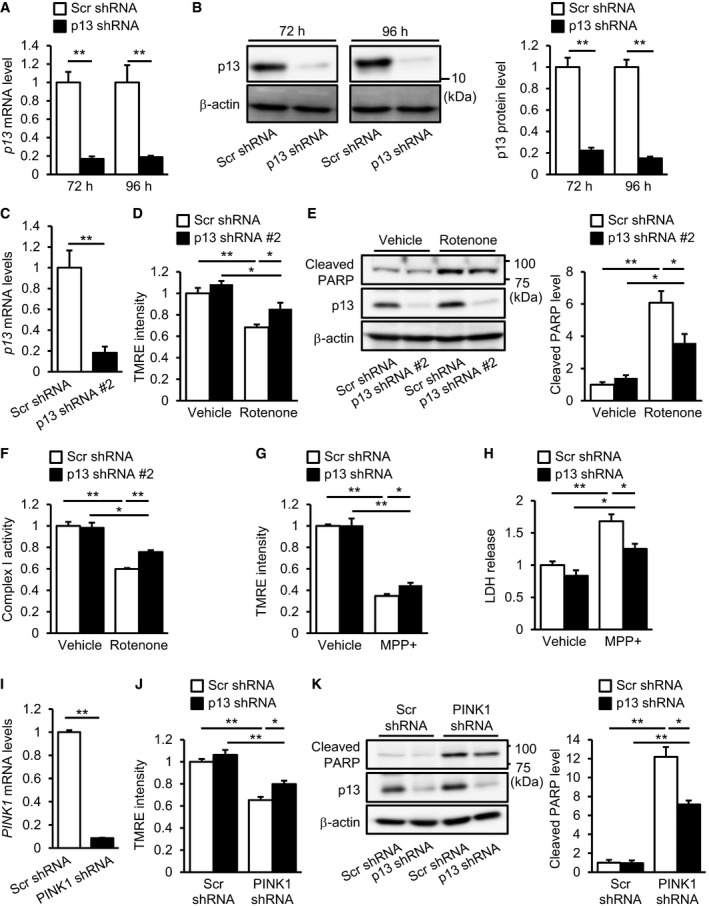
We first performed subcellular fractionation experiments and observed that endogenous p13 was most abundant in the mitochondria‐enriched fraction (Figs 2A and EV4B). Furthermore, to characterize the intramitochondrial localization of endogenous p13, we used digitonin fractionation, in which mitochondria were treated with various concentrations of digitonin for progressive membrane solubilization. We found that p13 showed a similar resistance to digitonin compared with the mitochondrial matrix marker Hsp60 (Fig 2B). Tom20 and Tim23, which are mitochondrial outer and inner membrane markers, respectively, are more sensitive to higher concentrations of digitonin than p13 or Hsp60 is (Fig 2B). These results suggest that p13 is mainly localized in the mitochondrial matrix. Based on the results from the overexpression experiments (Fig 1), we hypothesized that the downregulation of p13 expression prevents stress‐induced mitochondrial dysfunction and apoptosis. We confirmed shRNA‐mediated p13 knockdown in SH‐SY5Y cells (Fig EV1A and B). We then evaluated the effects of p13 knockdown on rotenone‐induced mitochondrial dysfunction and apoptosis in SH‐SY5Y cells. In contrast to control knockdown, p13 knockdown significantly prevented the rotenone‐induced decrease in ΔΨm and increases in cleaved PARP and TUNEL‐positive cells (Fig 2C–E). In the basal condition, the p13 knockdown did not affect the fluorescence intensity of TMRE, the cleavage of PARP or the percentage of TUNEL‐positive cells (Fig 2C–E). Similar results were obtained using another shRNA construct (p13 shRNA #2) targeting a different region of p13 (Fig EV1C–E). Furthermore, p13 knockdown attenuated the decrease in ΔΨm and the release of lactate dehydrogenase (LDH), a marker of cell death, by the mitochondrial complex I inhibitor 1‐methyl‐4‐phenylpyridine (MPP+), a metabolite of MPTP (Fig EV1G and H), confirming the protective effects of p13 knockdown against complex‐I‐inhibitor‐induced toxicity. In addition to the toxin‐induced PD model, we also examined the effects of p13 knockdown using a non‐toxic PD model in which PINK1 was knocked down (Fig EV1I) and found that p13 knockdown significantly prevented the decrease in ΔΨm and the PARP cleavage in the PINK1‐knockdown cells (Fig EV1J and K). Importantly, in rescue experiments (Fig 2F and G), the restoration of p13 expression in p13‐knockdown cells significantly reversed the protective effects of p13 knockdown on PARP cleavage by rotenone (Fig 2G), but the effect of the restoration of p13 expression on the rotenone‐induced decrease in ΔΨm was modest (Fig 2F). These data suggest that p13 knockdown significantly prevents parkinsonian toxicant‐induced mitochondrial dysfunction and apoptosis in SH‐SY5Y cells. Currently, it is unclear why, in contrast to p13 overexpression, p13 knockdown did not affect the fluorescence intensity of TMRE and the cleavage of PARP in the basal condition. We assume, however, several possibilities to reconcile the discrepancy. (i) A small amount of residual p13 protein after p13 knockdown may keep mitochondrial function in the basal condition. (ii) Other mitochondrial factors may compensate for the effect of p13 knockdown in the basal condition.
Figure 2. p13 knockdown prevents rotenone‐induced mitochondrial dysfunction and apoptosis in SH‐SY5Y cells.
-
ADistribution of p13 in the nuclear (n)‐, mitochondria (m)‐ and cytosol (c)‐enriched fractions of SH‐SY5Y cells. The blot was probed with antibodies against p13, Lamin A/C (a nuclear marker), Tim23 (a mitochondrial marker) and GAPDH (a cytoplasmic marker).
-
BMitochondrial localization of p13 in SH‐SY5Y cells. Isolated mitochondria were treated with 20 μg/ml proteinase K (Pro K) in the absence or presence of increasing concentrations of digitonin (0.01, 0.05 and 0.1%). Samples were subjected to Western blotting with antibodies against p13, Tom20 (outer mitochondrial membrane marker), Tim23 (inner mitochondrial membrane marker) and Hsp60 (mitochondrial matrix marker).
-
C–EPrevention of the rotenone‐induced decrease in ΔΨm (C), increase in PARP cleavage (D) and increase in percentage of TUNEL‐positive cells (E) in p13 shRNA‐infected cells. Scale bar, 50 μm.
-
F, GAttenuation of the rotenone‐induced decrease in ΔΨm (F) and increase in PARP cleavage (G) by the restoration of p13 expression in p13 shRNA‐infected cells. Arrowheads showed FLAG‐tagged p13 (p13 o/e) and endogenous p13.
Figure EV1. p13 knockdown prevents mitochondrial dysfunction and cytotoxicity.
-
A, BDecreased expression of p13 mRNA (A) or p13 protein (B) in cells 72 or 96 h after infection with lentiviral vectors expressing p13 shRNA. mRNA levels were quantified by real‐time RT–PCR (A). The levels of cleaved PARP were normalized to those of β‐actin (B). Representative images (left) and their quantification (right) were shown.
-
CDecreased expression of p13 mRNA in cells 96 h after infection with lentiviral vectors expressing p13 shRNA #2. mRNA levels were quantified by real‐time RT–PCR.
-
D–FPrevention of the rotenone‐induced decrease in ΔΨm (D), increase in PARP cleavage (E) and decrease in complex I activity (F) in cells infected with lentiviral vectors expressing p13 shRNA #2. Complex I activity was measured on the basis of NADH‐oxidizing activity. Seventy‐two hours after infection, cells were exposed to vehicle or 100 nM rotenone for 24 h.
-
G, HPrevention of the MPP+‐induced decrease in ΔΨm (G) and release of LDH (H) in p13 shRNA‐infected cells. LDH release was measured in culture medium of SH‐SY5Y cells using the LDH assay kit. Seventy‐two hours after infection, cells were treated with vehicle or 5 mM MPP+ for 24 h.
-
IDecreased expression of PINK1 mRNA in cells 96 h after infection with lentiviral vectors expressing PINK1 shRNA. mRNA levels were quantified by real‐time RT–PCR.
-
J, KPrevention of the PINK1‐knockdown‐induced decrease in ΔΨm (J) and increase in PARP cleavage (K) in p13 shRNA‐infected cells 96 h after infection with lentiviral vectors.
p13 knockdown maintains complex I activity independently of PINK1‐associated autophagy in rotenone‐treated SH‐SY5Y cells
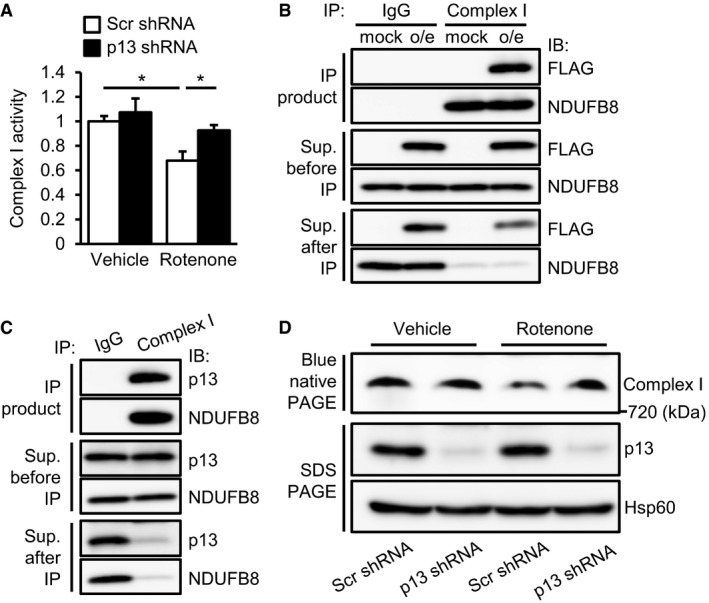
Recent reports have shown that p13 may interact with mitochondrial complex I and mtDNA 24, 25; however, it is unclear whether p13 is involved in their functions. We first examined the effects of p13 knockdown on complex I activity in the rotenone‐treated SH‐SY5Y cells. Interestingly, p13 knockdown significantly prevented the rotenone‐induced decrease in complex I activity compared with that observed in scrambled shRNA‐infected cells (Figs 3A and EV1F). We next examined the co‐immunoprecipitation study and found that the overexpressed p13 co‐precipitated well with complex I, as revealed by an immunoblot for nicotinamide adenine dinucleotide dehydrogenase (ubiquinone) 1β subcomplex 8 (NDUFB8), a mitochondrial complex I subunit, in SH‐SY5Y cells (Fig 3B). Endogenous p13 also co‐precipitated with complex I proteins in SH‐SY5Y cells (Fig 3C). Immunocytochemistry showed that the overexpressed p13 was co‐localized with mitochondrial complex I (Fig EV2A). We then examined the effects of p13 knockdown on complex I assembly in SH‐SY5Y cells and found that p13 knockdown prevented the rotenone‐induced impairment of complex I assembly (Fig 3D). We then examined the expression levels of mitochondrial mRNAs encoded by mtDNA in p13‐knockdown rotenone‐treated SH‐SY5Y cells. There was no significant difference in mitochondrial mRNA expression levels between scrambled shRNA‐ and p13 shRNA‐infected rotenone‐treated SH‐SY5Y cells (Fig EV2B). These results suggest that the interaction between p13 and complex I but not mtDNA is necessary to prevent mitochondrial dysfunction.
Figure 3. p13 knockdown maintains complex I activity in rotenone‐treated SH‐SY5Y cells.
-
APrevention of the rotenone‐induced decrease in complex I activity in p13 shRNA‐infected cells. Complex I activity was measured on the basis of NADH‐oxidizing activity. Data are presented as the mean ± SEM (n = 3). *P < 0.05 by the Tukey–Kramer test.
-
B, CPhysical interaction between overexpressed p13 (B) or endogenous p13 (C) and complex I proteins. Lysates were immunoprecipitated with anti‐complex I antibody and control IgG. The lysates and immunoprecipitates were subjected to Western blotting with antibodies against FLAG (B), p13 (C) or NDUFB8 (complex I protein). Cells were infected with lentiviral vectors expressing mock or FLAG‐tagged p13 (p13 o/e, B).
-
DPrevention of rotenone‐induced impairment of complex I assembly by p13 knockdown in p13 shRNA‐infected cells. Mitochondrial fractions were subjected to blue native PAGE, followed by Western blotting with an antibody against NDUFB8 (complex I protein). Levels of p13 and Hsp60 (for loading control) in the mitochondrial fraction were analysed.
Figure EV2. Involvement of p13 in complex I and mtDNA.
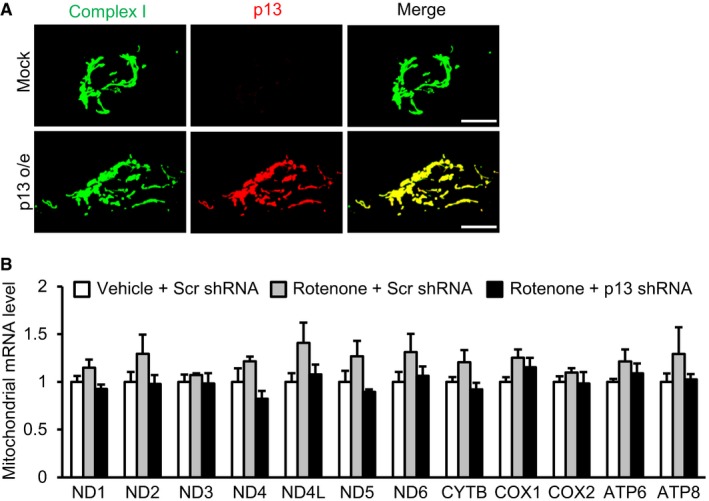
- Co‐localization of overexpressed p13 and complex I proteins in cells infected with lentiviral vectors expressing FLAG‐tagged p13 (p13 o/e). Overexpressed p13 was detected using an antibody against p13. Scale bars, 10 μm.
- Effects of p13 knockdown on the mRNAs encoded by the mitochondrial genome in cells. Seventy‐two hours after infection with lentiviral vectors expressing scrambled shRNA (Scr shRNA) or p13 shRNA, cells were treated with vehicle or rotenone for 24 h. mRNA levels of each gene were normalized to those in vehicle‐treated and Scr shRNA‐infected cells. Data are presented as the mean ± SEM (n = 3).
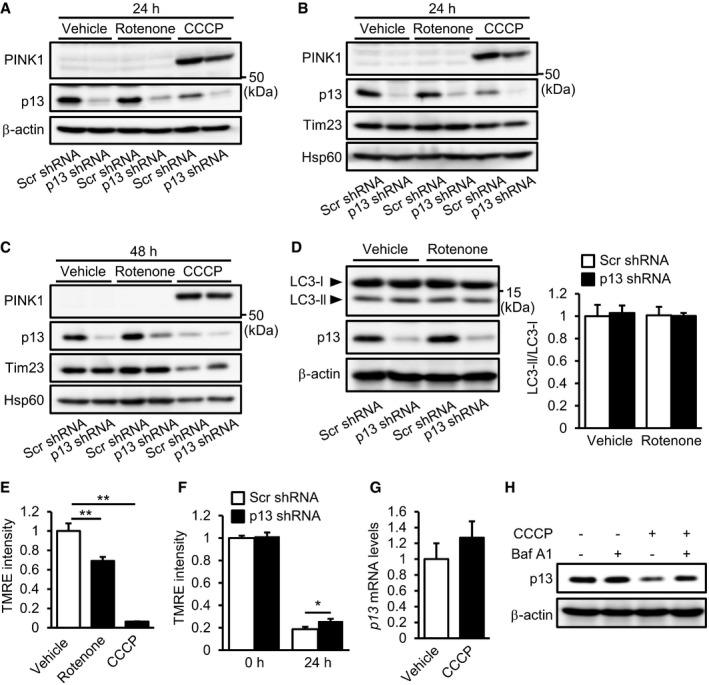
A popular topic in PD pathogenesis research is PINK1/Parkin‐mediated autophagy 28. PINK1 accumulates on the mitochondrial outer membrane following the loss of ΔΨm 29, 30 and, in conjunction with Parkin, helps to eliminate damaged mitochondria by autophagy 31, 32, 33. To examine whether the autophagy machinery is involved in the protective effects of p13 knockdown, we evaluated the mitochondrial accumulation of PINK1 and autophagy induction in rotenone‐treated SH‐SY5Y cells. We observed that PINK1 accumulation was not stimulated by rotenone regardless of the manipulation of p13 expression (Fig EV3A–C). As shown in Fig EV3D, p13 knockdown did not induce autophagy, as determined by measuring the conversion of LC3‐I to LC3‐II, which is indicative of autophagic activity 34. These results suggest that p13 knockdown prevents rotenone‐induced mitochondrial dysfunction independently of PINK1‐associated autophagy. We found that a mitochondrial uncoupler, carbonyl cyanide m‐chlorophenylhydrazone (CCCP), but not rotenone, significantly increased PINK1 accumulation (Fig EV3A–C). The underlying mechanism of these results remains unclear, but we found that rotenone mildly reduced ΔΨm compared to CCCP (Fig EV3E). Since PINK1 accumulates on the mitochondrial outer membrane following the loss of ΔΨm 19, the rotenone‐induced depolarization of ΔΨm may not be sufficient to trigger PINK1 accumulation. We also found that the CCCP‐induced reduction in ΔΨm was slightly reversed in p13‐knockdown cells (Fig EV3F), which is likely to cause the slight decrease in PINK1 accumulation as compared to that in the control‐knockdown cells (Fig EV3A). In addition, we found that CCCP treatment did not decrease p13 mRNA levels (Fig EV3G) and that the CCCP‐induced decrease in p13 levels was prevented by bafilomycin A1, an autophagy inhibitor (Fig EV3H), suggesting that p13 may be partially degraded by CCCP‐mediated autophagy ahead of the other mitochondrial proteins such as Tim23 and Hsp60 (Fig EV3B and C).
Figure EV3. p13 knockdown did not affect PINK1‐associated autophagy in rotenone‐treated SH‐SY5Y cells.
-
APINK1 accumulation in p13 shRNA‐infected SH‐SY5Y cells. Seventy‐two hours after infection, cells were exposed to vehicle, 100 nM rotenone or 10 μM CCCP for 24 h. Total cell lysates were subjected to Western blotting with antibodies against PINK1, p13 and β‐actin.
-
B, CPINK1 accumulation in isolated mitochondria from p13 shRNA‐infected cells. Seventy‐two hours after infection, cells were exposed to vehicle, 100 nM rotenone or 10 μM CCCP for 24 h (B) or 48 h (C). Mitochondrial fractions were purified and subjected to Western blotting with antibodies against PINK1, p13, Tim23 and Hsp60.
-
DNo significant change in autophagy induction by p13 knockdown in p13 shRNA‐infected cells. Seventy‐two hours after infection, cells were exposed to vehicle or 100 nM rotenone for 24 h. Autophagy was measured by the conversion of cytosolic LC3‐I to the autophagosome‐associated LC3‐II. Representative images (left) and the quantification of the ratio of LC3‐II to LC3‐I (right). Total cell lysates were subjected to Western blotting with antibodies against LC3, p13 and β‐actin.
-
EDecrease in ΔΨm in SH‐SY5Y cells 24 h after treatment with 100 nM rotenone or 10 μM CCCP. ΔΨm was determined by measuring the TMRE fluorescence levels.
-
FAttenuated CCCP‐induced decrease in ΔΨm in p13 shRNA‐infected SH‐SY5Y cells. ΔΨm was determined by measuring the TMRE fluorescence levels. Seventy‐two hours after infection, cells were exposed to vehicle or 10 μM CCCP for 24 h.
-
GNo change in expression of p13 mRNA 24 h after treatment of 10 μM CCCP in SH‐SY5Y cells. mRNA levels were quantified by real‐time RT–PCR.
-
HBlockage of the CCCP‐induced decrease in p13 expression by bafilomycin A1 (BafA1) in SH‐SY5Y cells. Cells were exposed to vehicle or 10 μM CCCP for 24 h. Cells were treated with or without 50 nM BafA1 for 2 h before harvest. Total cell lysates of these cells were subjected to Western blotting with antibodies against p13 and β‐actin.
Neuronal p13 expression in parkinsonian toxin exposure and PD
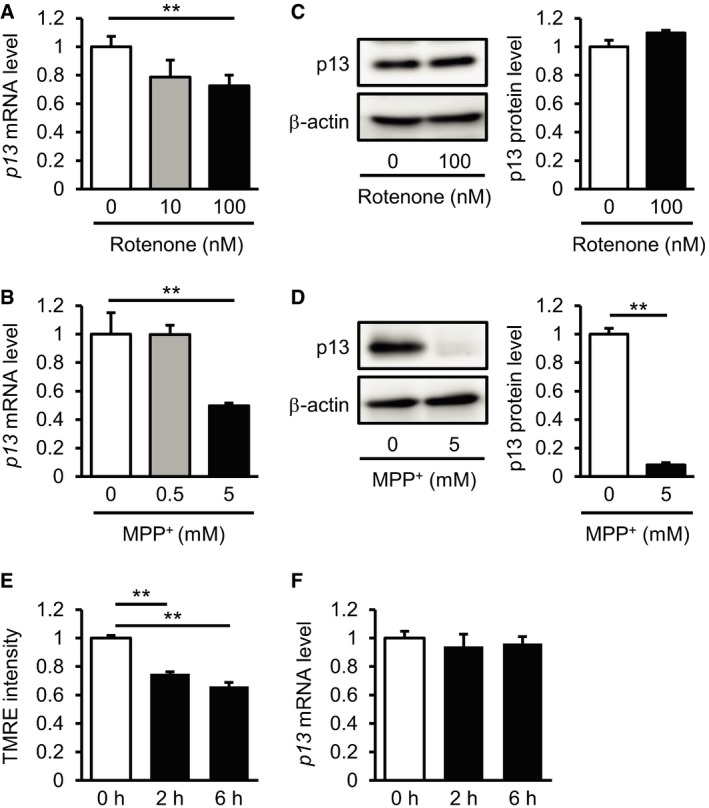
We next investigated the in vivo function of p13 using an acute MPTP‐induced experimental PD model in which nigrostriatal dopaminergic neurons are selectively damaged 15. Based on an in situ hybridization analysis, p13 mRNA was widely expressed in different brain regions, including the olfactory bulb, cortex, hippocampus, cerebellum, striatum and midbrain (Fig EV4A). Western blot analysis indicated that endogenous p13 protein was highly expressed in specific regions, including the cortex, thalamus, midbrain and cerebellum, in mice (Fig EV4C). Using the MPTP‐induced PD model, we next examined whether MPTP application changes p13 expression levels in the various regions of the brain. We found that MPTP significantly decreased p13 mRNA expression levels selectively in the midbrain among the examined samples (Fig EV4D). We also found that p13 expression in the midbrain of MPTP‐treated mice was decreased compared to that of vehicle‐treated mice (Fig EV4E). These data are consistent with the vulnerability of midbrain dopaminergic neurons to MPTP 15. Likewise, we observed that rotenone and MPP+ decreased the expression of p13 mRNA in SH‐SY5Y cells (Fig EV5A and B). While MPP+ also decreased the p13 protein levels as well as p13 mRNA levels, rotenone treatment did not decrease p13 protein levels (Fig EV5C and D). The reason for the discrepancy is currently unclear. One possibility is that rotenone may inhibit p13 protein degradation through impairment of lysosomal functions 35. These results indicate that p13 expression in dopaminergic neurons is decreased by parkinsonian toxicants and suggest that p13 reduction might function as part of an endogenous protective mechanism against PD pathogenesis. Alternatively, many mitochondria proteins are downregulated under toxin‐induced conditions 36; thus, the downregulation of p13 may be a downstream effect of mitochondrial dysfunction. In addition, p13 mRNA expression was not decreased by rotenone at early time points (2 and 6 h), when the mitochondrial dysfunction determined by the reduction in TMRE intensity was already marked (Fig EV5E and F).
Figure EV4. Distribution of p13 expression in the brain.
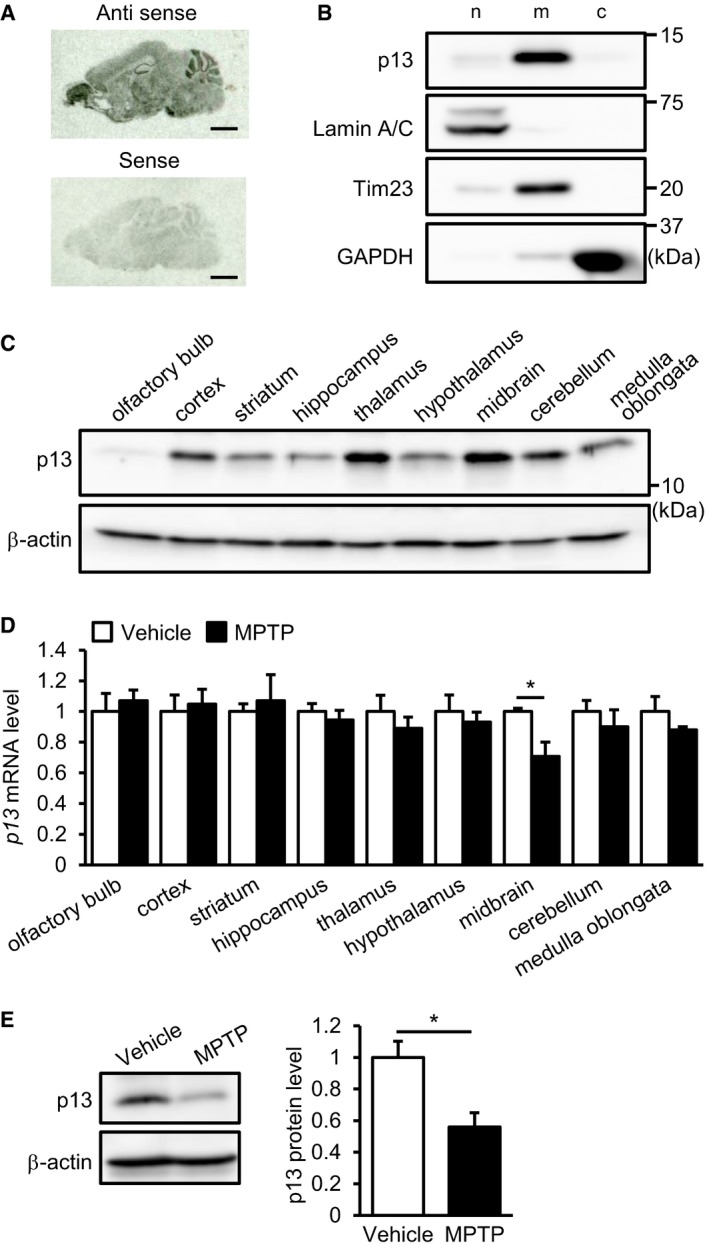
- Distribution of p13 mRNA in sagittal brain sections of mice analysed by in situ hybridization. Scale bars, 2 mm.
- Distribution of p13 in nuclear (n)‐, mitochondria (m)‐ and cytosol (c)‐enriched fractions of the mouse brain. The nuclear, mitochondria and cytosol fractions were purified and subjected to Western blotting with antibodies against p13, Lamin A/C (a nuclear marker), Tim23 (a mitochondrial marker) and GAPDH (a cytoplasmic marker).
- Expression of p13 protein in various brain regions of mice. Brain lysates of each region were prepared and subjected to Western blotting with antibodies against p13 and β‐actin.
- Expression of p13 mRNA in various brain regions of mice treated with 10 mg/kg MPTP. mRNA levels were quantified by real‐time RT–PCR. The mRNA level in each brain region of the MPTP‐treated mice was normalized to that of vehicle‐treated mice.
- Expression of p13 protein in the midbrain of mice treated with 10 mg/kg MPTP. Total lysates were subjected to Western blotting with antibodies against p13 and β‐actin. p13 levels were normalized to β‐actin levels.
Figure EV5. p13 expression in the parkinsonian toxicant‐treated SH‐SY5Y cells.
-
A, BDecreased expression of p13 mRNA 24 h after treatment with 100 nM rotenone (A) or 5 mM MPP+ (B) in SH‐SY5Y cells. mRNA levels were quantified by real‐time RT–PCR.
-
CNo change in expression of p13 protein 24 h after treatment with 100 nM rotenone in SH‐SY5Y cells. Total cell lysates were subjected to Western blotting with antibodies against p13 and β‐actin. The levels of p13 were normalized to those of β‐actin.
-
DDecreased expression of p13 protein 24 h after treatment with 5 mM MPP+ in SH‐SY5Y cells. Total cell lysates were subjected to Western blotting with antibodies against p13 and β‐actin. The levels of p13 were normalized to those of β‐actin.
-
EDecrease in ΔΨm in SH‐SY5Y cells 2 or 6 h after treatment with 100 nM rotenone. ΔΨm was determined by measuring the TMRE fluorescence levels.
-
FExpression of p13 mRNA in SH‐SY5Y cells 2 or 6 h after treatment with 100 nM rotenone. mRNA levels were quantified by real‐time RT–PCR.
p13 heterozygous knockout prevents MPTP‐induced motor deficits and neurodegeneration in mice
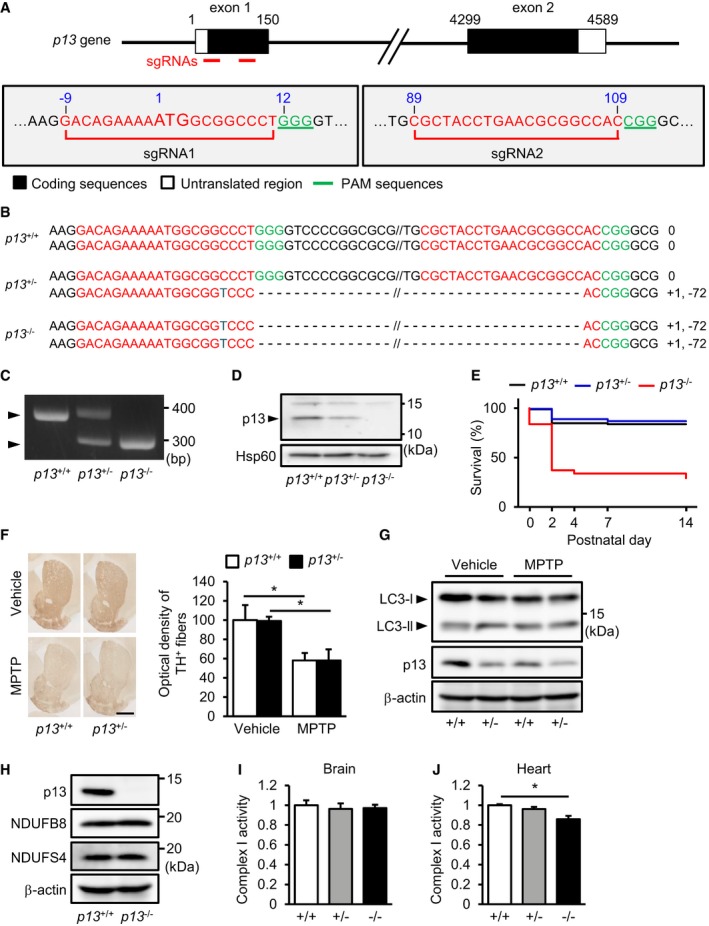
To examine the effects of the suppression of p13 expression in an in vivo PD model, we generated p13 knockout mice using the CRISPR/Cas9 system (Fig EV6A–D). We used p13 +/− mice to evaluate the in vivo effects of the p13 knockdown because p13 −/− mice showed high lethality shortly after birth (Fig EV6E). We first confirmed that the acute MPTP administration to p13 +/+ mice caused a marked deficit in motor coordination as measured by rotarod performance (Fig 4A). In sharp contrast to p13 +/+ mice, p13 +/− mice did not display MPTP‐induced motor deficits (Fig 4A). We then examined the MPTP‐induced degeneration of dopaminergic neurons in the substantia nigra of p13 +/+ and p13 +/− mice by using Stereo Investigator software with a fractionator (MBF Bioscience). We found that the MPTP‐induced reduction in the number of tyrosine hydroxylase‐expressing (TH+) cells was almost completely reversed in p13 +/− mice compared with p13 +/+ mice (Fig 4B). In vehicle‐treated mice, there was no difference in the number of TH+ cells between p13 +/+ and p13 +/− mice (Fig 4B). Furthermore, we measured the optical density of TH+ fibres in the striatum and found that MPTP‐induced reduction in the optical density of TH+ fibres was not reversed in p13 +/− mice compared with p13 +/+ mice (Fig EV6F). As previously reported 37, these results suggest that the restoration of dopaminergic function in the substantia nigra is important for the improvement in MPTP‐induced motor dysfunction. Furthermore, we found that the percentage of TUNEL‐positive cells was decreased in the substantia nigra of MPTP‐treated p13 +/− mice (Fig 4C). We also observed that the conversion of LC3 was not induced in the mouse substantia nigra by MPTP regardless of the difference of p13 expression (Fig EV6G). Interestingly, we found that the rotenone‐induced decrease in ΔΨm was slightly attenuated in isolated mitochondria from the midbrain of p13 +/− mice (Fig 4D). We found that the endogenous p13 co‐precipitated with complex I proteins in the brain samples (Fig 4E). The activity and assembly of mitochondrial complex I in the midbrain of p13 +/+ mice were impaired by MPTP, whereas those processes were unimpaired in p13 +/– mice (Fig 4F and G). These results argue that the targeted knockdown of p13 protects against experimental parkinsonism in vivo as well as in vitro. In addition, the complex I protein level in the brain of p13 −/− mice was virtually identical to that of p13 +/+ mice (Fig EV6H).
Figure EV6. Generation of p13 knockout mice using the CRISPR/Cas9 system.
-
ASchematic diagram of single‐guide RNAs (sgRNAs) targeting the mouse p13 gene. Two sgRNA sequences, sgRNA1 and sgRNA2, are shown in red. The protospacer adjacent motif (PAM) sequences are shown in green.
-
BGenomic sequence analysis of the obtained p13 +/+, p13 +/− and p13 −/− mice. p13 +/− and p13 −/− mice harboured a 71‐bp deletion in exon 1 of the p13 gene.
-
CGenotyping indicated of p13 +/+, p13 +/− and p13 −/− mice by genomic PCR using primers for p13 (see Materials and Methods).
-
DExpression of p13 in mitochondria from the brains of p13 +/+, p13 +/− and p13 −/− mice. Mitochondrial fractions were purified and subjected to Western blotting with antibodies against p13 and Hsp60 (control).
-
EKaplan–Meier survival curves for p13 +/+, p13 +/− and p13 −/− mice (p13 +/+, n = 86; p13 +/−, n = 143; and p13 −/−, n = 65).
-
FNo significant change in the MPTP‐induced decrease in optical density of TH+ fibres in the striatum of p13 +/+ and p13 +/− mice, as analysed by immunohistochemistry (n = 3). Representative images (left) and the quantification of optical density of TH+ fibres in the striatum (right). Scale bar, 1 mm.
-
GNo significant changes in autophagy induction in the substantia nigra of MPTP‐treated p13 +/+ and p13 +/− mice. Autophagy was measured by the conversion of LC3‐I to LC3‐II. Total lysates were subjected to Western blotting with antibodies against LC3, p13 and β‐actin.
-
HExpression of p13, NDUFB8 and NDUFS4 in the brains of p13 +/+ and p13 −/− mice. Total cell lysates were subjected to Western blotting with antibodies against p13, NDUFB8, NDUFS4 and β‐actin.
-
I, JComplex I activity in the brains (I) or the hearts (J) of p13 +/+, p13 +/− and p13 −/− mice. Brain or heart extracts were prepared, and complex I activity was measured based on NADH‐oxidizing activity.
Figure 4. p13 heterozygous knockout prevents MPTP‐induced behavioural deficits and neurodegeneration in mice.
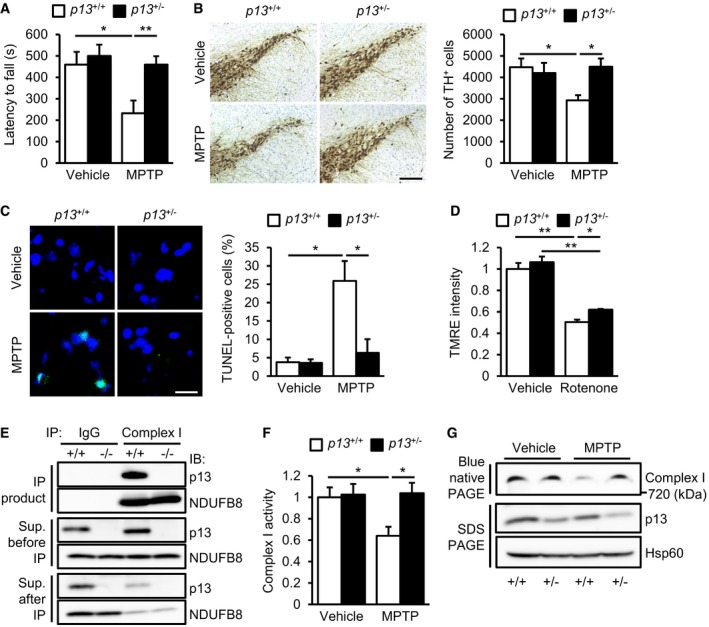
- Prevention of MPTP‐induced motor deficits on the rotarod test in p13 +/− mice. Latency to fall in two consecutive trials is presented (n = 10).
- Prevention of MPTP‐induced decrease in TH+ neurons in the substantia nigra of p13 +/− mice analysed by immunohistochemistry (n = 4). Representative images (left) and the quantification of the number of TH+ cells in the substantia nigra (right). Scale bar, 200 μm.
- Prevention of MPTP‐induced increase in TUNEL‐positive cells in the substantia nigra of p13 +/− mice (n = 3). Representative images (left, TUNEL, shown in green; Hoechst, shown in blue) and the quantification of percentage of TUNEL‐positive cells (right). Scale bar, 20 μm.
- Attenuation of rotenone‐induced decrease in ΔΨm in isolated mitochondria from the midbrain of p13 +/− mice (n = 3). Isolated mitochondria were exposed to 1 μM rotenone for 10 min.
- Physical interaction between endogenous p13 and complex I proteins in the brain. Brain extracts from p13 +/+ and p13 −/− mice were immunoprecipitated with anti‐complex I antibody and control IgG. The lysates and immunoprecipitates were subjected to Western blotting with antibodies against p13 and NDUFB8 (complex I protein).
- Prevention of the MPTP‐induced decrease in complex I activity in the midbrain of p13 +/− mice (n = 3). Complex I activity was measured on the basis of NADH‐oxidizing activity.
- Prevention of MPTP‐induced impairment of complex I assembly in the midbrain of p13 +/− mice. Mitochondrial fractions were subjected to blue native PAGE, followed by Western blotting with an antibody against NDUFB8 (complex I protein). Levels of p13 and Hsp60 (for loading control) in the mitochondrial fraction were analysed.
PD is characterized by the progressive and selective degeneration of nigrostriatal dopaminergic neurons, but there is no established neuroprotective or neurorestorative treatment for PD. We demonstrated for the first time that p13 expression was reduced by parkinsonian toxicants both in cell culture and in the mouse midbrain (Figs EV4D and E, and EV5A, B and D). Our mechanistic studies show that p13 knockdown prevented parkinsonian toxicant‐induced mitochondrial dysfunction and cell death by enhancing complex I activity (Figs 2C–E and 3A). p13 heterozygous knockout also significantly protected mice against MPTP‐induced motor deficits and nigral dopaminergic neurodegeneration (Fig 4). Thus, these results suggest that the reduction in p13 expression can act as a protective factor against PD‐related pathogenesis and that the manipulation of p13 expression might be a novel and beneficial treatment option for PD.
Controlling mitochondrial integrity has been regarded as a convincing strategy for PD therapeutics 8, 9, 38. Indeed, reducing excessive mitochondrial oxidative stress 22, 39, stimulating PINK1/Parkin‐mediated autophagy 20, 40 and promoting mitochondrial biogenesis 41, 42 have shown beneficial effects in PD models. However, understanding the PD pathogenesis associated with mitochondria continues to be a major research challenge because mitochondrial function is regulated by a complex network. Our findings suggest that p13 is a novel player in maintaining mitochondrial integrity. Using cell culture and mouse models, our study demonstrates that the reduction in p13 protects dopaminergic cells from mitochondrial dysfunction. Further analyses of the roles of p13 in conjunction with other mitochondrial proteins are important for clarifying the p13‐mediated regulation of mitochondrial function in PD pathogenesis. To evaluate the role of p13 in PD pathogenesis, we examined the expression level of p13 mRNA in the postmortem brain tissue of three PD patients and three age‐matched control subjects. p13 mRNA expression levels in the frontal cortex of the patients with PD tended to be lower than those of the control subjects (data not shown); however, the result is necessarily preliminary, mainly owing to the small sample size. The additional therapeutic potential of p13 reduction, such as lack of tolerance or prevention of the disease progression, would be evaluated via further comparative studies using PD patient samples.
On the basis of the present data, the most likely mechanism for the protective effects of p13 reduction against PD pathogenesis is the regulation of complex I activity. p13 has an LYR motif that is associated with the assembly of complex I 43. We found that p13 physically interacts with complex I proteins (Figs 3B and C, and 4E). A recent study also demonstrated that p13 is likely to interact with NDUFAB1, a subunit of complex I 24. Thus, it is possible that p13 functions as an assembly factor of complex I. In this study, p13 reduction prevented the decrease in complex I activity and assembly by parkinsonian toxicants (Figs 3A and D, and 4F and G). One possible mechanism is that p13 reduction decreases the sensitivity of complex I to parkinsonian toxicants. It remains unclear why 80–90% knockdown of p13 in SH‐SY5Y cells had no effect on complex I activity under basal conditions. We found that, in contrast to the heart, there were no significant differences in complex I activity in the brain among p13 −/−, p13 +/− and p13 +/+ mice (Fig EV6I and J). These results suggest that the importance of p13 function may differ between cell types.
The decreased expression levels of p13 mRNA caused by parkinsonian toxicants were comparable to those of p13 shRNA; however, shRNA‐mediated p13 knockdown but not parkinsonian toxicant‐mediated decreased p13 expression protected mitochondrial function against these stresses. The response to decreased p13 expression by parkinsonian toxicants may be too late to exert protective effects. Indeed, rotenone rapidly decreased ΔΨm 2 h after treatment (Fig EV5E), but did not alter p13 mRNA levels under the same conditions (Fig EV5F). Considering that mitochondria change their functions early upon stimulation and then promote neurodegeneration, performing p13 knockdown in advance is suggested to be necessary to realize the protective effects of p13 reduction in preventing PD.
In conclusion, we demonstrated that the targeted knockdown of the new mitochondrial protein p13 prevents mitochondrial dysfunction and dopaminergic neuronal death in both in vitro and in vivo PD models. Our findings should help to explain the molecular pathogenesis of PD. Further studies are needed to propose a new PD therapeutic that targets p13.
Materials and Methods
Cell culture
Human neuroblastoma SH‐SY5Y cells were cultured in Dulbecco's modified Eagle's medium (Nissui, Tokyo, Japan) supplemented with 10% foetal bovine serum and 4 mM l‐glutamine at 37°C in a humidified atmosphere of 5% CO2. Lenti‐X 293T cells (Clontech, Mountain View, CA, USA) were maintained in Dulbecco's modified Eagle's medium for lentivirus production.
Lentiviral vectors
Recombinant lentivirus was prepared as described previously 44. To generate lentiviral vectors expressing mouse p13, mouse cDNA (NP_079639) was amplified via PCR and subcloned into the plasmid CSII‐EF‐MCS (a generous gift from Dr. Kazuki Nagayasu at Kyoto University). For knockdown experiments, we used a MISSION shRNA construct targeting human p13 (TRCN0000163507, Sigma‐Aldrich, St Louis, MO, USA), a non‐targeted shRNA control (SHC002, Sigma‐Aldrich), another shRNA (p13 shRNA #2) targeting another sequence of p13 (TRCN0000159440, Sigma‐Aldrich) and an shRNA construct targeting human PINK1 (TRCN0000199193, Sigma‐Aldrich). For rescue experiments, mouse p13 cDNA was subcloned into the MISSION shRNA construct. SH‐SY5Y cells were infected with lentiviral vectors at a multiplicity of infection of approximately 20 for overexpression experiments or 40 for knockdown experiments.
Immunocytochemistry
Cells were fixed for 15 min in 4% paraformaldehyde in phosphate‐buffered saline (PBS). Permeabilization was performed for 10 min in 0.2% Triton X‐100. The cells were blocked for 1 h in 1% bovine serum albumin (BSA, Nacalai Tesque, Kyoto, Japan) in PBS. The cells were then probed with the primary antibodies against p13 (1:250, HPA045663, Atlas Antibodies, Stockholm, Sweden), Hsp60 (1:250, sc‐1052, Santa Cruz Biotechnology, Santa Cruz, CA, USA) and complex I proteins (1:500, ab109798, Abcam, Cambridge, UK) overnight at 4°C. Donkey anti‐rabbit IgG Alexa Fluor 594 (1:1,000, A‐21207, Thermo Fisher Scientific, Tokyo, Japan), donkey anti‐goat IgG Alexa Fluor 488 (1:1,000, A‐11055, Thermo Fisher Scientific) and donkey anti‐mouse IgG Alexa Fluor 488 (1:1,000, A‐21202, Thermo Fisher Scientific) antibodies were used as secondary antibodies. Images were acquired with a confocal microscope (FV1000‐D, Olympus, Tokyo, Japan).
Mitochondrial toxins
Parkinsonian toxicants rotenone, MPP+, MPTP and mitochondrial uncoupler CCCP were purchased from Sigma‐Aldrich.
Flow cytometry
Cells were incubated with Opti‐MEM® (Thermo Fisher Scientific) containing 200 nM TMRE (Thermo Fisher Scientific) or 200 nM MitoTracker Green FM (Thermo Fisher Scientific) for 20 min at 37°C. After trypsinization, cells were resuspended in PBS containing 0.2% BSA, and fluorescence was then detected using a BD Accuri™ C6 Flow Cytometer (BD Biosciences, San Jose, CA, USA).
Western blotting
Protein samples were resolved by SDS–PAGE and transferred to polyvinylidene fluoride membranes (Millipore, Darmstadt, Germany). After being blocked with 5% BSA in Tris‐buffered saline (TBS) containing 0.1% Tween 20, the membranes were probed with primary antibodies against p13 (1:250), cleaved PARP (1:1,000, 5625S, Cell Signaling, Danvers, MA, USA), β‐actin (1:4,000, MAB1501, Chemicon, Temecula, CA, USA), Hsp60 (1:250), Lamin A/C (1:1,000, 2032S, Cell Signaling), Tim23 (1:1,000, 611223, BD Biosciences), GAPDH (1:5,000, 2118S, Cell Signaling), Tom20 (1:1,000, 13929S, Cell Signaling), FLAG (1:1,000, 2368S, Cell Signaling), NDUFB8 (1:2,000, ab110242, Abcam), PINK1 (1:1,000, 6946S, Cell Signaling), LC3 (1:1,000, NB100‐2220, Novus Biologicals, Littleton, CO, USA) or NDUFS4 (1:1,000, EPR7831, Abcam) overnight at 4°C. After incubation with the horseradish peroxidase‐conjugated secondary antibodies against rabbit IgG (1:2,000, 55689, Cappel, Cochranville, PA, USA), mouse IgG (1:2,000, 55563, Cappel) and goat IgG (1:2,000, 55358, Cappel) for 1 h at room temperature, proteins were detected by chemiluminescence (ImmunoStar Zeta, Wako, Osaka, Japan). Data acquisition and analysis were performed using an LAS 4000 image analyser (GE Healthcare, Piscataway, NJ, USA).
TUNEL staining
TUNEL staining was performed using an In Situ Cell Death Detection Kit (Roche Diagnostics, Basel, Switzerland) according to the manufacturer's instruction. Cells were further counterstained with Hoechst. To evaluate the extent of apoptosis, we counted TUNEL‐positive cells in five fields per sample for number of TUNEL‐positive cells.
Subcellular fractionation and mitochondrial isolation
Subcellular fractionation was performed using FOCUS™ SubCell Kit (G‐Biosciences, Lt. Louis, MO, USA) according to the manufacturer's instruction. Each fraction was determined by Western blotting using the following antibodies: Lamin A/C for nuclear, Tim23 for mitochondrial and GAPDH for cytoplasmic fractions.
For digitonin treatment, blue native PAGE and TMRE staining, mitochondria were isolated according to a previously reported method 45. Briefly, cells or tissues were homogenized by a Dounce homogenizer in ice‐cold IBc buffer (10 mM Tris–MOPS, 1 mM EGTA–Tris, 0.2 M sucrose, pH 7.4). The homogenate was centrifuged at 600 g at 4°C for 10 min, and the supernatant was again centrifuged at 7,000 g at 4°C for 10 min. The precipitated pellets were washed once with IBc buffer. Protein concentration was determined with a BCA Protein Assay Kit (Thermo Fisher Scientific).
Digitonin treatment of isolated mitochondria
Isolated mitochondria were treated with 20 μg/ml proteinase K in the absence or presence of ascending concentrations of digitonin (0.01, 0.05 and 0.1%) for 10 min, and then, the protease reaction was terminated by the addition of 5 mM phenylmethylsulphonyl fluoride. The mitochondrial extracts were subjected to Western blotting using the following antibodies: p13, Tom20 for the outer mitochondrial membrane, Tim23 for the inner mitochondrial membrane and Hsp60 for the mitochondrial matrix.
Complex I activity assay
Complex I activity was assayed using a complex I enzyme activity microplate assay kit (Abcam). Cell pellets or brain tissues were lysed according to the manufacturer's protocol. A measure of 250 μg protein of each sample was added to each well of the microplate that was pre‐coated with anti‐complex I antibody, and the microplate was incubated for 3 h at room temperature. After the incubation, complex I activity was determined by monitoring the oxidation of NADH to NAD+, coupled to the reporter dye, which leads to increased absorbance at 450 nm. Absorbance was measured by an iMark microplate reader (Bio‐Rad, Hercules, CA, USA). The activity was expressed as the change in absorbance per minute.
Co‐immunoprecipitation
For the detection of binding between p13 and complex I proteins, SH‐SY5Y cells and brains were lysed with a buffer containing 50 mM Tris–HCl (pH 8.0), 100 mM NaCl, 5 mM EDTA, 1% NP‐40 and 10 mM NaF. Lysates were incubated with an anti‐complex I immunocapture antibody (1:500, Abcam) and protein G‐Sepharose (GE Healthcare) overnight at 4°C. Immunocomplexes were washed five times with the buffer, separated by SDS–PAGE and subjected to Western blotting.
Analysis of complex I assembly by blue native PAGE
Mitochondrial proteins (150 μg) were separated on a 3–12% gradient blue native PAGE gel according to the method previously reported 46. After electrophoresis, the complexes were subjected to Western blotting with an antibody against NDUFB8 for complex I.
Animals
C57BL/6J mice (SLC, Hamamatsu, Japan) were used in this study. Mice were maintained on a 12‐h light–dark cycle (lights on at 8:00 a.m.) at a controlled room temperature (22 ± 1°C). Water and food (CMF, Oriental Yeast, Osaka, Japan) were available ad libitum. All animal care and handling procedures were approved by the Animal Care and Use Committee of Osaka University. All efforts were made to minimize the number of animals used.
MPTP administration and rotarod test
Mice were subcutaneously administered with MPTP (10 mg/kg) four times at 2‐h intervals. Motor performance was assessed by the rotarod test 24 h after the first administration of MPTP, as described previously 37, 47, 48. The rotarod (Neuroscience Inc., Tokyo, Japan) consisted of a rotating rod (2.8 cm diameter) and individual compartments for each mouse. Briefly, mice were trained for 3 days prior to MPTP administration in an acceleration mode (2–16 rpm) for over 120 s. The training was repeated at a fixed speed (16 rpm) until the mice were able to stay on the rod for at least 600 s. Motor coordination was measured at a speed of 16 rpm for a maximum recording time of 600 s. Mice were tried twice on 1 day with an interval time of 30 min, and average latency to fall was measured.
Immunohistochemistry
Mice were sacrificed 72 h after the first MPTP administration. Tissue preparation was performed as described previously 49. Postfixed mouse brains were cut into 20‐μm sections containing the substantia nigra (−3.00 to −3.26 mm with respect to bregma) or the striatum (+0.80 through +0.54 mm with respect to bregma) using a cryostat (Leica Biosystems, Tokyo, Japan). Sections were incubated for 30 min in 0.3% hydrogen peroxide in PBS and then blocked with 1% normal goat serum (Vectastain ABC HRP kit; Vector Laboratories, Burlingame, CA, USA) in PBS for 1 h at room temperature. The sections were incubated with the antibody against TH (1:1,000, AB152, Millipore) in PBS containing 1% normal goat serum and 0.1% Triton X‐100 overnight at 4°C. Subsequently, sections were incubated in a secondary antibody solution containing biotinylated anti‐rabbit IgG (1:125, Vectastain ABC HRP kit; Vector Laboratories) in PBS for 30 min at room temperature and then reacted with the avidin–biotin peroxidase complex (1:125, Vectastain ABC HRP kit; Vector Laboratories) in PBS for 30 min at room temperature. Visualization was performed using a DAB substrate kit (Nichirei Corporation, Tokyo, Japan) according to the manufacturer's protocol. Penetration was conducted with ethanol (95 and 100%) and xylene. Sections were also counterstained by Nissl staining. Images were acquired with a microscope (BZ‐9000, Keyence, Osaka, Japan). The total number of TH+ neurons in every fourth section of the substantia nigra was counted stereologically with Stereo Investigator software (MBF Bioscience, Williston, VT, USA) using the fractionator method.
TMRE staining in isolated mitochondria from mice
Isolated mitochondria from the mouse midbrain were stained with TMRE as described previously 50. Briefly, isolated mitochondria (75 μg) were incubated with EB buffer (125 mM KCl, 10 mM Tris–MOPS, 5 mM glutamate, 2.5 mM malate, 1 mM K phosphate and 10 mM EGTA–Tris, pH 7.4) containing 1 μM TMRE for 10 min at room temperature. The homogenate was centrifuged at 10,000 g at 4°C for 5 min. The precipitated pellets were resuspended with the EB buffer, and fluorescence was then detected using a Spectramax M5e (Molecular Devices, Sunnyvale, CA, USA).
Real‐time RT–PCR
Total RNA was isolated using QIAzol Lysis Reagent (QIAGEN, Tokyo, Japan) according to the manufacturer's protocol. Reverse transcription of total RNA (1 μg) and real‐time RT–PCR were performed as described previously 51. Real‐time RT–PCR was conducted with GoTaq qPCR Master Mix (Promega, Madison, WI, USA). The primer sequences were as follows:
Human p13_forward, 5′‐AAGGCTTTCCGTGCACATCGG‐3′
Human p13_reverse, 5′‐CAGCCCTTCCCTCCAGGCTGAT‐3′
Human β‐actin_forward, 5′‐CATGTGCAAGGCCGGCTTCG‐3′
Human β‐actin_reverse, 5′‐CTGGGTCATCTTCTCGCGGT‐3′
Human PINK1_forward, 5′‐GCCATCAAGATGATGTGGAAC‐3′
Human PINK1_forward, 5′‐GACCAGCTCCTGGCTCATT‐3′
Human ND1_forward, 5′‐CACCTCTAGCCTAGCCGTTT‐3′
Human ND1_reverse, 5′‐CCGATCAGGGCGTAGTTTGA‐3′
Human ND2_forward, 5′‐CTTAAACTCCAGCACCACGAC‐3′
Human ND2_reverse, 5′‐AGCTTGTTTCAGGTGCGAGA‐3′
Human ND3_forward, 5′‐CCGCGTCCCTTTCTCCATAA‐3′
Human ND3_reverse, 5′‐AGGGCTCATGGTAGGGGTAA‐3′
Human ND4_forward, 5′‐ACAACACAATGGGGCTCACT‐3′
Human ND4_reverse, 5′‐CCGGTAATGATGTCGGGGTT‐3′
Human ND4L_forward, 5′‐TCGCTCACACCTCATATCCTC‐3′
Human ND4L_reverse, 5′‐AGGCGGCAAAGACTAGTATGG‐3′
Human ND5_forward, 5′‐TCCATTGTCGCATCCACCTT‐3′
Human ND5_reverse, 5′‐GGTTGTTTGGGTTGTGGCTC‐3′
Human ND6_forward, 5′‐GGGTTGAGGTCTTGGTGAGT‐3′
Human ND6_reverse, 5′‐ACCAATCCTACCTCCATCGC‐3′
Human CYTB_forward, 5′‐TCTTGCACGAAACGGGATCA‐3′
Human CYTB_reverse, 5′‐CGAGGGCGTCTTTGATTGTG‐3′
Human COX1_forward, 5′‐TCCTTATTCGAGCCGAGCTG‐3′
Human COX1_reverse, 5′‐ACAAATGCATGGGCTGTGAC‐3′
Human COX2_forward, 5′‐AACCAAACCACTTTCACCGC‐3′
Human COX2_reverse, 5′‐CGATGGGCATGAAACTGTGG‐3′
Human ATP6_forward, 5′‐TTCGCTTCATTCATTGCCCC‐3′
Human ATP6_reverse, 5′‐GGGTGGTGATTAGTCGGTTGT‐3′
Human ATP8_forward, 5′‐ACTACCACCTACCTCCCTCAC‐3′
Human ATP8_reverse, 5′‐GGCAATGAATGAAGCGAACAGA‐3′
Mouse p13_forward, 5′‐AAGGCTTTCCGTGCACATCGG‐3′
Mouse p13_reverse, 5′‐CAGCCCTTCCCTCCAGGCTGAC‐3′
Mouse β‐actin_forward, 5′‐ACCCACACTGTGCCCATCTA‐3′
Mouse β‐actin_reverse, 5′‐GCCACAGGATTCCATACCCA‐3′
LDH assay
LDH levels released from damaged cells were measured using a cytotoxicity detection kit (Roche Diagnostics) according to the manufacturer's protocol. The culture medium of the cells was incubated with the reaction mixture at room temperature for 30 min. Signals at wavelengths of 490 and 620 nm were measured by spectrophotometry.
In situ hybridization
In situ hybridization analysis was performed on sagittal brain sections as described previously 52. Complementary DNA fragments encoding mouse p13 cDNA (NP_079639) were used as templates to synthesize [35S] CTP‐labelled cRNA probes.
CRISPR/Cas9‐based knockout of p13 in mice
p13 knockout mice were generated using the CRISPR/Cas9 system. The sgRNA sequences 5′‐GACAGAAAAATGGCGGCCCT‐3′ and 5′‐CGCTACCTGAACGCGGCCAC‐3′ targeting exon 1 of the mouse p13 gene were cloned into pX330 (Addgene, Cambridge, MA, USA). pCAG‐EGxxFP was used to examine the efficiency of the target DNA cleavage by the gRNAs and Cas9 53. The pX330 plasmids containing each sgRNA sequence were injected into the pronuclear stage eggs. Mice that harboured a 71‐bp deletion in exon 1 of the p13 gene were obtained. The genotypes of all mice were analysed by PCR for a mutated p13 locus using the following primers:
Genotyping primer p13_forward, 5′‐CACCTTCCCTTGCTCTCCTG‐3′
Genotyping primer p13_ reverse, 5′‐GAGACCCTCTATCACCTGCG‐3′
Data analysis and statistics
Statistical analysis was performed using Statview (SAS Institute Japan Ltd., Tokyo, Japan), and significant differences were determined by Student's t‐test, Dunnett's test and the Tukey–Kramer test. The threshold for statistical significance was defined as P < 0.05.
Author contributions
NI, SO, KI, SH and YS performed experiments. NI, SO and AI generated p13‐deficient mice. KB, HM and HF assessed p13 mRNA levels in autopsied brain tissues. NI, SO, AK, TN, YA, AH‐T, KS, NS and HH analysed the data. AK, TN, HM, YA, AH‐T, KS, NS and HH provided guidance and/or senior supervision. NI, AK, TN, NS and HH wrote the manuscript. NI and SO prepared the figures under supervision from AK, TN, NS and HH. All authors provided input and corrections to the preparation of the manuscript and figures.
Conflict of interest
The authors declare that they have no conflict of interest.
Supporting information
Expanded View Figures PDF
Review Process File
Acknowledgements
We thank NPO Biotechnology Research and Development for technical assistance. We are grateful to Dr. Koji Okamoto (Osaka University) for helpful discussions. This work was supported in part by the Japan Society for the Promotion of Science (JSPS) KAKENHI grant numbers JP25670038 (NS), JP17H03989 (HH), JP17K19488 (HH) and JP26293020 (HH); Project MEET, Osaka University Graduate School of Medicine (NS); Mitsubishi Tanabe Pharma Corporation (NS); the JSPS Program for Advancing Strategic International Networks to Accelerate the Circulation of Talented Researchers, grant number S2603 (HH); the SRPBS and Brain/MINDS from AMED (HH); JSPS Research Fellowships for Young Scientists, grant number JP15J06322 (NI); and grants for research from the Uehara Memorial Foundation, Japan (NS).
See also: JS Valadas & P Verstreken (March 2018)
Contributor Information
Norihito Shintani, Email: shintani@phs.osaka-u.ac.jp.
Hitoshi Hashimoto, Email: hasimoto@phs.osaka-u.ac.jp.
References
- 1. Berg D, Postuma RB, Bloem B, Chan P, Dubois B, Gasser T, Goetz CG, Halliday GM, Hardy J, Lang AE et al (2014) Time to redefine PD? Introductory statement of the MDS Task Force on the definition of Parkinson's disease. Mov Disord 29: 454–462 [DOI] [PMC free article] [PubMed] [Google Scholar]
- 2. Postuma RB, Berg D, Stern M, Poewe W, Olanow CW, Oertel W, Obeso J, Marek K, Litvan I, Lang AE et al (2015) MDS clinical diagnostic criteria for Parkinson's disease. Mov Disord 30: 1591–1601 [DOI] [PubMed] [Google Scholar]
- 3. Jenner P (2008) Molecular mechanisms of L‐DOPA‐induced dyskinesia. Nat Rev Neurosci 9: 665–677 [DOI] [PubMed] [Google Scholar]
- 4. Athauda D, Foltynie T (2015) The ongoing pursuit of neuroprotective therapies in Parkinson disease. Nat Rev Neurol 11: 25–40 [DOI] [PubMed] [Google Scholar]
- 5. Kalia LV, Kalia SK, Lang AE (2015) Disease‐modifying strategies for Parkinson's disease. Mov Disord 30: 1442–1450 [DOI] [PubMed] [Google Scholar]
- 6. Choong CJ, Baba K, Mochizuki H (2016) Gene therapy for neurological disorders. Expert Opin Biol Ther 16: 143–159 [DOI] [PubMed] [Google Scholar]
- 7. Ryan BJ, Hoek S, Fon EA, Wade‐Martins R (2015) Mitochondrial dysfunction and mitophagy in Parkinson's: from familial to sporadic disease. Trends Biochem Sci 40: 200–210 [DOI] [PubMed] [Google Scholar]
- 8. Schon EA, Przedborski S (2011) Mitochondria: the next (neurode)generation. Neuron 70: 1033–1053 [DOI] [PMC free article] [PubMed] [Google Scholar]
- 9. Exner N, Lutz AK, Haass C, Winklhofer KF (2012) Mitochondrial dysfunction in Parkinson's disease: molecular mechanisms and pathophysiological consequences. EMBO J 31: 3038–3062 [DOI] [PMC free article] [PubMed] [Google Scholar]
- 10. Choong CJ, Mochizuki H (2017) Gene therapy targeting mitochondrial pathway in Parkinson's disease. J Neural Transm 124: 193–207 [DOI] [PubMed] [Google Scholar]
- 11. Hattori N, Ikebe S, Tanaka M, Ozawa T, Mizuno Y (1993) Immunohistochemical studies on complexes I, II, III, and IV of mitochondria in Parkinson's disease. Adv Neurol 60: 292–296 [PubMed] [Google Scholar]
- 12. Mizuno Y, Ohta S, Tanaka M, Takamiya S, Suzuki K, Sato T, Oya H, Ozawa T, Kagawa Y (1989) Deficiencies in complex I subunits of the respiratory chain in Parkinson's disease. Biochem Biophys Res Commun 163: 1450–1455 [DOI] [PubMed] [Google Scholar]
- 13. Schapira AH, Cooper JM, Dexter D, Clark JB, Jenner P, Marsden CD (1990) Mitochondrial complex I deficiency in Parkinson's disease. J Neurochem 54: 823–827 [DOI] [PubMed] [Google Scholar]
- 14. Betarbet R, Sherer TB, MacKenzie G, Garcia‐Osuna M, Panov AV, Greenamyre JT (2000) Chronic systemic pesticide exposure reproduces features of Parkinson's disease. Nat Neurosci 3: 1301–1306 [DOI] [PubMed] [Google Scholar]
- 15. Dauer W, Przedborski S (2003) Parkinson's disease: mechanisms and models. Neuron 39: 889–909 [DOI] [PubMed] [Google Scholar]
- 16. Porras G, Li Q, Bezard E (2012) Modeling Parkinson's disease in primates: the MPTP model. Cold Spring Harb Perspect Med 2: a009308 [DOI] [PMC free article] [PubMed] [Google Scholar]
- 17. Manfredi G (2006) mtDNA clock runs out for dopaminergic neurons. Nat Genet 38: 507–508 [DOI] [PubMed] [Google Scholar]
- 18. Schapira AH (2008) Mitochondria in the aetiology and pathogenesis of Parkinson's disease. Lancet Neurol 7: 97–109 [DOI] [PubMed] [Google Scholar]
- 19. Martinez‐Vicente M (2017) Neuronal mitophagy in neurodegenerative diseases. Front Mol Neurosci 10: 64 [DOI] [PMC free article] [PubMed] [Google Scholar]
- 20. Pickrell AM, Youle RJ (2015) The roles of PINK1, parkin, and mitochondrial fidelity in Parkinson's disease. Neuron 85: 257–273 [DOI] [PMC free article] [PubMed] [Google Scholar]
- 21. Higashi S, Katagi K, Shintani N, Ikeda K, Sugimoto Y, Tsuchiya S, Inoue N, Tanaka S, Koumoto M, Kasai A et al (2015) p13 overexpression in pancreatic beta‐cells ameliorates type 2 diabetes in high‐fat‐fed mice. Biochem Biophys Res Commun 461: 612–617 [DOI] [PubMed] [Google Scholar]
- 22. Lin MT, Beal MF (2006) Mitochondrial dysfunction and oxidative stress in neurodegenerative diseases. Nature 443: 787–795 [DOI] [PubMed] [Google Scholar]
- 23. Ott M, Gogvadze V, Orrenius S, Zhivotovsky B (2007) Mitochondria, oxidative stress and cell death. Apoptosis 12: 913–922 [DOI] [PubMed] [Google Scholar]
- 24. Floyd BJ, Wilkerson EM, Veling MT, Minogue CE, Xia C, Beebe ET, Wrobel RL, Cho H, Kremer LS, Alston CL et al (2016) Mitochondrial protein interaction mapping identifies regulators of respiratory chain function. Mol Cell 63: 621–632 [DOI] [PMC free article] [PubMed] [Google Scholar]
- 25. Han S, Udeshi ND, Deerinck TJ, Svinkina T, Ellisman MH, Carr SA, Ting AY (2017) Proximity biotinylation as a method for mapping proteins associated with mtDNA in living cells. Cell Chem Biol 24: 404–414 [DOI] [PMC free article] [PubMed] [Google Scholar]
- 26. Galluzzi L, Blomgren K, Kroemer G (2009) Mitochondrial membrane permeabilization in neuronal injury. Nat Rev Neurosci 10: 481–494 [DOI] [PubMed] [Google Scholar]
- 27. Kroemer G, Galluzzi L, Brenner C (2007) Mitochondrial membrane permeabilization in cell death. Physiol Rev 87: 99–163 [DOI] [PubMed] [Google Scholar]
- 28. Yamano K, Matsuda N, Tanaka K (2016) The ubiquitin signal and autophagy: an orchestrated dance leading to mitochondrial degradation. EMBO Rep 17: 300–316 [DOI] [PMC free article] [PubMed] [Google Scholar]
- 29. Matsuda N, Sato S, Shiba K, Okatsu K, Saisho K, Gautier CA, Sou YS, Saiki S, Kawajiri S, Sato F et al (2010) PINK1 stabilized by mitochondrial depolarization recruits Parkin to damaged mitochondria and activates latent Parkin for mitophagy. J Cell Biol 189: 211–221 [DOI] [PMC free article] [PubMed] [Google Scholar]
- 30. Narendra DP, Jin SM, Tanaka A, Suen DF, Gautier CA, Shen J, Cookson MR, Youle RJ (2010) PINK1 is selectively stabilized on impaired mitochondria to activate Parkin. PLoS Biol 8: e1000298 [DOI] [PMC free article] [PubMed] [Google Scholar]
- 31. Kazlauskaite A, Martinez‐Torres RJ, Wilkie S, Kumar A, Peltier J, Gonzalez A, Johnson C, Zhang J, Hope AG, Peggie M et al (2015) Binding to serine 65‐phosphorylated ubiquitin primes Parkin for optimal PINK1‐dependent phosphorylation and activation. EMBO Rep 16: 939–954 [DOI] [PMC free article] [PubMed] [Google Scholar]
- 32. Narendra D, Tanaka A, Suen DF, Youle RJ (2008) Parkin is recruited selectively to impaired mitochondria and promotes their autophagy. J Cell Biol 183: 795–803 [DOI] [PMC free article] [PubMed] [Google Scholar]
- 33. Twig G, Elorza A, Molina AJ, Mohamed H, Wikstrom JD, Walzer G, Stiles L, Haigh SE, Katz S, Las G et al (2008) Fission and selective fusion govern mitochondrial segregation and elimination by autophagy. EMBO J 27: 433–446 [DOI] [PMC free article] [PubMed] [Google Scholar]
- 34. Kabeya Y, Mizushima N, Ueno T, Yamamoto A, Kirisako T, Noda T, Kominami E, Ohsumi Y, Yoshimori T (2000) LC3, a mammalian homologue of yeast Apg8p, is localized in autophagosome membranes after processing. EMBO J 19: 5720–5728 [DOI] [PMC free article] [PubMed] [Google Scholar]
- 35. Wu F, Xu HD, Guan JJ, Hou YS, Gu JH, Zhen XC, Qin ZH (2015) Rotenone impairs autophagic flux and lysosomal functions in Parkinson's disease. Neuroscience 284: 900–911 [DOI] [PubMed] [Google Scholar]
- 36. Zheng B, Liao Z, Locascio JJ, Lesniak KA, Roderick SS, Watt ML, Eklund AC, Zhang‐James Y, Kim PD, Hauser MA et al (2010) PGC‐1alpha, a potential therapeutic target for early intervention in Parkinson's disease. Sci Transl Med 2: 52ra73 [DOI] [PMC free article] [PubMed] [Google Scholar]
- 37. Kawasaki T, Ishihara K, Ago Y, Baba A, Matsuda T (2007) Edaravone (3‐methyl‐1‐phenyl‐2‐pyrazolin‐5‐one), a radical scavenger, prevents 1‐methyl‐4‐phenyl‐1,2,3,6‐tetrahydropyridine‐induced neurotoxicity in the substantia nigra but not the striatum. J Pharmacol Exp Ther 322: 274–281 [DOI] [PubMed] [Google Scholar]
- 38. Andreux PA, Houtkooper RH, Auwerx J (2013) Pharmacological approaches to restore mitochondrial function. Nat Rev Drug Discov 12: 465–483 [DOI] [PMC free article] [PubMed] [Google Scholar]
- 39. Jin H, Kanthasamy A, Ghosh A, Anantharam V, Kalyanaraman B, Kanthasamy AG (2014) Mitochondria‐targeted antioxidants for treatment of Parkinson's disease: preclinical and clinical outcomes. Biochim Biophys Acta 1842: 1282–1294 [DOI] [PMC free article] [PubMed] [Google Scholar]
- 40. Yasuda T, Hayakawa H, Nihira T, Ren YR, Nakata Y, Nagai M, Hattori N, Miyake K, Takada M, Shimada T et al (2011) Parkin‐mediated protection of dopaminergic neurons in a chronic MPTP‐minipump mouse model of Parkinson disease. J Neuropathol Exp Neurol 70: 686–697 [DOI] [PubMed] [Google Scholar]
- 41. Hasegawa K, Yasuda T, Shiraishi C, Fujiwara K, Przedborski S, Mochizuki H, Yoshikawa K (2016) Promotion of mitochondrial biogenesis by necdin protects neurons against mitochondrial insults. Nat Commun 7: 10943 [DOI] [PMC free article] [PubMed] [Google Scholar]
- 42. Mudo G, Makela J, Di Liberto V, Tselykh TV, Olivieri M, Piepponen P, Eriksson O, Malkia A, Bonomo A, Kairisalo M et al (2012) Transgenic expression and activation of PGC‐1alpha protect dopaminergic neurons in the MPTP mouse model of Parkinson's disease. Cell Mol Life Sci 69: 1153–1165 [DOI] [PMC free article] [PubMed] [Google Scholar]
- 43. Angerer H (2015) Eukaryotic LYR proteins interact with mitochondrial protein complexes. Biology 4: 133–150 [DOI] [PMC free article] [PubMed] [Google Scholar]
- 44. Hashimoto R, Nakazawa T, Tsurusaki Y, Yasuda Y, Nagayasu K, Matsumura K, Kawashima H, Yamamori H, Fujimoto M, Ohi K et al (2016) Whole‐exome sequencing and neurite outgrowth analysis in autism spectrum disorder. J Hum Genet 61: 199–206 [DOI] [PMC free article] [PubMed] [Google Scholar]
- 45. Frezza C, Cipolat S, Scorrano L (2007) Organelle isolation: functional mitochondria from mouse liver, muscle and cultured fibroblasts. Nat Protoc 2: 287–295 [DOI] [PubMed] [Google Scholar]
- 46. Jha P, Wang X, Auwerx J (2016) Analysis of mitochondrial respiratory chain supercomplexes using blue native polyacrylamide gel electrophoresis (BN‐PAGE). Curr Protoc Mouse Biol 6: 1–14 [DOI] [PMC free article] [PubMed] [Google Scholar]
- 47. Ago Y, Kawasaki T, Nashida T, Ota Y, Cong Y, Kitamoto M, Takahashi T, Takuma K, Matsuda T (2011) SEA0400, a specific Na+/Ca2+ exchange inhibitor, prevents dopaminergic neurotoxicity in an MPTP mouse model of Parkinson's disease. Neuropharmacology 61: 1441–1451 [DOI] [PubMed] [Google Scholar]
- 48. Kawasaki T, Ago Y, Kitao T, Nashida T, Takagi A, Takuma K, Matsuda T (2008) A neuroprotective agent, T‐817MA (1‐{3‐[2‐(1‐benzothiophen‐5‐yl)ethoxy]propyl} azetidin‐3‐ol maleate), prevents 1‐methyl‐4‐phenyl‐1,2,3,6‐tetrahydropyridine‐induced neurotoxicity in mice. Neuropharmacology 55: 654–660 [DOI] [PubMed] [Google Scholar]
- 49. Seiriki K, Kasai A, Kuwaki T, Nakazawa T, Yamaguchi S, Hashimoto H (2016) Critical involvement of the orbitofrontal cortex in hyperlocomotion induced by NMDA receptor blockade in mice. Biochem Biophys Res Commun 480: 558–563 [DOI] [PubMed] [Google Scholar]
- 50. Lampl T, Crum JA, Davis TA, Milligan C, Del Gaizo Moore V (2015) Isolation and functional analysis of mitochondria from cultured cells and mouse tissue. J Vis Exp 97: e52076 [DOI] [PMC free article] [PubMed] [Google Scholar]
- 51. Yamasaki A, Kasai A, Toi A, Kurita M, Kimoto S, Hayata‐Takano A, Nakazawa T, Nagayasu K, Shintani N, Hashimoto R et al (2015) Identification of the role of bone morphogenetic protein (BMP) and transforming growth factor‐beta (TGF‐beta) signaling in the trajectory of serotonergic differentiation in a rapid assay in mouse embryonic stem cells in vitro . J Neurochem 132: 418–428 [DOI] [PubMed] [Google Scholar]
- 52. Hashimoto H, Nogi H, Mori K, Ohishi H, Shigemoto R, Yamamoto K, Matsuda T, Mizuno N, Nagata S, Baba A (1996) Distribution of the mRNA for a pituitary adenylate cyclase‐activating polypeptide receptor in the rat brain: an in situ hybridization study. J Comp Neurol 371: 567–577 [DOI] [PubMed] [Google Scholar]
- 53. Mashiko D, Fujihara Y, Satouh Y, Miyata H, Isotani A, Ikawa M (2013) Generation of mutant mice by pronuclear injection of circular plasmid expressing Cas9 and single guided RNA. Sci Rep 3: 3355 [DOI] [PMC free article] [PubMed] [Google Scholar]
Associated Data
This section collects any data citations, data availability statements, or supplementary materials included in this article.
Supplementary Materials
Expanded View Figures PDF
Review Process File


