

Abstract
Aberrant centrosome organisation with ensuing alterations of microtubule nucleation capacity enables tumour cells to proliferate and invade despite increased genomic instability. CEP192 is a key factor in the initiation process of centrosome duplication and in the control of centrosome microtubule nucleation. However, regulatory means of CEP192 have remained unknown. Here, we report that FBXL13, a binding determinant of SCF (SKP1‐CUL1‐F‐box)‐family E3 ubiquitin ligases, is enriched at centrosomes and interacts with the centrosomal proteins Centrin‐2, Centrin‐3, CEP152 and CEP192. Among these, CEP192 is specifically targeted for proteasomal degradation by FBXL13. Accordingly, induced FBXL13 expression downregulates centrosomal γ‐tubulin and disrupts centrosomal microtubule arrays. In addition, depletion of FBXL13 induces high levels of CEP192 and γ‐tubulin at the centrosomes with the consequence of defects in cell motility. Together, we characterise FBXL13 as a novel regulator of microtubule nucleation activity and highlight a role in promoting cell motility with potential tumour‐promoting implications.
Keywords: centrosome, CEP192, F‐box protein, FBXL13, ubiquitin
Subject Categories: Cell Adhesion, Polarity & Cytoskeleton; Cell Cycle; Post-translational Modifications, Proteolysis & Proteomics
Introduction
F‐box proteins are the substrate‐recruiting components of SCF (SKP1‐CUL1‐F‐box)‐type multi‐subunit E3 ubiquitin ligases comprising a family of about ~69 members 1, 2. All F‐box proteins share the common F‐box domain that mediates the interaction with SKP1, which in turn recruits CUL1, the core SCF scaffold, and RBX1. RBX1 is a ring finger containing protein that binds to an E2 enzyme charged with a ubiquitin molecule. The charged ubiquitin molecule is successively transferred to target substrates selected by the variable F‐box subunit. According to the type of protein–protein interaction domain, three subfamilies of F‐box proteins have been identified in the human genome: FBXWs (containing WD40 repeats), FBXLs (containing leucine‐rich repeats, LRR) and FBXOs (containing other interacting motifs) 3.
F‐box proteins are crucial regulators of centrosome functions 4. Centrosomes are the microtubule‐organising centres (MTOC) of animal cells. They consist of a pair of orthogonally arranged centrioles embedded in pericentriolar matrix (PCM), which is the main microtubule‐organising component of the centrosome. Here, microtubule nucleation is achieved by γ‐tubulin, which together with five GCPs (γ‐tubulin complex proteins) and NEDD1 form the γ‐TuRC (γ‐tubulin ring complex). The γ‐TuRC nucleates microtubule assembly by serving as a template for α‐ and β‐tubulin protofilaments 5, 6. Over the course of the cell cycle, the PCM expands and contracts to mediate a reorganisation of cellular cytoskeleton in preparation of mitosis. To ensure the formation of bipolar mitotic spindles and the correct organisation of cellular cytoskeleton, centrosomes need to be duplicated exactly once every cell cycle. This is achieved by restricting the activity of PLK4, a master regulator of centrosome duplication, through ubiquitin‐mediated proteolysis via the F‐box protein β‐TrCP 7. The centrosomal protein CEP192, in conjunction with CEP152, allows the correct recruitment of PLK4 to the mother centriole to initiate duplication. Notably, the centrosomal localisation of CEP152 depends on CEP192 during this process 8, 9, 10.
In addition to a role for CEP192 in controlling centrosome duplication, CEP192 promotes PCM expansion to allow for the formation of the mitotic spindle 11, 12. Here, CEP192 recruits PLK1 and Aurora A to the centrosome in a cooperative fashion, resulting in their activation 13, 14. The loss of CEP192 results in reduced γ‐tubulin recruitment to the centrosome and defective spindle formation 11, 12, 13, 15. CEP192 has also been shown to recruit γ‐tubulin to the interphase centrosome, contributing to the regulation of cytoskeleton organisation, although this pathway is less well defined 16. CEP192 has a crucial role both in centrosome duplication and in organisation of the microtubule cytoskeleton; however, how CEP192 levels are controlled is unknown. Here, we identify a novel antagonist of CEP192 function in interphase centrosome regulation, namely FBXL13 (F‐box and leucine‐rich repeat protein 13).
Starting from an unbiased proteome‐wide association approach, we identified Centrin‐2, Centrin‐3, CEP152 and CEP192 as FBXL13 interacting proteins. We demonstrate that FBXL13 specifically binds to CEP192 isoform 3 (CEP192‐3) and reduces centrosomal CEP192 protein levels through ubiquitin‐mediated proteolysis. Functionally, we observe that induced expression of FBXL13 significantly reduces the formation of centrosome microtubule arrays by negatively regulating the interphase recruitment of γ‐tubulin to the centrosomes. These alterations in centrosome physiology correspond to increased cell motility in cells expressing high levels of FBXL13. In summary, we provide evidence that FBXL13 functions as a novel regulator of centrosome homeostasis and maintains the steady‐state microtubule nucleation capacity from centrosomes by regulating CEP192 levels.
Results
FBXL13 interacts specifically with Centrin‐2, Centrin‐3, CEP152 and CEP192 and localises to the centrosomes
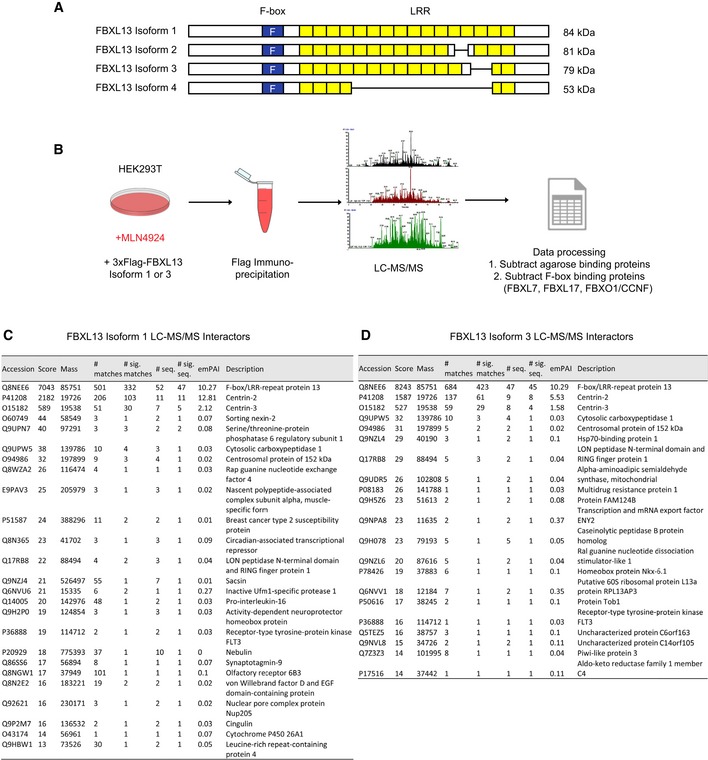
FBXL13 contains two recognisable domains in its amino acid sequence: an F‐box domain and a leucine zipper (a putative substrate interacting domain). Four isoforms of FBXL13 have been deposited in the Uniprot database. The isoforms differ in the leucine zipper and are summarised in Fig 1A. FBXL13 isoforms 1 and 3 (FBXL13‐1 and FBXL13‐3), the two isoforms described when starting this study, were used to identify the putative biological functions and substrates of FBXL13. Both isoforms (FBXL13‐1 and FBXL13‐3) and their interacting proteins were immunoprecipitated from HEK293T cells treated with the NAE (NEDD8‐activating enzyme) inhibitor MLN4924 17. This treatment blocks cullin neddylation required for the activity of SCF ubiquitin ligases 18. Liquid chromatography tandem mass spectrometry (LC‐MS/MS) of the immunoprecipitated material identified peptides corresponding to components of the SCF (SKP1 and CUL1) complex for both FBXL13 isoforms, indicating that FBXL13 forms a complete and functional SCF ubiquitin ligase.
Figure 1. Identification of FBXL13 interactors using mass spectrometry.
-
AScheme representing FBXL13 isoform 1 and 3. The F‐box domain is highlighted in blue and leucine‐rich repeats (LRR) in yellow.
-
BStrategy of liquid chromatography tandem mass spectrometry (LC‐MS/MS). Flag‐tagged FBXL13 was overexpressed and immunopurified from HEK293T cells treated with MLN4924 (2 μM). Candidate interactors were processed by subtracting agarose‐binding proteins available from the Contaminant Repository of Affinity Purification, and common interactors with three other F‐box proteins (FBXL7, FBXL17 and FBXO1/CCNF).
-
C, DThe table represents the FBXL13 isoform 1 interactors (C) or the FBXL13 isoform 3 interactors (D) identified from 3xFlag‐tagged FBXL13 immunoprecipitation experiments followed by liquid chromatography–mass spectrometry (LC‐MS/MS). Results were scored according to probability‐based Mowse score of −10*Log(P), where P is the probability that the matched peptide is a random event, and the exponentially modified protein abundance index (emPAI).
To identify interacting proteins that are specific and unique to FBXL13, we processed our LC‐MS/MS data in two steps. Firstly, agarose‐binding proteins were subtracted from our data to remove false positives. Using the Contaminant Repository for Affinity Purification v1.1 19, 30 individual datasets were downloaded for HEK293T whole‐cell extract affinity purified with Flag M2 agarose beads. These 30 datasets comprised 2,850 unique agarose‐binding proteins, which were used as a negative control. Secondly, our LC‐MS/MS data were filtered against three other F‐box LC‐MS/MS datasets performed previously 20, 21, 22. Specific interacting proteins unique to FBXL13‐1 and FBXL13‐3 were 25 and 21, respectively (Fig 1B, C and D). Notably, these candidates share ~30% overlap, a difference that likely arises from the variable carboxyl‐terminal region of the FBXL13 isoforms. FBXL13‐1 and FBXL13‐3 datasets were enriched in centrosomal proteins, including two previously identified proteins, Centrin‐2 and Centrin‐3 23, as well as a novel interactor, CEP152.
We thought to confirm the specificity of the interaction between FBXL13 and CEP152. Indeed, after immunoprecipitation of CEP152, FBXL13 was detected in CEP152 immunoprecipitates (Fig 2A). Notably, CEP152 forms a biochemical and functional complex with CEP192 8, 9, 10, 24, 25. We therefore tested whether FBXL13 also binds to CEP192 and found profound interaction between the two proteins (Fig 2B). To confirm that the interaction was specific, we included the F‐box proteins SKP2, FBXL2 and FBXL3 as controls. Only FBXL13‐1 and FBXL13‐3 were able to immunoprecipitate endogenous CEP192 as well as Centrin‐2 and Centrin‐3 (Fig 2B). In a complimentary approach, endogenous FBXL13 was detected in CEP192 immunoprecipitates (Fig 2C, lane 2). The validity of the FBXL13 antibody for immunoprecipitation and Western blot was confirmed by comparing endogenous FBXL13 in CEP192‐immunoprecipitated material to exogenously expressed FBXL13 (Fig 2C, lane 3). Importantly, endogenous immunoprecipitation of FBXL13 confirmed binding to endogenous CEP192, further supporting the biological relevance of the interaction (Fig 2D).
Figure 2. FBXL13 interacts specifically with CEP152, CEP192, Centrin‐2 and Centrin‐3 and localises at the centrosome.
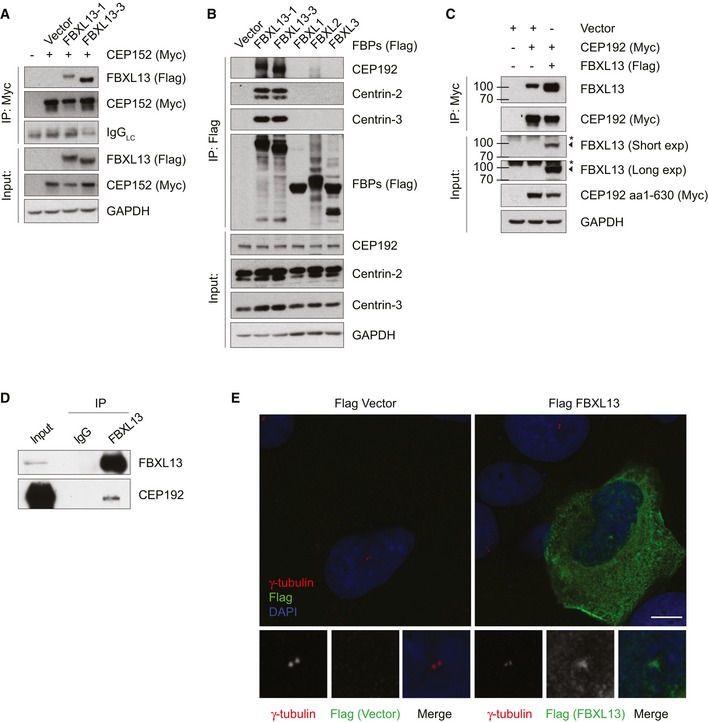
- Detection of Flag‐tagged FBXL13‐1 or FBXL13‐3 binding to immunoprecipitated Myc‐tagged CEP152 in HEK293T cells. An empty vector (Vector) was used as a negative control.
- Detection of CEP192, Centrin‐2 and Centrin‐3 after immunoprecipitation of the indicated Flag‐tagged F‐box proteins (FBPs) in HEK293T cells. An empty vector (Vector) was used as a negative control.
- Detection of endogenous FBXL13 binding to immunoprecipitated Myc‐tagged CEP192 (aa 1–630) in U2OS cells. An empty vector (Vector) was used as a negative control, and Flag‐tagged FBXL13‐1 was used as a positive control. The asterisk marks a non‐specific band, FBXL13 is marked by an arrowhead.
- Detection of endogenous CEP192 binding to immunoprecipitated endogenous FBXL13 in HEK293T cells. Normal rabbit IgG antibody was used as a negative control.
- Representative images of U2OS cells transfected with Flag‐FBXL13 or an empty vector control (Flag Vector). Cells were fixed with methanol and stained for γ‐tubulin (red), FBXL13 (Flag, green) and DNA (DAPI, blue). Scale bar, 10 μm.
Given the substantial enrichment of centrosomal proteins in FBXL13 immunoprecipitates, we speculated that FBXL13 localises to the centrosomes in cells. Indeed, immunofluorescence staining of cells expressing FBXL13 revealed that FBXL13 is diffusely localised in the cytoplasm with a clear enrichment at centrosomes (Fig 2E).
FBXL13 interacts directly with CEP192 isoform 3
The data presented above demonstrate that FBXL13 can interact with both CEP152 and CEP192. We therefore sought to investigate whether FBXL13 binds to CEP152 and CEP192 independently or in complex.
Mapping analysis using deletion mutants revealed that FBXL13 interacts with an amino‐terminal region of CEP192 (aa 1–630; Fig 3A and B). This region has been recently identified as an amino‐terminal extension of CEP192, specific to CEP192 isoform 3 (CEP192‐3) and dispensable for CEP152 interaction 8. Using the same strategy as for CEP192, we narrowed down the region of interaction between FBXL13 and CEP152 to a central region of CEP152 between amino acid 221 and 1,319, which corresponds to the region of interaction between CEP152 and CEP192 (Fig 3C and D) 8. Therefore, we speculated that FBXL13 could recruit CEP152 indirectly through CEP192. To investigate this possibility, we measured the interaction between FBXL13 and CEP152 after depletion of CEP192. Indeed, RNAi‐mediated depletion of CEP192 abrogated the interaction between FBXL13 and CEP152, whereas depletion of CEP152 did not influence the binding of CEP192 to FBXL13 (Fig 3E and F). Furthermore, using reticulocyte lysate transcribed CEP192 and FBXL13 purified from insect cells, we reconstituted the complex between FBXL13 and CEP192 in vitro, demonstrating that the interaction is direct and does not require secondary modifications (Fig 3G). In summary, FBXL13 directly binds to CEP192 through interaction with CEP192 at amino acid 1–630, which in turn recruits CEP152 via the centriole binding region located between amino acid 221 and 1,319 (Fig 3H).
Figure 3. FBXL13 interacts directly with CEP192 isoform 3.
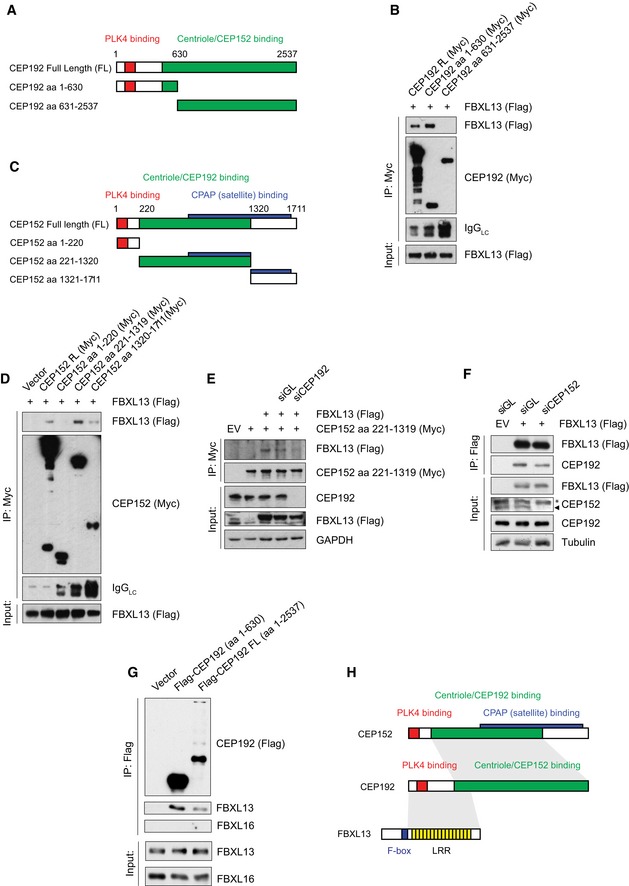
- Scheme of the CEP192 full‐length (FL) protein and truncation mutants. The coloured regions show the PLK4 binding region (red) and the centriole and CEP152 binding region (green).
- Detection of Flag‐FBXL13 binding to immunoprecipitated Myc‐tagged CEP192 truncation mutants. HEK293T cells were co‐transfected with Flag‐FBXL13 and CEP192 full length (FL) or two truncation mutants (aa 1–630 and aa 631–2,537) as indicated.
- Scheme of CEP152 full‐length (FL) protein and truncation mutants. The coloured regions show the PLK4 binding region (red), the centriole and CEP192 binding region (green) and the CPAP binding region (blue).
- Detection of Flag‐FBXL13 binding to immunoprecipitated Myc‐tagged CEP152 truncation mutants. HEK293T cells were co‐transfected with Flag‐FBXL13 and CEP152 full length (FL) or three truncation mutants (aa 1–220, aa 221–1,319 and aa 1,320–1,711) as indicated.
- Detection of FBXL13 (Flag) binding to immunoprecipitated Myc‐tagged CEP152 (aa 221–1,319) from U2OS cells, either in the presence of a non‐targeting siRNA (siGL) or an siRNA against CEP192 (siCEP192).
- Detection of endogenous CEP192 binding to immunoprecipitated Flag‐tagged FBXL13 from HEK293T cells, either in the presence of a non‐targeting siRNA (siGL) or an siRNA against CEP152 (siCEP152). The asterisk marks a non‐specific band, CEP152 is marked by an arrowhead.
- Detection of purified FBXL13 binding to immunoprecipitated Flag‐tagged CEP192 (FL and aa 1–602) assessed by an in vitro binding assay. FBXL16 binding was used as a negative control. CEP192 constructs were synthesised in vitro using a T7‐coupled reticulocyte lysate. FBXL13 and FBXL16 were expressed and purified from insect cells.
- Scheme summarising the interactions between FBXL13, CEP192 and CEP152.
FBXL13 targets CEP192 isoform 3 but not Centrin‐2 and Centrin‐3 for degradation
To investigate the functional significance of the binding between FBXL13 and Centrin‐2, Centrin‐3 and CEP192‐3, we mapped the region of interaction of Centrin‐2, Centrin‐3 and CEP192 on FBXL13. Deletion mapping analysis showed that the F‐box and carboxy‐terminus of FBXL13 are dispensable for Centrin‐2 and Centrin‐3 binding, whereas the amino‐terminus of FBXL13 is essential (Fig 4A). Conversely, we found that the carboxy‐terminus of FBXL13 is essential for CEP192 binding, whereas the F‐box and amino‐terminus are dispensable (Fig 4A). The typical substrate‐targeting region of FBXLs resides in the carboxy‐terminus of F‐box proteins within the leucine‐rich repeat that mediates specific protein–protein interactions as seen for FBXL17 21, 22. Given the distinct mode of interaction of FBXL13 to Centrin‐2, Centrin‐3 and CEP192‐3 (summarised in Fig 4B), it is conceivable that only CEP192‐3 is a ubiquitylation substrate of FBXL13.
Figure 4. FBXL13 targets CEP192 isoform 3, but not Centrin‐2 or Centrin‐3 for ubiquitin‐mediated proteolysis.
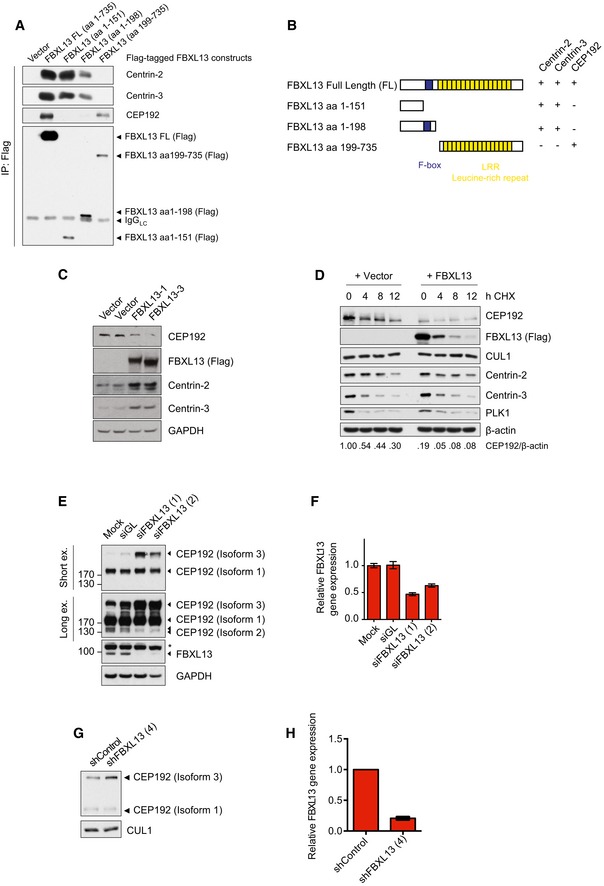
- Detection of endogenous Centrin‐2, Centrin‐3 and CEP192 binding to immunoprecipitated Flag‐tagged FBXL13 FL (FL, full length) and fragments from HEK293T cells. An empty vector (Vector) was used as a negative control.
- Scheme of FBXL13 full length (FL) and truncation mutants. The F‐box domain is highlighted in blue. The ability of each mutant to bind to Centrin‐2, Centrin‐3 and CEP192 is summarised on the right.
- Protein levels of endogenous CEP192, Centrin‐2 and Centrin‐3 in HEK293T cells transfected with FBXL13 isoform 1 (FBXL13‐1), FBXL13 isoform 3 (FBXL13‐3) or an empty vector (Vector) control. GAPDH was used as a loading control.
- Protein levels of endogenous CEP192, Centrin‐2 and Centrin‐3 levels in U2OS cells following cycloheximide (CHX) treatment and overexpression of FBXL13 or an empty vector (Vector) control. CUL1 and PLK1 were measured as negative and positive controls for the CHX treatment, respectively. β‐Actin was used as a loading control. Protein band intensities were measured using ImageJ. The ratio of CEP192 to β‐actin was calculated and normalised to protein levels at time point 0 h CHX of the vector control.
- Detection of endogenous CEP192 protein levels following FBXL13 depletion by siRNA. U2OS cells were either mock transfected (Mock) or transfected either with siRNAs targeting Luciferase (siGL) or two siRNAs targeting FBXL13 (1 and 2). Two exposures of CEP192 are shown (Short ex. and Long ex.). GAPDH was used as a loading control. The asterisk marks a non‐specific band, FBXL13 is marked by an arrowhead.
- Quantification of FBXL13 mRNA levels measured by qPCR from experiment depicted in (E) (mean ± SD from three qPCR triplicates).
- Detection of CEP192 protein levels following FBXL13 depletion by shRNA. U2OS cells were transiently transfected with expression vectors for control shRNA or shRNA targeting FBXL13. Following 48 h, cells were harvested and protein levels were analysed by Western blot. CUL1 was used as a loading control.
- Quantification of FBXL13 mRNA levels measured by qPCR from experiment depicted in (G) (mean ± SD from three qPCR triplicates).
To investigate this hypothesis, we measured how alterations of FBXL13 levels affect Centrin‐2, Centrin‐3 and CEP192 protein levels. Upon FBXL13 overexpression, we observed increased Centrin‐2 and Centrin‐3 but reduced CEP192 levels (Fig 4C). The effects of both FBXL13 isoforms were comparable (Fig 4C). The effects observed on CEP192 were not due to indirect cell cycle effects as cell cycle profiles of HEK293T cells were unaffected by FBXL13 overexpression (Fig EV1A). The CEP192 reduction, observed upon FBXL13 expression, was rescued by treating cells with a proteasome inhibitor (MG132), indicating that FBXL13 induces CEP192 degradation through the proteasome (Fig EV1B). Furthermore, increased expression of FBXL13 did not affect the half‐life of Centrin‐2 and Centrin‐3, but substantially reduced CEP192 levels in cycloheximide chase experiments (Fig 4D).
Figure EV1. Impact of FBXL13 on cell cycle distribution and CEP192 expression levels.
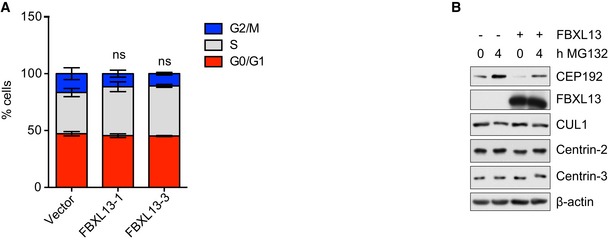
- Quantification of cell cycle profile of HEK293T cells as determined by fluorescence‐activated cell sorting (FACS) using propidium iodide staining. HEK293T cells were transfected with FBXL13 isoform 1 (FBXL13‐1) or FBXL13 isoform 3 (FBXL13‐3). An empty vector (Vector) was used as a negative control (mean ± SD from three independent experiments; ns, non‐significant P > 0.05). The statistical method used was a one‐sample, unpaired Student's t‐test with a hypothetical means of 1.0 between G2/M populations of the treatment conditions compared to control.
- Detection of CEP192, Centrin‐2, Centrin‐3 and CUL1 after expression of FBXL13 in the presence or absence of MG‐132. β‐actin was used as a loading control.
To exclude the possibility that the regulation of CEP192 is due to spurious effects resulting from high FBXL13 expression, we measured CEP192 levels after siRNA‐mediated FBXL13 knockdown using two distinct oligos. Upon FBXL13 downregulation as measured by qPCR and Western blot, we detected increased levels of CEP192 isoform 3 (CEP192‐3), but not CEP192 isoforms 1 or 2 (Fig 4E and F). The antibody against CEP192 detects a common region in the three CEP192 isoforms, and all three CEP192 bands could be depleted by CEP192 siRNA, thus confirming that the higher band detected by Western blot corresponded to the longest isoform of CEP192 (Fig EV2A and B). Accumulation of CEP192‐3 was also observed after depletion of FBXL13 using shRNA (Fig 4G and H). Since the isoform 3 of CEP192 is the only form containing the region of interaction required to recruit FBXL13, the stabilisation of CEP192 upon FBXL13 knockdown is in accordance with the mode of interaction of FBXL13 to CEP192‐3. We further narrowed the site of interaction between FBXL13 and CEP192 to a fragment spanning amino acids 1–602 (Fig EV2C).
Figure EV2. CEP192 isoform specification and FBXL13‐CEP192 interaction mapping.
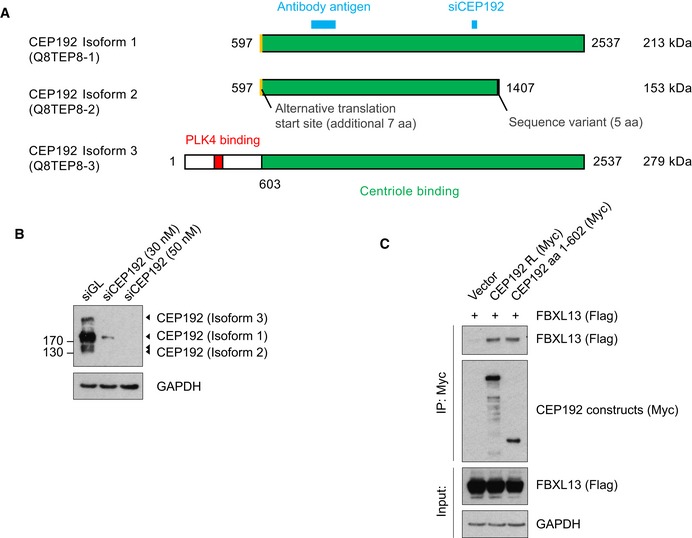
- CEP192 (Uniprot ID: Q8TEP8) has three isoforms. The PLK4 binding region is shown in red and the centriole binding region in green. The two shorter isoforms (1 and 2) are generated through an alternative translation start site reported by Sonnen et al 8, shown in yellow. CEP192 isoform 2 also contains a sequence variant of 5 amino acids at its C‐terminus. The antibody used in this study recognises the antigen shown in blue. The siCEP192 sequence used in this study targets all three isoforms and is also shown in blue.
- CEP192 protein levels in U2OS cells following transfection with a non‐targeting siRNA control (siGL) or an siRNA targeting CEP192.
- Detection of Flag‐FBXL13 binding to immunoprecipitated Myc‐tagged CEP192 full length (FL) or a truncation mutant (aa 1–602) specific to CEP192‐3. CEP192 and FBXL13 were co‐transfected in HEK293T cells as indicated.
SCFFBXL13 polyubiquitylates CEP192 isoform 3
To confirm that CEP192 is a bona fide ubiquitylation substrate of FBXL13, we measured CEP192 (aa 1–630) polyubiquitylation in U2OS cells, in which FBXL13 was depleted by RNAi. Remarkably, CEP192 polyubiquitylation was completely abolished by depleting FBXL13 using two different siRNA oligos (Fig 5A and B). We performed the same ubiquitylation assay on CEP192‐3 after shRNA‐mediated depletion of FBXL13 under denaturing conditions. Again, CEP192‐3 ubiquitylation was abolished, demonstrating that the ubiquitin signal was not due to FBXL13 auto‐ubiquitylation (Fig 5C). To further confirm that the polyubiquitylation of CEP192 was directly mediated by FBXL13, we measured CEP192 (aa 1–630) ubiquitylation using an FBXL13 mutant lacking the F‐box domain (this mutant can interact with CEP192, but not with SKP1; Fig 5D). Indeed, expression of exogenous FBXL13 wild type (WT) promoted CEP192 polyubiquitylation relative to the FBXL13 mutant lacking the F‐box (FBXL13 ∆F‐box; Fig 5E). This shows that the formation of a functional SCFFBXL13 complex is required for efficient CEP192‐3 polyubiquitylation.
Figure 5. SCFFBXL 13 polyubiquitylates CEP192 isoform 3.
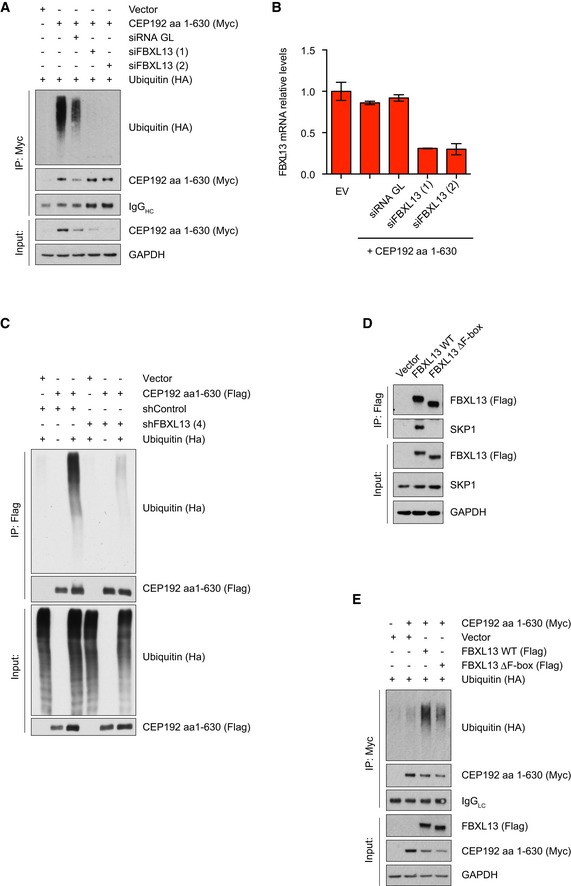
- Detection of polyubiquitylated Myc‐tagged CEP192 (aa 1–630) following immunoprecipitation from U2OS cells. Cells were co‐transfected with HA‐tagged ubiquitin and either a non‐targeting siRNA (siGL) or two siRNAs against FBXL13 (1) and (2). An empty vector (Vector) was used as a negative control.
- Relative FBXL13 mRNA levels in U2OS samples collected in (A) measured by qPCR, following depletion with either a non‐targeting siRNA (siGL) or two siRNAs against FBXL13 (1) and (2) (mean ± SD from three qPCR triplicates).
- Detection of polyubiquitylated Flag‐tagged CEP192 (aa 1–630) following immunoprecipitation from HEK293T cells under denaturing conditions. Cells were co‐transfected with HA‐tagged ubiquitin and either a scrambled or FBXL13 shRNA.
- Detection of SKP1 binding to immunoprecipitated Flag‐tagged FBXL13 wild type (WT) or a mutant lacking the F‐box (FBXL13 ∆F‐box) from HEK293T cells. An empty vector (Vector) was used as a negative control.
- Detection of polyubiquitylated Myc‐tagged CEP192 (aa 1–630) following immunoprecipitation from HEK293T cells. Cells were co‐transfected with HA‐tagged ubiquitin either in the presence of FBXL13 wild type (WT) or a mutant lacking the F‐box (∆F‐box). An empty vector (Vector) was used as a negative control.
FBXL13 downregulates centrosomal CEP192 and γ‐tubulin
To further investigate the biological role of FBXL13‐dependent CEP192 ubiquitin‐mediated proteolysis, we assessed whether FBXL13 acts on the centrosomal or cytoplasmic pool of CEP192. Using quantification of confocal fluorescence microscopy as previously performed for other centrosomal proteins 26, we observed that centrosomal CEP192 levels were significantly reduced in cells overexpressing FBXL13 (Fig 6A and B). It should be noted that the CEP192 antibody used for immunofluorescence recognises all three isoforms of CEP192 27, and that the relative contributions of each CEP192 isoform to the total fluorescence intensity cannot be distinguished.
Figure 6. FBXL13 downregulates centrosomal CEP192, γ‐tubulin and microtubule arrays.
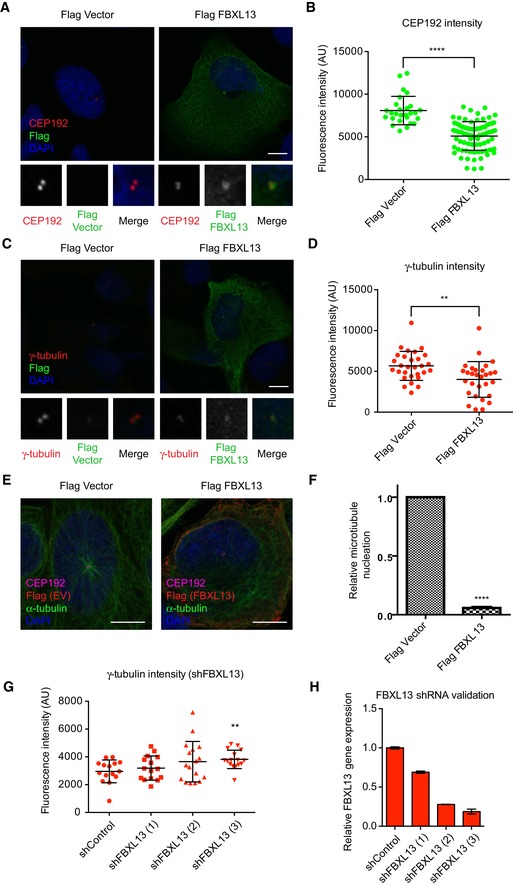
- Representative images of U2OS cells transfected with Flag‐FBXL13 or an empty vector control (Flag Vector), fixed with methanol and stained for CEP192 (red), FBXL13 (Flag, green) and DNA (DAPI, blue). Scale bar, 10 μm.
- Quantified CEP192 fluorescence intensity associated with the centrosomes following FBXL13 overexpression in the samples represented in (A) (mean ± SD from n > 30 cells per condition, experiments were performed in triplicate; ****P ≤ 0.0001) (Mann‐Whitney test non‐parametric).
- Representative images of U2OS cells transfected with Flag‐FBXL13 or an empty vector control (Flag Vector), fixed with methanol and stained for γ‐tubulin (red), FBXL13 (Flag, green) and DNA (DAPI, blue). Scale bar, 10 μm.
- Quantified γ‐tubulin fluorescence intensity associated with the centrosomes following FBXL13 overexpression in the samples represented in (C) (mean ± SD from n > 30 cells per condition, experiments were performed in triplicate; **P ≤ 0.01) (Mann‐Whitney test non‐parametric).
- Representative images of U2OS cells transfected with either Flag‐FBXL13 or an empty vector control. Cells were fixed with methanol and stained for FBXL13 (Flag, red), CEP192 (magenta), microtubules (α‐tubulin, green) and DNA (DAPI, blue). Scale bar, 10 μm.
- Quantification of cells with centrosomal microtubule arrays in Flag‐FBXL13 negative and positive cells. Values were normalised to empty vector transfected cells (mean ± SD from n > 200 cells per condition, experiments were performed in triplicate; ****P ≤ 0.0001) (one‐sample t‐test with hypothetical means of 1.0).
- Quantified γ‐tubulin fluorescence intensity in U2OS cells stably expressing shRNA control (shControl) or three shRNA oligos targeting FBXL13 (1, 2, 3) (mean ± SD from n > 30 cells per condition, experiments were performed in triplicate; **P ≤ 0.01) (Mann‐Whitney test non‐parametric).
- Validation of FBXL13 mRNA level using quantitative real‐time PCR (qPCR) in the samples shown in (G) (mean ± SD from three qPCR triplicates).
Due to the centrosomal localisation of FBXL13 and the clear downregulation of centrosome‐associated CEP192 levels, we decided to further investigate the potential role of FBXL13 in centrosome biology. In particular, we focused on the two important functions of CEP192: centriole duplication 8, 12 and pericentriolar matrix (PCM) organisation 11, 12, 16. Firstly, to ask whether the FBXL13‐CEP192 axis regulates centriole duplication, we measured the percentage of U2OS cells with centrosome overduplication following RNAi‐mediated FBXL13 depletion. Indeed, FBXL13 depletion induced a minor yet significant centrosome overduplication phenotype (Fig EV3A and B). This could be attributed to increased CEP192 levels at centrosomes which favours increased focal concentration of PLK4 and centrosome overduplication. Secondly, we observed that cells expressing high levels of FBXL13 have a drastic reduction of centrosomal γ‐tubulin (Fig 6C and D). CEP192 is known to recruit γ‐tubulin to both the interphase 16 and mitotic centrosomes 11, 12 to facilitate microtubule nucleation. We therefore asked whether FBXL13 impacts on microtubule nucleation from the centrosomes and indeed found that cells overexpressing FBXL13 had reduced centrosomal microtubule arrays (Fig 6E and F). Likewise, overexpression of FBXL13 significantly reduced the number of cells in which centrosomal microtubule nucleation took place after complete depletion of microtubules (Fig EV3C and D). Finally, FBXL13 depletion by shRNA corresponds to a significant increase of γ‐tubulin intensity (Fig 6G and H). These findings are consistent with the role of CEP192 in promoting microtubule nucleation at the centrosomes and suggest that FBXL13 functions as a novel regulator of interphase MTOC activity by regulating CEP192.
Figure EV3. FBXL13 regulates centrosome duplication and centrosomal microtubule nucleation.
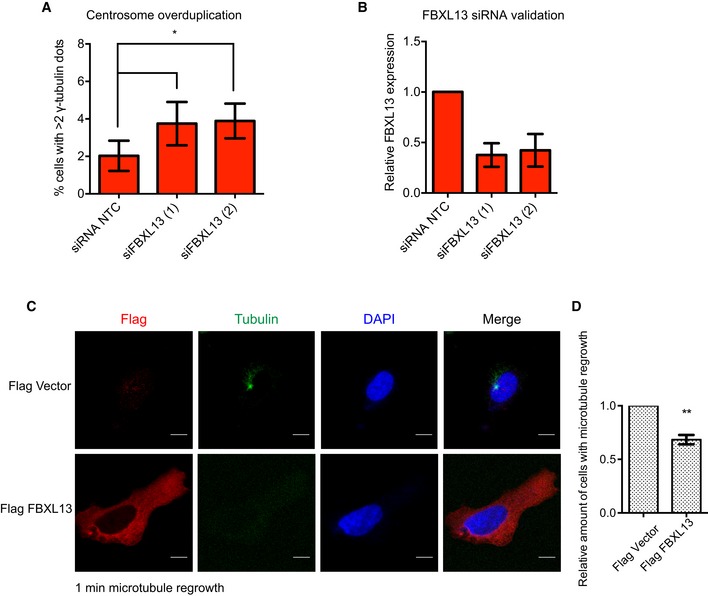
- Quantification of centrosome overduplication in U2OS cells transfected with a non‐targeting siRNA (siRNA NTC) or two siRNA oligos targeting FBXL13 (1 and 2) (mean ± SD from three independent experiments, n > 200 cells per condition; *P ≤ 0.05). Statistical analysis was performed by using one‐sample t‐test with hypothetical means of 1.0.
- Validation of FBXL13 mRNA level using quantitative real‐time PCR (qPCR) in the samples shown in (A) (mean ± SD from three qPCR triplicates).
- Microtubule regrowth assay in U2OS cells transfected with either Flag‐FBXL13 or an empty vector control. Microtubules were fully depolymerised by treating cells with 10 μM nocodazole for 2 h at 4°C. Cells were fixed 1 min after nocodazole washout and stained for Flag (red), α‐tubulin (green) and DNA (DAPI, blue). Scale bar, 10 μm.
- Quantification of cells which nucleated centrosomal microtubules after complete depolymerisation shown in (C) (mean ± SD from three independent experiments, n = 100 cells per condition and experiment, **P ≤ 0.01). Statistical analysis was performed by using one‐sample t‐test with hypothetical means of 1.0.
FBXL13 regulation of CEP192 is required for proper cell motility
Cancer cells often overduplicate their centrosomes. The overduplication of centrosomes is advantageous for cancer cells and enables them to migrate and invade 26. The capacity of migration and invasion of cancer cells with centrosome overduplication is dependent on CEP192, suggesting a role for CEP192 in the regulation of interphase microtubule organisation and cytoskeleton 26. Indeed, it has been shown that CEP192 can regulate the nucleation of centrosomal microtubule arrays in interphase, thereby modulating cell motility and invasiveness 16. Thus, we hypothesised that FBXL13 may also regulate migration of cancer cells by targeting CEP192 for proteolysis. To this end, we measured whether FBXL13 knockdown affected cell motility using a standard 2‐D in vitro scratch assay. We found that FBXL13 knockdown significantly reduces the rate at which U2OS cells move into the scratch zone (Figs 7A, B and C, and EV4A, B and C). The reduced ability of U2OS cells to migrate into the scratch zone could be rescued by expressing siRNA‐resistant FBXL13 WT but not by a mutant form of FBXL13 lacking the F‐box (ΔF‐box). Of note, even a slight overexpression of FBXL13 in the rescue experiment detailed above increased migration compared to empty vector expressing cells (Fig 7A, B and C).
Figure 7. FBXL13 depletion impairs cell motility.
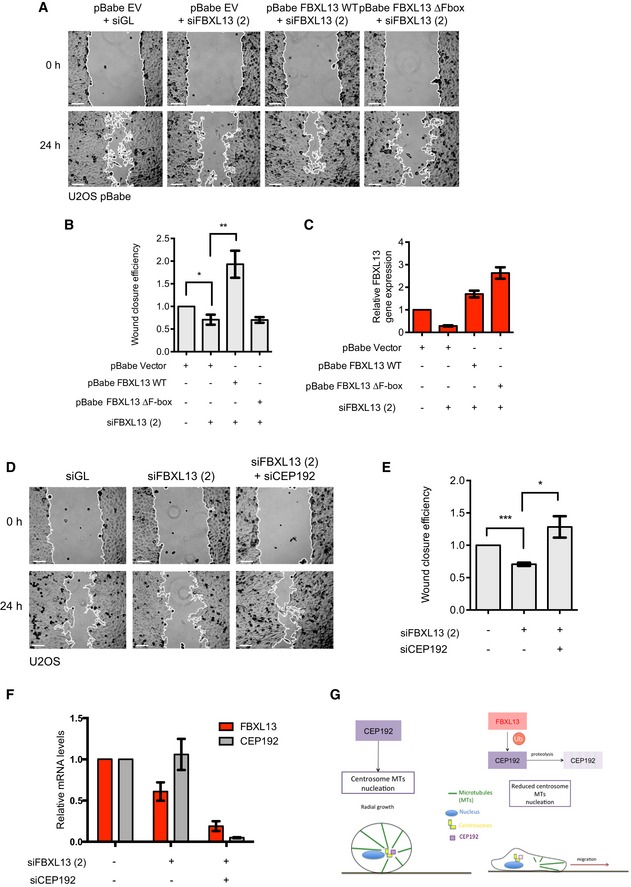
- Representative images from a wound healing assay of pBabe U2OS cells stably expressing the empty vector backbone (pBabe EV) or siRNA‐resistant FBXL13 wild type (pBabe FBXL13 WT) or FBXL13 lacking the F‐box (pBabe FBXL13 ∆F‐box). Cells were transfected with a control siRNA (siGL) or an siRNA targeting FBXL13 (2). The wound edge is shown in white. Scale bar, 100 μm.
- Quantification of wound closure efficiency shown in (A) as calculated by the percentage of wound area closed (mean ± SD, n = 6, *P ≤ 0.05, **P ≤ 0.01). Statistical analysis of relative ratios was performed by using one‐sample t‐test with hypothetical means of 1.0 and differences between groups were compared using unpaired Student's t‐test.
- Validation of FBXL13 mRNA level using quantitative real‐time PCR (qPCR) in the samples shown in (A) (mean ± SD from three qPCR triplicates).
- Representative images from a wound healing assay of U2OS cells transfected with a control siRNA (siGL) or with an siRNA targeting FBXL13 (2) alone or together with an siRNA targeting CEP192 isoform 3 (siCEP192). The wound edge is shown in white. Scale bar, 100 μm.
- Quantification of wound closure efficiency shown in (D) as calculated by the percentage of wound area closed (mean ± SD, n = 6, *P ≤ 0.05, ***P ≤ 0.001). Statistical analysis of relative ratios was performed by using one‐sample t‐test with hypothetical means of 1.0 and differences between groups were compared using unpaired Student's t‐test.
- Validation of FBXL13 and CEP192 isoform 3 mRNA levels using quantitative real‐time PCR (qPCR) in the samples shown in (D) (mean ± SD from three qPCR triplicates).
- Working model in which FBXL13 targets CEP192‐3 for ubiquitin‐mediated proteolysis, resulting in reduced γ‐tubulin recruitment to centrosomes, reduced centrosomal microtubules and increased cell motility via extracentrosomal microtubule arrays.
Figure EV4. FBXL13 depletion impairs cell migration.
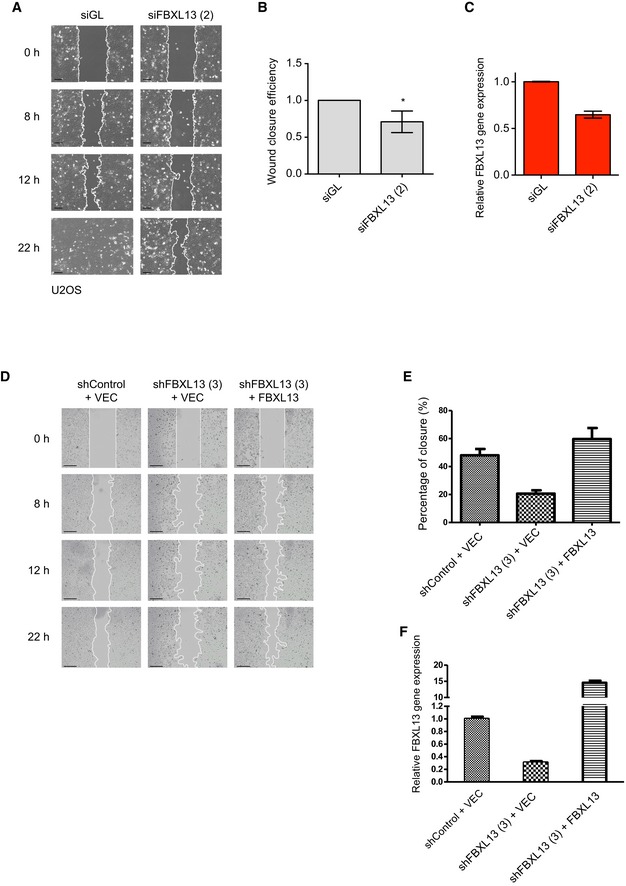
- Representative images from a wound healing assay of U2OS cells transfected with a control siRNA (siGL) or an siRNA targeting FBXL13 (2). The wound edge is shown in white. Scale bar, 100 μm.
- Quantification of wound closure efficiency shown in (A) as calculated by the percentage of wound area closed (mean ± SD from three independent experiments, n > 4 wounds per condition, *P ≤ 0.05). The statistical method used was a one‐sample, unpaired Student's t‐test with a hypothetical means of 1.0.
- Validation of FBXL13 mRNA level in the samples shown in (A) using quantitative real‐time PCR (qPCR; mean ± SD from three qPCR triplicates).
- Representative images from a wound healing assay of U2OS cells stably overexpressing pBabe FBXL13 or an empty vector control (VEC). Cells were transduced with either a lentiviral vector containing an shRNA targeting FBXL13 or a control shRNA. The wound edge is shown in white. Scale bar, 250 μm.
- Quantification of wound closure efficiency in (D) (mean ± SD from three independent experiments, n > 4 wounds per condition).
- Validation of FBXL13 mRNA level in the samples shown in (D) using quantitative real‐time PCR (qPCR) (mean ± SD from three qPCR triplicates).
To further ensure that the phenotype was not due to an off‐target effect of the siRNA, we measured cell motility subsequent to shRNA‐mediated knockdown of FBXL13. Again, depletion of FBXL13 reduced cell migration in the scratch zone while shRNA‐resistant FBXL13 expression promoted migration (Fig EV4D, E and F). Importantly, co‐depletion of CEP192‐3 rescued the impaired capability of migration seen upon FBXL13 knockdown, further giving evidence that the defect in cell motility is caused by an accumulation of CEP192 (Fig 7D, E and F). In summary, our data indicate that the ubiquitylation of CEP192 by FBXL13 is relevant to regulate the formation of centrosomal microtubule arrays. The lack of centrosomal microtubule arrays induced by FBXL13 overexpression facilitates cell migration. Conversely, depletion of FBXL13 induces accumulation of CEP192 thereby promoting the formation of centrosomal microtubule arrays at the centrosomes, which in turn favours radial cell growth and hampers cell migration (Fig 7G).
Discussion
F‐box proteins are important regulators of centrosome structure and function. Among them, Cyclin F targets CP110 for degradation to restrict centrosome duplication during the cell cycle 21. Similarly, β‐TrCP promotes the ubiquitin‐mediated proteolysis of PLK4 to restrict centrosome duplication to a single event per cell cycle 7. Against this background, we here describe the previously orphan F‐box protein FBXL13 as a novel player in centrosome physiology. We show that FBXL13 is enriched at centrosomes and interacts strongly with Centrin‐2 and Centrin‐3, two structural components of the centrosomes. However, FBXL13 does not regulate the levels of Centrin‐2 and Centrin‐3. The interaction between FBXL13 and Centrin‐2 and Centrin‐3 occurs at the amino‐terminal portion of FBXL13. We suggest that this interaction is required to localise FBXL13 to the centrosomes. However, additional studies are necessary to further detail the nature of the interaction between FBXL13 and Centrin‐2 and Centrin‐3 and to analyse the subcellular localisation of FBXL13 mutants unable to interact with Centrin‐2 and Centrin‐3.
We show that FBXL13 targets CEP192 isoform 3 for ubiquitin‐mediated proteolysis. In conjunction with CEP152, CEP192 has a crucial role in regulating centrosome duplication by promoting the correct localisation of PLK4 8. Importantly, CEP192‐3 is the only isoform that contains a PLK4 binding site. We therefore speculated that FBXL13, similarly to Cyclin F, may be required to restrict the levels of CEP192 in S phase to avoid centrosome overduplication. However, FBXL13 depletion had only minor (although reproducible) effects on centriole duplication. A possible explanation for this observation may be that FBXL13 acts on specific pools of CEP192 and that alteration of CEP192 alone is not sufficient to elicit centrosome overduplication in line with previous literature 8, 9.
CEP192 plays a central role in regulating the microtubule nucleation capacity of both the mitotic centrosome and the interphase centrosome. CEP192 recruits γ‐tubulin to the interphase centrosome, although this pathway is less well defined 16.
Interphase cells with overexpressed FBXL13 have significantly less γ‐tubulin at the centrosomes and a corresponding reduction of centrosomal microtubule arrays. Furthermore, overexpression of FBXL13 reduces the ability of cells to regrow centrosomal microtubules after complete depolymerisation. We hypothesise that the physiological function of FBXL13 is to fine‐tune CEP192 levels in order to maintain steady‐state centrosome microtubule nucleation activity. In support of this, we observed that cells overexpressing FBXL13 frequently exhibited strong morphological phenotypes, consistent with a disrupted microtubule network (data not shown). One open question is whether FBXL13 also regulates CEP192 at the mitotic centrosomes. We hypothesise that as a CEP192 antagonist, FBXL13 activity would be inhibited during centrosome maturation. Likewise, FBXL13‐CEP192 binding could be cell cycle regulated by post‐translational modifications on the ligase or substrate side or alternatively through alterations of the subcellular localisation.
Additionally, we observed that increased levels of FBXL13 in U2OS cells were associated with increased cell motility. On the contrary, we noted migration defects following FBXL13 depletion using two independent methods. We hypothesise that this is due to the inhibitory effect of ectopic FBXL13 on centrosomal microtubule arrays. In this model, FBXL13 upregulation reduces centrosomal microtubule nucleation capacity and causes hyperpolarisation, resulting in an increased ability of cells to migrate (Fig 7G). On the contrary, reduced levels of FBXL13 promote the formation of centrosomal microtubule nucleation at the cost of reduced extracentrosomal microtubules and less migration (Fig 7G).
Many lines of evidence suggest that FBXL13 gain‐of‐function is oncogenic. An online repository of cancer patient cohorts shows that FBXL13 is frequently amplified in solid tumours such as breast cancer (20%), non‐epithelial prostate cancer (20%), head and neck cancer (10%) and oesophageal cancer (10%) (cBioPortal). Furthermore, expression data from the Cancer Cell Line Encyclopedia reveal FBXL13 amplification in many cancer cell lines, many of which originate from breast cancers, glioblastomas and lung cancers 28. Finally, a recent CRISPR/Cas9 screen has shown that FBXL13 knockout downregulates proliferation in a patient‐derived glioblastoma cell line, but not in others (HeLa, RPE1, HCT116, DLD1 and A375) 29. The deregulation of centrosome microtubules has been shown to cause oncogenic aberrations in microtubule‐dependent structures and processes 30. These include signs of malignant transformation such as a loss of cell–cell adhesion, cell polarisation and overall mammosphere architecture 30. Thus, our findings provide a framework from which to further investigate the function of FBXL13 in tumours, which may provide novel insights into the role of centrosomes in cancer motility, invasion and metastatisation.
Materials and Methods
Cell culture
All cell lines were routinely cultured in a humidified incubator at 37°C under 5% CO2 in the indicated culture medium containing 10% foetal bovine serum (FBS, Sigma‐Aldrich) supplemented with 100 U/ml penicillin sodium and 100 μg/ml streptomycin sulphate (Sigma‐Aldrich).
Antibodies
The following monoclonal antibodies were used anti‐Myc (9B11, mouse, Cell Signaling Technology), anti‐HA (05‐904, mouse, Millipore and 16B12, Biolegend), anti‐GAPDH (MA5‐15738, rabbit, Sigma‐Aldrich), anti‐Cyclin B (AHF0052, Life Technologies), anti‐CUL1 (32‐2400, Thermo Fisher Scientific), anti‐PLK1 (33‐1700, Thermo Fisher Scientific), anti‐β‐actin (A1978, Sigma‐Aldrich) and anti‐Centrin‐3 (SC100933, Santa Cruz). Polyclonal antibodies used were anti‐Flag (F7425, rabbit, Sigma‐Aldrich), anti‐Centrin‐2 (SC27793, Santa Cruz), anti‐FBXL13 (OAAB12542, Aviva), anti‐FBXL16 (PA5‐21094, Thermo Fisher Scientific), phospho‐Histone H3 (06‐570, Millipore), anti‐SKP1 (sc‐7163, Santa Cruz), anti‐α/β‐tubulin (2148, Cell Signaling), anti‐CEP152 (unpurified, kind gift from Prof. Erich A. Nigg at the Biozentrum of University of Basel, Switzerland) and anti‐CEP192 (kind gift from Prof. Laurence Pelletier at the University of Toronto, Canada). Polyclonal rabbit antibody against FBXL13 used for endogenous IP was raised and purified by Innovagen (aa 111–121 and 695–707).
Plasmid and siRNA transfections
For transient plasmid transfection, HEK293T cells were seeded the previous day prior to transfection using the reagent “PEI Max”, Polyethylenimine HCl Max (Polysciences). U2OS cells were seeded the day prior to transfection using the reagent X‐tremeGENE™ HP DNA Transfection Reagent (Roche) according to the manufacturer's instructions.
For siRNA transfection, cells were transfected for 48 h using HiPerfect Transfection Reagent (Qiagen) in Opti‐MEM I Reduced Serum Medium (Thermo Fisher Scientific) according to the manufacturer's instructions. The siRNAs used were siGL (5′‐CGTACGCGGAATACTTCGA‐3′, 31), siCEP192 targeting all CEP192 isoforms (5′‐AAGGAAGACATTTTCATCTCT‐3′, 50 nM, 12), siCEP192 targeting the N‐terminal region of CEP192 isoform 3 (5′‐GCUUAAACUGCAAGUUUCAAUCAGA‐3′16), siCEP152 (5′‐GCGGATCCAACTGGAAATCTA‐3′, 32), and siFBXL13 (1) and (2) (Dharmacon OnTarget, 60 nM, 016001‐07 5′‐AAUCAUGCCUGGAUGUUGA‐3′ and 016001‐08 5′‐UCAGAUAGGCUGCAAACAA‐3′, respectively).
Lysate production, co‐immunoprecipitation and Western blotting
Cells were lysed in lysis buffer (LB) containing 50 mM Tris–HCl at pH 7.4, 1 mM EDTA, 150 mM NaCl, 5 mM MgCl2, 0.1% NP‐40, 1% glycerol. This was supplemented with the following inhibitors upon each use: 1 mM DTT, 20 mM β‐glycerophosphate, 0.1 mM PMSF, 20 nM okadaic acid and a complete protease inhibitor cocktail for mammalian extracts (Sigma) at a 1:500 dilution. Cell pellets were thoroughly resuspended in three volumes of fresh lysis buffer and incubated on ice for 10 min. Debris was removed by centrifugation at 20,000 rcf for 10 min. All immunoprecipitations involving Flag‐tagged proteins were performed as described previously 20. For co‐immunoprecipitation of Myc‐tagged proteins, anti‐Myc antibody (Cell Signaling, 9B11) was incubated with whole‐cell lysates for 2 h at 4°C on a rotator. The lysate/antibody mix was then incubated with Protein G Sepharose Beads (GE Healthcare) washed with LB for 1.5 h at 4°C. For immunoprecipitation of endogenous FBXL13, lysates were incubated with 4 μg of antibody against FBXL13 or control rabbit IgG (sc‐2027, Santa Cruz) overnight at 4°C on a rotator. Antibodies were then captured by rProtein A Sepharose Fast Flow beads (GE Healthcare) for 1 h at 4°C. The samples were then washed three times in LB and resuspended in 12 μl of 2× Laemmli buffer. Samples were boiled for 5 min at 90°C prior separation on 4–12% Novex Bis‐Tris gels (Life Technologies). Primary antibodies were diluted at 1:1,000 in blocking solution (5% non‐fat dry milk in PBS with 0.1% Tween‐20) and incubated for 1 h at room temperature. HRP‐conjugated secondary antibodies (1:1,000; Life Technologies) or HRP‐conjugated protein A/G (1:5,000; Pierce) was used for protein detection.
Liquid chromatography tandem mass spectrometry (LC‐MS/MS) analysis
LC‐MS/MS sample processing was performed as described previously 22. In brief, 3xFlag FBXL13 co‐immunopurified material was eluted by competition using Flag peptide. The eluate was subjected to two rounds of chloroform–methanol precipitation as described 33. Samples were then resuspended in 6 M urea, 100 mM ammonium acetate pH ~8 and subjected to in‐solution trypsin digestion and analysis by nano‐liquid chromatography tandem mass spectrometry using a UHPLC 3000 system (Thermo) coupled to an Orbitrap Velos mass spectrometer (Thermo) as described 34. The raw MS data were converted into Mascot generic files using MSconvert 35. Searches were performed using Mascot (Matrix Science) with the following parameters: the error tolerance was fixed at 20 ppm for precursor ions and at 0.5 Da for fragment ions. One missed trypsin cleavage was allowed. MS data were searched against the Homo sapiens UniProt‐SwissProt database (UniProt_SwissProt 20151126, Homo sapiens 20,268 sequences), in which the false discovery rate (FDR) was estimated using a decoy database approach (Mascot) and set to 1%. All MS data have been deposited and are available through the PRIDE public resource (PXD008310).
Protein turnover
Cells were transfected as indicated. Following 24 h, cells were treated with 100 μg/ml cycloheximide to inhibit further protein synthesis. Samples were collected at the indicated time points, and protein levels were detected by Western blot.
In vivo Ubiquitylation assay
HEK293T or U2OS cells were plated in 15‐cm culture dishes at 50% confluency and transfected the following day with the indicated plasmids or siRNA for 48 h. Cells were treated with 10 μM MG132 for 5 h prior to collection. Cells were lysed in LB containing 20 mM n‐ethylmaleimide (NEM). For in vivo ubiquitylation under denaturing conditions, 0.1 ml of lysate was denatured by adding 1% SDS and boiling at 95°C for 5 min. SDS was quenched with 0.9 ml LB containing 1% Triton X‐100 on ice for 15 min. Ubiquitylated Myc‐ or Flag‐tagged CEP192 was immunoprecipitated using anti‐Myc antibody and Protein G Sepharose 4 Fast Flow beads (GE Healthcare) or anti‐Flag M2 Affinity gel (Sigma‐Aldrich). Polyubiquitylated forms of CEP192 were detected by immunoblot using anti‐HA to recognise HA‐ubiquitin.
Wound healing assay
Following 48 h of siRNA transfection, U2OS cells were seeded at a density of 400,000 per 6‐well plate. When the cells reached 100% confluency 36 h after seeding, a linear wound was created using a sterilised 10‐μl tip. Cell debris around the wound was removed by washing gently with PBS, before replacing with 0.5% FBS supplemented media. Images of the wound were acquired at defined positions at the indicated time points using the EVOS FL Imaging System (Life Technologies).
The efficiency of wound closure was calculated as the area of the wound closed over time. The area of the wound was determined using the ImageJ software ecosystem Fiji 36 and the MRI Wound Healing Tool plug‐in (http://dev.mri.cnrs.fr/projects/imagej-macros/wiki/Wound_Healing_Tool).
RNA isolation, reverse transcription and real‐time quantitative PCR (RT–qPCR)
Total RNA was purified using RNeasy Mini Kit (Qiagen), and complementary DNA was synthetised from 1 μg of total RNA using Oligo(dT) primers and Superscript III reverse transcriptase (Life Technologies) following the manufacturer's specifications. Quantitative RT–PCR was performed using gene‐specific primers and SYBR® Green PCR master mix (Life Technologies) on a 7500HT Real‐time PCR System (Applied Biosystems). The primers used were FBXL13 Forward (5′‐GCACTGGCCATTTACTGCATTAACC‐3′), FBXL13 Reverse (5′‐GCTGCCTTCTTGGAAATATTTGTGC‐3′), GAPDH Forward (5′‐ATGCCTCCTGCACCACCAAC‐3′), GAPDH Reverse (5′‐GGGGCCATCCACAGTCTTCT‐3′), CEP192‐3 Forward (5′‐TCCCTCGACTCACACTCTTCT‐3′) and CEP192‐3 Reverse (5′‐TTTGGTGAGGACACTCTGCC‐3′). All samples were assayed in triplicates and normalised to GAPDH.
Generation of stable cell lines
For retrovirus production, a pBabe‐puro (Addgene, 1764) retroviral vector containing the gene of interest was co‐transfected into HEK293T with the pUMVC Gag/Pol vector (Addgene, 8449) packaging vector and pCMV‐VSV‐G (Addgene, 8454) envelope‐encoding vector. For stable shRNA cell lines, pGIPZ lentiviral transfer vectors containing a non‐targeting shRNA or three shRNAs targeting FBXL13 were provided by the Target Discovery Institute High Throughput Core (University of Oxford). Lentivirus were packaged using the pCMV‐VSV‐G (Addgene, 8454) envelope‐encoding vector and the psPAX2 (Addgene, 12260) packaging vector. For transduction, U2OS cells were seeded at 30% confluency (as retroviruses only infect S‐phase cells). Twenty‐four hours later, fresh media was added along with the virus‐containing media at a 1:1 ratio, in the presence of 8 μg/ml polybrene, and incubated for 16 h. This was followed by 3 μg/ml puromycin selection for 72 h. Expression of the protein of interest was confirmed by Western blot. Stable shRNA incorporation could be confirmed by immunofluorescence using GFP. The shRNA sequences used are shControl (5′‐TCTCGCTTGGGCGAGAGTAAG‐3′), shFBXL13 (1) (5′‐AGCAAGACATAAGAGTAAA‐3′), shFBXL13 (2) (5′‐GTTACTGATGCATCCTTCA‐3′), shFBXL13 (3) (5′‐GGATACAACAGATCATCTA‐3′) and shFBXL13 (4) (5′‐CTAAAGGAGCCTTAGAATTAA‐3′).
Immunofluorescence
Glass coverslips (Thermo Fisher Scientific) were sterilised in 100% ethanol and air‐dried in sterile conditions before depositing at the bottom of 6‐well plates. Cells were seeded directly onto the coverslips (100,000 cells per 6‐well) and transfected or drug‐treated the following day. The coverslips were then fixed 48–72 h after treatment as appropriate. Coverslips were fixed in ice‐cold 100% methanol for 5 min at −20°C and blocked using 5% BSA in PBS for 1 h. The following primary antibodies were used γ‐tubulin (T5326, Sigma; 1:5,000 and T5192, Sigma; 1:2,000), CEP192 (Prof. Laurence Pelletier; 1:300), Centrin‐3 (SC100933, Santa Cruz; 1:300), Flag (F7425 and F1804, Sigma; 1:300), α‐tubulin (T9026, Sigma‐Aldrich, 1:500) and anti‐α‐tubulin−FITC conjugated (F2168, Sigma; 1:200). Primary antibody incubation was performed overnight at 4°C. The secondary antibodies used were Alexa Flour® 488 donkey anti‐rabbit, Alexa Flour® 568 donkey anti‐rabbit, Alexa Flour® 488 donkey anti‐mouse and Alexa Flour® 568 donkey anti‐mouse (Life Technologies, 1:500). Coverslips were then mounted using ProLong Gold Anti‐fade Mountant with DAPI (Invitrogen/Life Technologies). Finally, coverslips were sealed using clear nail polish. Images were acquired on a Zeiss confocal microscope using Zen 2011 software (Carl Zeiss).
Quantification of centrosome intensity
Fluorescence intensity at centrosomes was quantified using the method outlined by 26 using ImageJ. In brief, 50 × 50 and 80 × 80 pixel regions were centred over each centrosome. The intensity of fluorescence (integrated fluorescence) was measured for each pixel region. The background fluorescence (Fbackground) was obtained by subtracting the integrated value of the smaller 50 × 50 region (FI) from the larger 80 × 80 region (FO) and normalising to the 50 × 50 area. Centrosome fluorescence intensity (FCentrosome) was then obtained by subtracting the background value (FBackground) from the total intensity of the 50 × 50 region (FI). The advantage of this approach is that the background is derived from the vicinity of the centrosome, which controls for variations in background fluorescence.
Microtubule regrowth assay
Microtubule regrowth assay was performed as described previously 37. In brief, microtubules were depolymerised completely by treating the cells with 10 μM nocodazole for 2 h at 4°C. Cells were rewarmed, and nocodazole was washed out with PBS. After 1 min, cells were fixed in ice‐cold 100% methanol for 5 min at −20°C and regrowth of microtubules was visualised by immunofluorescence staining.
Statistical analysis
Quantitative analysis of band intensity was performed using ImageJ. Data are reported as mean ± SD. Statistical analyses were performed using GraphPad Prism (GraphPad Software, Inc.). Differences between groups were compared using unpaired Student's t‐test. Statistical analysis of relative ratios was performed by using one‐sample t‐tests with hypothetical means of 1.0. Statistically insignificant results are indicated as ns for P > 0.05. Statistically significant results are indicated as * for P ≤ 0.05, ** for P ≤ 0.01, *** for P ≤ 0.001, and **** for P ≤ 0.0001.
Data availability
The mass spectrometry proteomics data have been deposited to the ProteomeXchange Consortium via the PRIDE partner repository with the dataset identifier PXD008310 and 10.6019/PXD008310 (https://www.ebi.ac.uk/pride/archive).
Author contributions
EF and CR performed most of the biochemical and cell‐biological experiments and designed experiments together with FB and VD'A. H‐BY performed and analysed formation of microtubule arrays. IS performed qPCR analysis and molecular cloning. BMK and RF performed the LC/MS analysis of FBXL13 interacting proteins. VD'A and FB coordinated the study, analysed results and oversaw all experiments. VD'A and FB wrote the manuscript. All authors discussed the results and commented on the manuscript.
Conflict of interest
The authors declare that they have no conflict of interest.
Supporting information
Expanded View Figures PDF
Review Process File
Acknowledgements
This study was possible thanks to the support of Medical Research Council (MRC) grant MC_PC_12007 to V. D'A. and grants from the European Research Commission (project BCM‐UPS) and the Deutsche Forschungsgemeinschaft (SFB 1243 and BA 2851/4‐1) to F.B. This work was further supported by a John Fell (133/075) and Wellcome Trust grant (097813/Z/11/Z) to B.M.K. and a Croucher Scholarship to E.F. We thank Prof. Erich A. Nigg for the CEP152 and CEP192 cDNA and the CEP152 antibody and Prof. Laurence Pelletier for the CEP192 antibody.
EMBO Reports (2018) 19: e44799
Contributor Information
Florian Bassermann, Email: florian.bassermann@tum.de.
Vincenzo D'Angiolella, Email: vincenzo.dangiolella@oncology.ox.ac.uk.
References
- 1. Bassermann F, Eichner R, Pagano M (2014) The ubiquitin proteasome system ‐ implications for cell cycle control and the targeted treatment of cancer. Biochim Biophys Acta 1843: 150–162 [DOI] [PMC free article] [PubMed] [Google Scholar]
- 2. Skaar JR, D'Angiolella V, Pagan JK, Pagano M (2009) SnapShot: F box proteins II. Cell 137: 1358.e1 [DOI] [PubMed] [Google Scholar]
- 3. Jin J, Cardozo T, Lovering RC, Elledge SJ, Pagano M, Harper JW (2004) Systematic analysis and nomenclature of mammalian F‐box proteins. Genes Dev 18: 2573–2580 [DOI] [PMC free article] [PubMed] [Google Scholar]
- 4. Zhang Y, Galardy PJ (2016) Ubiquitin, the centrosome, and chromosome segregation. Chromosome Res 24: 77–91 [DOI] [PubMed] [Google Scholar]
- 5. Khodjakov A, Rieder CL (1999) The sudden recruitment of γ‐tubulin to the centrosome at the onset of mitosis and its dynamic exchange throughout the cell cycle, do not require microtubules. J Cell Biol 146: 585–596 [DOI] [PMC free article] [PubMed] [Google Scholar]
- 6. Moritz M, Braunfeld MB, Sedat JW, Alberts B, Agard DA (1995) Microtubule nucleation by gamma‐tubulin‐containing rings in the centrosome. Nature 378: 638–640 [DOI] [PubMed] [Google Scholar]
- 7. Holland AJ, Lan W, Niessen S, Hoover H, Cleveland DW (2010) Polo‐like kinase 4 kinase activity limits centrosome overduplication by autoregulating its own stability. J Cell Biol 188: 191–198 [DOI] [PMC free article] [PubMed] [Google Scholar]
- 8. Sonnen KF, Gabryjonczyk A‐MM, Anselm E, Stierhof Y‐DD, Nigg EA (2013) Human Cep192 and Cep152 cooperate in Plk4 recruitment and centriole duplication. J Cell Sci 126: 3223–3233 [DOI] [PubMed] [Google Scholar]
- 9. Kim TS, Park JE, Shukla A, Choi S, Murugan RN, Lee JH, Ahn M, Rhee K, Bang JK, Kim BY et al (2013) Hierarchical recruitment of Plk4 and regulation of centriole biogenesis by two centrosomal scaffolds, Cep192 and Cep152. Proc Natl Acad Sci USA 110: E4849–4857 [DOI] [PMC free article] [PubMed] [Google Scholar]
- 10. Park SY, Park JE, Kim TS, Kim JH, Kwak MJ, Ku B, Tian L, Murugan RN, Ahn M, Komiya S et al (2014) Molecular basis for unidirectional scaffold switching of human Plk4 in centriole biogenesis. Nat Struct Mol Biol 21: 696–703 [DOI] [PMC free article] [PubMed] [Google Scholar]
- 11. Gomez‐Ferreria M, Rath U, Buster DW, Chanda SK, Caldwell JS, Rines DR, Sharp DJ (2007) Human Cep192 is required for mitotic centrosome and spindle assembly. Curr Biol 17: 1960–1966 [DOI] [PubMed] [Google Scholar]
- 12. Zhu F, Lawo S, Bird A, Pinchev D, Ralph A, Richter C, Müller‐Reichert T, Kittler R, Hyman AA, Pelletier L (2008) The mammalian SPD‐2 ortholog Cep192 regulates centrosome biogenesis. Curr Biol 18: 136–141 [DOI] [PubMed] [Google Scholar]
- 13. Joukov V, Walter JC, Nicolo A (2014) The cep192‐organized aurora a‐plk1 cascade is essential for centrosome cycle and bipolar spindle assembly. Mol Cell 55: 578–591 [DOI] [PMC free article] [PubMed] [Google Scholar]
- 14. Meng L, Park J‐E, Kim T‐S, Lee E, Park S‐Y, Zhou M, Bang JK, Lee KS (2015) Bimodal interaction of mammalian polo‐like kinase 1 and a centrosomal scaffold, Cep192, in the regulation of bipolar spindle formation. Mol Cell Biol 35: 2626–2640 [DOI] [PMC free article] [PubMed] [Google Scholar]
- 15. Gomez‐Ferreria MA, Bashkurov M, Helbig AO, Larsen B, Pawson T, Gingras A‐CC, Pelletier L (2012) Novel NEDD1 phosphorylation sites regulate γ‐tubulin binding and mitotic spindle assembly. J Cell Sci 125: 3745–3751 [DOI] [PubMed] [Google Scholar]
- 16. O'Rourke BP, Gomez‐Ferreria MA, Berk RH, Hackl AM, Nicholas MP, O'Rourke SC, Pelletier L, Sharp DJ (2014) Cep192 controls the balance of centrosome and non‐centrosomal microtubules during interphase. PLoS One 9: e101001 [DOI] [PMC free article] [PubMed] [Google Scholar]
- 17. Soucy TA, Smith PG, Milhollen MA, Berger AJ, Gavin JM, Adhikari S, Brownell JE, Burke KE, Cardin DP, Critchley S et al (2009) An inhibitor of NEDD8‐activating enzyme as a new approach to treat cancer. Nature 458: 732–736 [DOI] [PubMed] [Google Scholar]
- 18. Ohh M, Kim WY, Moslehi JJ, Chen Y, Chau V, Read MA, Kaelin WG Jr (2002) An intact NEDD8 pathway is required for Cullin‐dependent ubiquitylation in mammalian cells. EMBO Rep 3: 177–182 [DOI] [PMC free article] [PubMed] [Google Scholar]
- 19. Mellacheruvu D, Wright Z, Couzens AL, Lambert J‐PP, St‐Denis NA, Li T, Miteva YV, Hauri S, Sardiu ME, Low TY et al (2013) The CRAPome: a contaminant repository for affinity purification‐mass spectrometry data. Nat Methods 10: 730–736 [DOI] [PMC free article] [PubMed] [Google Scholar]
- 20. D'Angiolella V, Donato V, Forrester FM, Jeong YT, Pellacani C, Kudo Y, Saraf A, Florens L, Washburn MP, Pagano M (2012) Cyclin F‐mediated degradation of ribonucleotide reductase M2 controls genome integrity and DNA repair. Cell 149: 1023–1034 [DOI] [PMC free article] [PubMed] [Google Scholar]
- 21. D'Angiolella V, Donato V, Vijayakumar S, Saraf A, Florens L, Washburn MP, Dynlacht B, Pagano M (2010) SCF(Cyclin F) controls centrosome homeostasis and mitotic fidelity through CP110 degradation. Nature 466: 138–142 [DOI] [PMC free article] [PubMed] [Google Scholar]
- 22. Raducu M, Fung E, Serres S, Infante P, Barberis A, Fischer R, Bristow C, Thézénas M‐LL, Finta C, Christianson JC et al (2016) SCF (Fbxl17) ubiquitylation of Sufu regulates Hedgehog signaling and medulloblastoma development. EMBO J 35: 1400–1416 [DOI] [PMC free article] [PubMed] [Google Scholar]
- 23. Tan M‐KK, Lim H‐JJ, Bennett EJ, Shi Y, Harper JW (2013) Parallel SCF adaptor capture proteomics reveals a role for SCFFBXL17 in NRF2 activation via BACH1 repressor turnover. Mol Cell 52: 9–24 [DOI] [PMC free article] [PubMed] [Google Scholar]
- 24. Firat‐Karalar EN, Rauniyar N, Yates JR III, Stearns T (2014) Proximity interactions among centrosome components identify regulators of centriole duplication. Curr Biol 24: 664–670 [DOI] [PMC free article] [PubMed] [Google Scholar]
- 25. Gupta GD, Coyaud E, Goncalves J, Mojarad BA, Liu Y, Wu Q, Gheiratmand L, Comartin D, Tkach JM, Cheung SW et al (2015) A dynamic protein interaction landscape of the human centrosome‐cilium interface. Cell 163: 1484–1499 [DOI] [PMC free article] [PubMed] [Google Scholar]
- 26. Godinho SA, Picone R, Burute M, Dagher R, Su Y, Leung CT, Polyak K, Brugge JS, Théry M, Pellman D (2014) Oncogene‐like induction of cellular invasion from centrosome amplification. Nature 510: 167–71 [DOI] [PMC free article] [PubMed] [Google Scholar]
- 27. Gomez‐Ferreria M, Bashkurov M, Mullin M, Gingras A‐C, Pelletier L (2014) CEP192 interacts physically and functionally with the K63‐deubiquitinase CYLD to promote mitotic spindle assembly. Cell Cycle 11: 3555–3558 [DOI] [PMC free article] [PubMed] [Google Scholar]
- 28. Barretina J, Caponigro G, Stransky N, Venkatesan K, Margolin AA, Kim S, Wilson CJ, Lehár J, Kryukov GV, Sonkin D et al (2012) The Cancer Cell Line Encyclopedia enables predictive modelling of anticancer drug sensitivity. Nature 483: 603–607 [DOI] [PMC free article] [PubMed] [Google Scholar]
- 29. Hart T, Chandrashekhar M, Aregger M, Steinhart Z, Brown KR, MacLeod G, Mis M, Zimmermann M, Fradet‐Turcotte A, Sun S et al (2015) High‐resolution CRISPR screens reveal fitness genes and genotype‐specific cancer liabilities. Cell 163: 1515–1526 [DOI] [PubMed] [Google Scholar]
- 30. Schnerch D, Nigg EA (2016) Structural centrosome aberrations favor proliferation by abrogating microtubule‐dependent tissue integrity of breast epithelial mammospheres. Oncogene 35: 2711–2722 [DOI] [PMC free article] [PubMed] [Google Scholar]
- 31. Elbashir SM, Harborth J, Lendeckel W, Yalcin A, Weber K, Tuschl T (2001) Duplexes of 21‐nucleotide RNAs mediate RNA interference in cultured mammalian cells. Nature 411: 494–498 [DOI] [PubMed] [Google Scholar]
- 32. Graser S, Stierhof YD, Lavoie SB, Gassner OS, Lamla S, Le Clech M, Nigg EA (2007) Cep164, a novel centriole appendage protein required for primary cilium formation. J Cell Biol 179: 321–330 [DOI] [PMC free article] [PubMed] [Google Scholar]
- 33. Wessel D, Flügge UI (1984) A method for the quantitative recovery of protein in dilute solution in the presence of detergents and lipids. Anal Biochem 138: 141–143 [DOI] [PubMed] [Google Scholar]
- 34. Fischer R, Kessler BM (2015) Gel‐aided sample preparation (GASP)–a simplified method for gel‐assisted proteomic sample generation from protein extracts and intact cells. Proteomics 15: 1224–1229 [DOI] [PMC free article] [PubMed] [Google Scholar]
- 35. Kessner D, Chambers M, Burke R, Agus D, Mallick P (2008) ProteoWizard: open source software for rapid proteomics tools development. Bioinformatics 24: 2534–2536 [DOI] [PMC free article] [PubMed] [Google Scholar]
- 36. Schindelin J, Arganda‐Carreras I, Frise E, Kaynig V, Longair M, Pietzsch T, Preibisch S, Rueden C, Saalfeld S, Schmid B et al (2012) Fiji: an open‐source platform for biological‐image analysis. Nat Methods 9: 676–682 [DOI] [PMC free article] [PubMed] [Google Scholar]
- 37. Abal M, Piel M, Bouckson‐Castaing V, Mogensen M, Sibarita JB, Bornens M (2002) Microtubule release from the centrosome in migrating cells. J Cell Biol 159: 731–737 [DOI] [PMC free article] [PubMed] [Google Scholar]
Associated Data
This section collects any data citations, data availability statements, or supplementary materials included in this article.
Supplementary Materials
Expanded View Figures PDF
Review Process File
Data Availability Statement
The mass spectrometry proteomics data have been deposited to the ProteomeXchange Consortium via the PRIDE partner repository with the dataset identifier PXD008310 and 10.6019/PXD008310 (https://www.ebi.ac.uk/pride/archive).