

Abstract
Introduction
The purpose of this study is to investigate comorbidity status and its impact on total medical expenditures in non-institutionalized hypertensive adults in the U.S.
Methods
Data from the 2011–2014 Medical Expenditure Panel Survey were used. Patients were included if they had a diagnosis code for hypertension, were aged ≥18 years, and were not pregnant during the study period (N=26,049). The Elixhauser Comorbidity Index was modified to add hypertension-related comorbidities. The outcome variable was annual total medical expenditures, and a generalized linear model regression (gamma distribution with a log link function) was used. All costs were adjusted to 2014 U.S. dollars.
Results
Based on the modified Elixhauser Comorbidity Index, 14.0% of patients did not have any comorbidities, 23.0% had one, 24.4% had two, and 38.7% had three or more. The five most frequent comorbidities were hyperlipidemia, diabetes, rheumatoid arthritis, depression, and chronic pulmonary disease. Estimated mean annual total medical expenditures were $3,914 (95% CI= $3,456, $4,372) for those without any comorbidity; $5,798 (95% CI=$5,384, $6,213) for those with one comorbidity; $8,333 (95% CI=$7,821, $8,844) for those with two comorbidities; and $13,920 (95% CI=$13,166, $14,674) for those with three or more comorbidities. Of the 15 most frequent comorbidities, the condition with the largest impact on expenditures for an individual person was congestive heart failure ($7,380). Hypertensive adults with stroke, coronary heart disease, diabetes, renal diseases, and hyperlipidemia had expenditures that were $6,069, $6,046, $5,039, $4,974, and $4,851 higher, respectively, than those without these conditions.
Conclusions
Comorbidities are highly prevalent among hypertensive adults, and this study shows that each comorbidity significantly increases annual total medical expenditures.
INTRODUCTION
Hypertension is a highly prevalent health condition; approximately one third of U.S. adults have this problem.1 Previous studies have provided estimates of the economic burden of hypertension2–13; the American Heart Association estimated that the national annual direct and indirect costs of hypertension were $47.3 billion and $3.9 billion (average annual 2012–2013).3 Annual costs for the treatment of hypertension were estimated to be $812 per adult in 2014.14 However, most adults have been diagnosed with more than one chronic condition, and relatively few suffer from hypertension exclusively.15 Additionally, hypertension is a major risk factor for many costly chronic conditions, such as heart disease and stroke.
Multimorbidity is considered the presence of multiple diseases in an individual.16 A study found that approximately one fourth of the population had multimorbidity.17 Multimorbidity is an issue for the management of hypertension. Among elderly patients with hypertension, 43% had two or fewer coexisting chronic conditions, 34% had three to four, and 23% had five or more such conditions.15
Although earlier studies have estimated the economic burden of hypertension, little is known about the effect of having multiple comorbidities on medical expenditures in adults with hypertension. The objectives of the present study are to describe comorbidity status among non-institutionalized adults with hypertension and to estimate annual medical expenditures according to the presence of comorbidities in this population.
METHODS
Data from the 2011–2014 Medical Expenditure Panel Survey (MEPS) were used for this analysis. MEPS is a nationally representative survey of the U.S. civilian non-institutionalized population that provides comprehensive information on healthcare utilization and costs under the U.S. healthcare system. MEPS data have been used extensively for studying medical expenditures for various health conditions, including hypertension and cardiovascular disease (CVD).18–22 The MEPS data on medical conditions were used to define hypertension and comorbidities based on ICD-9 codes. The MEPS full-year consolidated data were employed to define medical expenditures and patient characteristics.
Study Population
Adults with hypertension were included if they met all of the following criteria: any diagnosis codes for hypertension (ICD-9 codes: 401–405); age ≥18 years; and were not pregnant during the study period. Among pregnant women, hypertension and gestation hypertension might affect the use and cost of medical services differently from the general population. A total of 26,049 persons were included.
Measures
Various comorbidity indices have been developed to measure important coexisting medical conditions. The Elixhauser Comorbidity Index (EI) is one of the most frequently used and validated comorbidity indices, and the original EI includes a set of 30 conditions that are coded as present or absent to produce 30 binary variables.23 In addition, the score version of the EI has also been validated.24,25 The score version of the EI was used to measure comorbidity because it is better than the original version for exploring individual comorbidity status and the impact of individual comorbidity on medical expenditures. In addition, using the score version of the EI has been validated by its ability to outperform the Charlson Comorbidity Index, the most commonly used comorbidity index.26–34
The authors expanded the EI to better analyze the impact of hypertension-related comorbidities on medical expenditures by including a broader range of CVD-related conditions than the original EI. First, 27 conditions from the original version of the EI indicators were obtained. These modifications included excluding hypertension; combining two types of diabetes (diabetes with complication and diabetes without complication) into one condition (diabetes); and combining two types of anemia (blood loss anemia and deficiency anemia) into one condition (anemia). Second, three conditions were added: coronary heart disease (CHD); stroke; and hyperlipidemia. Finally, two conditions were redefined: renal failure to renal disease, and arrhythmia to heart rhythm disorders. In sum, a total of 30 possible comorbidities were included, as follows:
CVD and hypertension-related conditions: congestive heart failure (CHF), heart rhythm disorders, valvular disease, CHD, stroke, hyperlipidemia, pulmonary circulation disorders, peripheral vascular disorders, diabetes, renal disease, obesity, and depression; and
other conditions: paralysis, neurologic disorders, hypothyroidism, liver disease, peptic ulcer, HIV/AIDS, lymphoma, metastatic cancer, solid tumor, rheumatoid arthritis, coagulopathy, weight loss, fluid and electrolyte disorders, anemia, alcohol abuse, drug abuse, psychoses, and chronic pulmonary disease.
The modified EI score was defined as the sum of each of the 30 comorbidities, with a possible range of 0–30. Depression was included in the CVD and hypertension-related conditions based on the results of previous meta-analyses on the association of hypertension with depression.35,36 Appendix Table 1 (available online) shows the list of the comorbidities and the ICD-9 code for each condition.
The outcome variable was annual total medical expenditures that were not specifically related to hypertension diagnosis or management. The expenditures included those for inpatient hospitalizations, outpatient visits, emergency department visits, office-based physician visits, home healthcare visits, and prescription medications. The annual medical expenditures included the total of all expenditures paid by all payers, including Medicare, Medicaid, other public insurance, private insurance, and payments made by the adult with hypertension or that person’s family during the calendar year. In terms of cost of illness studies, the perspective for this study was that of the healthcare sector as a whole, with expenditures used as a proxy for costs. All costs were adjusted to 2014 U.S. dollars using the personal consumption expenditure index–health by function. Ten covariates were included: age group, gender, race/ethnicity, U.S. region, insurance type, marital status, education level, poverty level, smoking status, and health status.
Statistical Analysis
Bivariate analyses were conducted to assess the associations between personal characteristics and the EI. Chi-square tests were used for the categorical variables for the population’s characteristics, and ANOVA was used for the continuous variables. Descriptive statistics were employed to describe the frequencies of comorbidities.
A generalized linear model regression (gamma distribution with a log link function) was used to estimate the associations between the modified EI and total medical expenditures while controlling for covariates. A log link and gamma distribution was selected because the distribution of medical expenditures was positively skewed, and 99% of the sample had positive medical expenditures. Mean annual medical expenditures by the EI score were predicted using the average marginal effects method from the model. All analyses were performed using SAS, version 9.3, and Stata/SE, version 14.
RESULTS
A total of 26,049 patients were included in this study. Table 1 shows the characteristics of U.S. hypertensive adults by the modified EI. The weighted average estimate of the number of U.S. hypertensive adults was 64,147,867 per year, and the weighted percentage of hypertension in the population of interest was 27.8%.
Table 1.
Sample Characteristics of U.S. Hypertensive Adults by Modified Elixhauser Comorbidity Index (EI), 2011–2014 Medical Expenditure Panel Survey (n=26,049)
| Variable/category | Number (weighted %) | p-value | ||||
|---|---|---|---|---|---|---|
| Total | EI=0 | EI=1 | EI=2 | EI≥3 | ||
| Overall | 26,049 (100.0) | 4,073 (100.0) | 6,135 (100.0) | 6,310 (100.0) | 9,531 (100.0) | |
| Age (years) | ||||||
| 18–44 | 3,470 (11.8) | 1,074 (25.2) | 978 (14.3) | 754 (11.2) | 664 (5.9) | <0.001 |
| 45–64 | 12,029 (43.9) | 2,100 (51.2) | 3,097 (49.9) | 2,926 (44.0) | 3,906 (37.7) | |
| ≥65 | 10,550 (44.3) | 899 (23.6) | 2,060 (35.9) | 2,630 (44.9) | 4,961 (56.3) | |
| Gender | ||||||
| Male | 11,772 (49.0) | 2,022 (56.3) | 2,871 (50.4) | 2,908 (50.1) | 3,971 (44.7) | <0.001 |
| Female | 14,277 (51.0) | 2,051 (43.7) | 3,264 (49.6) | 3,402 (49.9) | 5,560 (55.3) | |
| Race/ethnicity | ||||||
| Hispanic | 4,855 (9.8) | 874 (12.4) | 1,171 (10.3) | 1,244 (10.1) | 1,566 (8.3) | <0.001 |
| White, non-Hispanic | 11,969 (69.9) | 1,377 (59.4) | 2,634 (67.1) | 2,885 (70.3) | 5,073 (75.2) | |
| Black, non-Hispanic | 7,081 (14.2) | 1,462 (21.7) | 1,740 (15.2) | 1,612 (13.3) | 2,267 (11.5) | |
| Asian/Other, non-Hispanic | 2,144 (6.1) | 360 (6.6) | 590 (7.4) | 569 (6.3) | 625 (4.9) | |
| Region | ||||||
| Northeast | 4,267 (17.6) | 635 (16.5) | 1,017 (18.3) | 1,055 (18.6) | 1,560 (17.0) | 0.038 |
| Midwest | 5,023 (22.2) | 683 (20.2) | 1,106 (20.9) | 1,196 (22.1) | 2,038 (23.7) | |
| South | 11,046 (40.8) | 1,866 (43.6) | 2,588 (40.5) | 2,583 (39.5) | 4,009 (40.9) | |
| East | 5,713 (19.4) | 889 (19.7) | 1,424 (20.3) | 1,476 (19.7) | 1,924 (18.4) | |
| Insurance | ||||||
| Any private | 13,899 (62.8) | 2,518 (71.9) | 3,599 (68.3) | 3,375 (63.5) | 4,407 (55.7) | <0.001 |
| Public only | 9,686 (30.7) | 919 (17.1) | 1,828 (23.5) | 2,320 (29.7) | 4,619 (40.5) | |
| Uninsured | 2,464 (6.5) | 636 (11.0) | 708 (8.2) | 615 (6.9) | 505 (3.7) | |
| Marital status | ||||||
| Married | 13,482 (57.0) | 2,267 (61.5) | 3,357 (59.4) | 3,379 (59.0) | 4,479 (52.6) | <0.001 |
| Unmarried | 12,567 (43.0) | 1,806 (38.5) | 2,778 (40.6) | 2,931 (41.0) | 5,052 (47.4) | |
| Education | ||||||
| Less than high school | 5,932 (15.4) | 695 (11.0) | 1,268 (13.1) | 1,528 (16.2) | 2,441 (17.9) | <0.001 |
| High school | 8,382 (32.0) | 1,367 (30.8) | 1,887 (29.7) | 1,984 (31.6) | 3,144 (34.2) | |
| College or higher | 11,454 (52.5) | 1,961 (58.2) | 2,915 (57.2) | 2,730 (52.2) | 3,848 (47.9) | |
| Income | ||||||
| Low or below | 11,248 (32.6) | 1,505 (24.4) | 2,296 (27.2) | 2,660 (31.0) | 4,787 (39.8) | <0.001 |
| Middle | 7,456 (28.7) | 1,283 (29.7) | 1,847 (29.0) | 1,787 (28.5) | 2,539 (28.2) | |
| High | 7,345 (38.7) | 1,285 (45.9) | 1,992 (43.7) | 1,863 (40.4) | 2,205 (32.1) | |
| Current smoker | ||||||
| Yes | 3,774 (15.1) | 534 (13.4) | 869 (15.6) | 873 (14.0) | 1,498 (16.1) | 0.021 |
| No | 19,775 (84.9) | 3,032 (86.6) | 4,639 (84.4) | 4,853 (86.0) | 7,251 (83.9) | |
| Health status | ||||||
| Excellent | 2,401 (10.7) | 675 (18.6) | 723 (14.0) | 575 (11.6) | 428 (5.4) | <0.001 |
| Very good | 6,389 (28.2) | 1,422 (40.6) | 1,856 (34.9) | 1,566 (28.5) | 1,545 (19.5) | |
| Good | 9,362 (35.7) | 1,463 (31.8) | 2,285 (35.4) | 2,417 (38.0) | 3,197 (35.8) | |
| Fair/poor | 7,795 (25.4) | 489 (8.9) | 1,245 (15.7) | 1,721 (21.9) | 4,340 (39.3) | |
| Expenditure for medical care | ||||||
| Yes | 25,588 (98.9) | 3,855 (96.4) | 6,012 (98.5) | 6,227 (99.1) | 9,494 (99.7) | <0.001 |
| No | 461 (1.1) | 218 (3.6) | 123 (1.5) | 83 (0.9) | 37 (0.3) | |
| Medical expenditures (2014 USD), M (SE) | ||||||
| Overall adults | 9,673 (189) | 3,167 (203) | 5,242 (191) | 7,986 (244) | 15,722 (384) | <0.001 |
| Adults with spending | 9,785 (191) | 3,284 (211) | 5,320 (194) | 8,058 (245) | 15,762 (385) | <0.001 |
| EI score | 2.26 (0.02) | |||||
Note: Hypertensive was defined based on ICD-9 codes 401–405. The following comorbid conditions were included: (1) congestive heart failure; (2) heart rhythm disorders; (3) valvular disease; (4) coronary heart disease; (5) stroke; (6) hyperlipidemia; (7) pulmonary circulation disorders; (8) peripheral vascular disorders; (9) chronic pulmonary disease; (10) diabetes; (11) renal disease; (12) obesity; (13) depression; (14) paralysis; (15) neurologic disorders; (16) hypothyroidism; (17) liver disease; (18) peptic ulcer; (19) HIV/AIDS; (20) lymphoma; (21) metastatic cancer; (22) solid tumor; (23) rheumatoid arthritis; (24) coagulopathy; (25) weight loss; (26) fluid and electrolyte disorders; (27) anemia; (28) alcohol abuse; (29) drug abuse; and (30) psychoses. The p-values were generated from χ2 tests for the categorical variables and ANOVA for the continuous variables. Percentages may not total 100% due to rounding.
USD, U.S. dollar.
In all, 14.0% of U.S hypertensive adults did not have any comorbidity (n=4,073), whereas 23.0% had one (n=6,135); 24.4% had two (n=6,310); and 38.7% had three or more (n=9,531). Figure 1 shows the percentages of the 15 most frequent comorbidities in U.S hypertensive adults, which were hyperlipidemia, diabetes, rheumatoid arthritis, depression, chronic pulmonary disease, CHD, hypothyroidism, renal disease, solid tumor, heart rhythm disorders, stroke, neurologic disorders, fluid and electrolyte disorders, CHF, and valvular heart disease.
Figure 1.
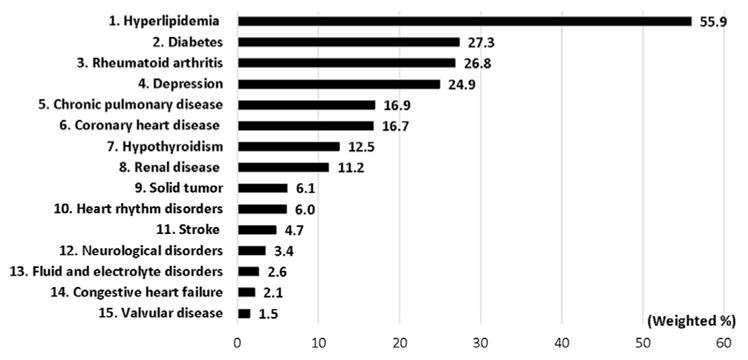
Fifteen most frequent comorbid conditions in U.S. hypertensive adults, 2011–2014 Medical Expenditure Panel Survey (n=26,049).
Table 2 shows the estimated total medical expenditures by personal descriptors and the number of comorbidities in U.S. hypertensive adults. Overall, the mean annual medical expenditure was $9,841 (95% CI=$9,464, $10,218). The comorbidity score was positively associated with the estimated mean annual total medical expenditures. Estimates were $3,914 (95% CI=$3,456, $4,372) for those without any comorbidity; $5,798 (95% CI=$5,384, $6,213) for those with one; $8,333 (95% CI= $7,821, $8,844) for those with two; and $13,920 (95% CI=$13,166, $14,674) for those with three or more comorbidities. Appendix Table 2 (available online) describes generalized linear model estimates and associated p-values for total medical expenditures.
Table 2.
Estimated Annual Medical Expenditures (2014 USD) by Comorbidity Status for U.S. Hypertensive Adults, 2011–2014 Medical Expenditure Panel Survey (n=26,049)
| Variable/category | Medical expenditure, $ (95% CI) | ||||
|---|---|---|---|---|---|
| Total | EI=0 | EI=1 | EI=2 | EI≥3 | |
| Overall | 9,841 (9,464, 10,218) | 3,914 (3,456, 4,372) | 5,798 (5,384 6,213) | 8,333 (7,821, 8,844) | 13,920 (13,166, 14,674) |
| Age (years) | |||||
| 18–44 | 8,059 (7,107, 9,011) | 3,221 (2,716, 3,727) | 4,771 (4,119, 5,423) | 6,857 (6,036, 7,677) | 11,454 (10,013, 12,896) |
| 45–64 | 9,893 (9,294, 10,492) | 3,954 (3,464, 4,445) | 5,857 (5,381, 6,333) | 8,417 (7,729, 9,105) | 14,061 (13,050, 15,072) |
| ≥65 | 10,125 (9,663, 10,586) | 4,047 (3,550, 4,543) | 5,994 (5,524, 6,465) | 8,615 (8,064, 9,165) | 14,391 (13,546, 15,236) |
| Gender | |||||
| Male | 9,477 (8,991, 9,962) | 3,773 (3,311, 4,234) | 5,588 (5,145, 6,031) | 8,031 (7,444, 8,618) | 13,416 (12,578, 14,254) |
| Female | 10,159 (9,651, 10,667) | 4,044 (3,555, 4,533) | 5,991 (5,522, 6,459) | 8,609 (8,035, 9,183) | 14,382 (13,455, 15,309) |
| Race/ethnicity | |||||
| Hispanic | 8,368 (7,559, 9,177) | 3,337 (2,864, 3,810) | 4,943 (4,343, 5,544) | 7,104 (6,396, 7,812) | 11,867 (10,620, 13,114) |
| White | 10,264 (9,779, 10,749) | 4,093 (3,586, 4,601) | 6,063 (5,600, 6,526) | 8,713 (8,109, 9,317) | 14,556 (13,678, 15,433) |
| Black | 9,149 (8,570, 9,729) | 3,649 (3,234, 4,063) | 5,405 (4,955, 5,855) | 7,767 (7,162, 8,373) | 12,975 (11,970, 13,980) |
| Asian/other | 8,381 (7,419, 9,343) | 3,342 (2,827, 3,858) | 4,951 (4,304, 5,598) | 7,115 (6,216, 8,013) | 11,885 (10,459, 13,311) |
| Region | |||||
| Northeast | 10,865 (9,937, 11,793) | 4,321 (3,730, 4,912) | 6,401 (5,790, 7,012) | 9,199 (8,283, 10,115) | 15,367 (13,900, 16,835) |
| Midwest | 10,261 (9,459, 11,064) | 4,081 (3,466, 4,696) | 6,045 (5,373, 6,717) | 8,688 (7,888, 9,488) | 14,513 (13,343, 15,683) |
| South | 9,116 (8,623, 9,608) | 3,626 (3,213, 4,038) | 5,370 (4,980, 5,761) | 7,718 (7,174, 8,262) | 12,893 (11,977, 13,808) |
| East | 9,922 (8,995, 10,849) | 3,946 (3,380, 4,513) | 5,845 (5,167, 6,523) | 8,400 (7,516, 9,285) | 14,033 (12,637, 15,428) |
| Insurance | |||||
| Any private | 10,390 (9,877, 10,903) | 4,143 (3,641, 4,645) | 6,137 (5,677, 6,596) | 8,819 (8,221, 9,417) | 14,733 (13,812, 15,654) |
| Public only | 9,674 (9,122, 10,226) | 3,858 (3,380, 4,335) | 5,714 (5,195, 6,233) | 8,212 (7,622, 8,801) | 13,718 (12,771, 14,665) |
| Uninsured | 4,973 (4,013, 5,932) | 1,983 (1,538, 2,427) | 2,937 (2,376, 3,498) | 4,221 (3,319, 5,122) | 7,051 (5,692, 8,410) |
| Marital status | |||||
| Married | 9,554 (9,044, 10,065) | 3,804 (3,335, 4,273) | 5,634 (5,218, 6,050) | 8,097 (7,564, 8,630) | 13,526 (12,603, 14,449) |
| Unmarried | 10,185 (9,601, 10,769) | 4,055 (3,553, 4,557) | 6,006 (5,463, 6,548) | 8,631 (7,930, 9,332) | 14,419 (13,466, 15,371) |
| Education | |||||
| Less than high school | 8,991 (8,129, 9,853) | 3,567 (3,064, 4,071) | 5,284 (4,735, 5,833) | 7,594 (6,676, 8,512) | 12,686 (11,367, 14,005) |
| High school | 9,278 (8,731, 9,824) | 3,681 (3,191, 4,171) | 5,453 (4,967, 5,938) | 7,836 (7,261, 8,411) | 13,090 (12,207, 13,974) |
| College or higher | 10,521 (10,001, 11,042) | 4,175 (3,681, 4,668) | 6,184 (5,695, 6,672) | 8,887 (8,322, 9,451) | 14,845 (13,903, 15,788) |
| Income | |||||
| Low or below | 10,076 (9,474, 10,679) | 4,009 (3,460, 4,558) | 5,938 (5,391, 6,485) | 8,533 (7,902, 9,165) | 14,255 (13,261, 15,249) |
| Middle | 9,293 (8,700, 9,885) | 3,697 (3,248, 4,146) | 5,476 (5,057, 5,895) | 7,870 (7,222, 8,518) | 13,147 (12,137, 14,156) |
| High | 10,046 (9,418, 10,674) | 3,997 (3,514, 4,479) | 5,920 (5,400, 6,440) | 8,507 (7,836, 9,179) | 14,212 (13,182, 15,242) |
| Current smoker | |||||
| Yes | 8,747 (7,859, 9,634) | 3,477 (3,014, 3,940) | 5,150 (4,548, 5,753) | 7,401 (6,674, 8,129) | 12,364 (10,952, 13,776) |
| No | 10,056 (9,665, 10,448) | 3,998 (3,515, 4,480) | 5,921 (5,493, 6,349) | 8,510 (7,951, 9,068) | 14,215 (13,468, 14,963) |
| Health status | |||||
| Excellent | 5,899 (5,240, 6,558) | 2,447 (2,173, 2,721) | 3,625 (3,203, 4,046) | 5,209 (4,569, 5,849) | 8,702 (7,614, 9,789) |
| Very good | 6,871 (6,392, 7,350) | 2,850 (2,498, 3,202) | 4,222 (3,878, 4,566) | 6,067 (5,569, 6,565) | 10,135 (9,278, 10,992) |
| Good | 9,159 (8,591, 9,727) | 3,799 (3,295, 4,303) | 5,628 (5,143, 6,112) | 8,088 (7,446, 8,730) | 13,511 (12,525, 14,496) |
| Fair/poor | 14,765 (14,031, 15,499) | 6,125 (5,329, 6,920) | 9,072 (8,274, 9,870) | 13,038 (12,122, 13,954) | 21,780 (20,528, 23,032) |
Note: The estimated annual medical expenditures were estimated using the average marginal effects method from the generalized linear model (GLM) with log link and gamma distribution. As a comparator, for U.S. non-hypertensive adults (n=66,888), the mean annual medical expenditure was $3,633 (95% CI=$3479, $3736): $1,656 (95% CI=$1556, $1757) for those without any comorbid condition; $3,887 (95% CI=$3645, $4128) for those with one comorbidity, $3,547 (95% CI=$4917, $5776) for those with two comorbidities, and $7,952 (95% CI=$7348, $8556) for those with three or more comorbid conditions.
EI, Elixhauser Comorbidity Index; USD, U.S. dollar.
Figure 2 shows the estimated medical expenditures by the presence of nine hypertension-related comorbidities among the 15 most frequent comorbidities. The impact of comorbidities on medical expenditures varied by type, with CHF associated with the largest impact on expenditures. Annual total medical expenditures were $17,063 (95% CI=$16,224, $17,902) in persons with CHF versus $9,683 (95% CI=$9,313, $10,053) in persons without CHF, a difference of $7,380. The increased medical expenditures from specific comorbidities were $6,069 for stroke, $6,046 for CHD, $5,093 for heart rhythm disorders, $4,851 for hyperlipidemia, and $4,453 for valvular disease. Diabetes, renal disease, and depression each increased expenditures by ≅$5,000. Appendix Table 3 (available online) describes the differences in estimated annual medical expenditures by the presence of comorbidities.
Figure 2.

Estimated annual medical expenditures (2014 USD) for nine hypertension-related comorbid conditions among the 15 most frequent comorbid conditions in U.S. hypertensive adults, 2011–2014 Medical Expenditure Panel Survey.
Note: Mean annual total healthcare expenditures were estimated using the average marginal effects method from the generalized linear model (GLM) with log link and gamma distribution.
DISCUSSION
The present study used a nationally representative sample of the U.S. population to estimate medical expenditures in hypertensive adults according to comorbidity status. To the authors’ knowledge, this is the first study that provides insight into the economic burden of hypertension by comorbidity status. Overall, as expected, the study found that a higher comorbidity score was associated with higher total medical expenditures in adults with hypertension. In addition, the differences in expenditures varied by type of comorbidity.
Also as expected, having incrementally more total comorbidities was associated with increasing medical expenditures. In non-hypertensive adults without any of the listed comorbidities, annual total medical expenditures were $1,656 (authors’ calculation from the 2011–2014 MEPS), which could reflect the use of preventive services or medical services for other conditions that were not included in the modified EI. Thus, having hypertension alone added $2,258 per year, because annual medical expenditures were $3,914 in hypertensive adults without any comorbidities included in the EI, and this figure increased to $13,920 in those with three or more comorbidities included in the EI. The findings of the present study extend this work to pinpoint even further which American adults with hypertension generally incur the highest expenses for medical care.
Hyperlipidemia, CHD, heart rhythm disorders, CHF, valvular disease, and stroke were classified in this study as comorbidities related to CVD. Notably, all six CVD-related comorbidities emerged in the list of the 15 most frequent comorbidities in the population of interest.
Hyperlipidemia was the most frequent comorbidity in adults with hypertension in this study, indicating more than half of adults with hypertension had hyperlipidemia. Similarly, a study using 2009 MEPS data also found that hypertension and hyperlipidemia was the most frequent dyad.37 Based on the 2012 edition of the chartbook, 52.9% of Medicare beneficiaries had both hypertension and hyper-lipidemia.38 The present study found that having hyper-lipidemia added $4,851 in medical expenditures per year at the individual level, albeit this marginal increase was lower than it was for the other CVD-related comorbidities except for valvular disease ($4,453). This is a substantial economic burden to society because of the high prevalence of hypertension and hyperlipidemia. Because hypertension and hyperlipidemia are major CVD risk factors and often coexist, adults with hypertension and hyperlipidemia should adopt healthier lifestyles and adhere to prescribed medications to reduce their risk of CVD.39
In this study, having CHF was associated with the highest incremental medical expenditure in hypertensive adults for the 15 most common comorbidities. Annual total medical expenditures were $17,063 in persons with CHF and $9,683 in those without CHF, a difference of $7,380. Stroke and CHD were ranked as the third and fourth most costly comorbidities among the 15 most frequent, each adding approximately $6,000. Among Medicare beneficiaries, hypertension, hyperlipidemia, and ischemic heart disease, together, was the most prevalent triad with a prevalence of 33.7%.38 In addition, approximately 55% of Medicare beneficiaries with stroke and heart failure had five or more additional chronic health conditions. As such, a patient with stroke or heart failure also had many other conditions contributing to the overall difference in expenditures.38 Hypertension is an independent risk factor for both stroke and CHD. Moreover, appropriate hypertension treatment has been found to reduce the incidence of CHF by >50%, of stroke by 30%–40%, and of myocardial infarction by 20%–25%.40–42 Thus, the appropriate management of hypertension, by itself, can reduce the economic burdens to society. Furthermore, such management can decrease the prevalence of these CVDs and reduce overall medical expenditures incurred.
Diabetes is closely related to hypertension. Indeed, hypertension and diabetes share several biological and environmental risk factors, and they frequently occur together.43 In this study, diabetes was the second most common comorbidity; 27.3% of hypertensive adults also had diabetes. Similarly, in a study using 2009 MEPS data, diabetes with hypertension and hyperlipidemia was the most frequent triad.37 In addition, a previous study found that the prevalence of diabetes in a hypertensive population was 27%.44 In the whole population, a previous study using the MEPS data reported that the prevalence of diabetes was 8%.45 Thus, the prevalence of diabetes in hypertensive adults seems to be roughly three times that seen in the general population. Because of the higher prevalence of diabetes in persons with hypertension, managing diabetes and hypertension together could be an effective way to reduce the economic burden on society. A community health workers program may be a good example.46
Hypertension and renal disease are interrelated, and hypertension may cause or result from renal disease.47,48 In previous studies, although the prevalence of hypertension varied in patients with renal disease, hypertension was present in up to 90% of such patients.49–51 Management of hypertension is more difficult when there is poorer renal function. This study found that renal disease is not only a frequent comorbidity but also a costly problem in hypertensive adults. Implementing effective awareness and prevention programs for renal disease could help to reduce costs in hypertensive adults with renal disease and respond to public health demand.52
In this study, depression was the fourth most common comorbidity in adults with hypertension, affecting one fourth of this population. This result is quite similar to that obtained by a meta-analysis published in 2015 that found the prevalence of depression to be 26.8% in patients with hypertension.53 Depression is known to have a negative impact on health outcomes in patients with hypertension.21,54,55 The present study found that the presence of depression increased expenditures by just under $5,000. Thus, effective screening for depression and appropriate monitoring of this disorder is important in caring for hypertensive patients. In addition, education in self-management can be a solution to empowering patients to reduce blood pressure and reduce stress and depressive feelings.
Efforts to prevent and control hypertension are critical because hypertension is a major risk factor for heart disease, stroke, and renal disease. In this study, CHF, stroke, CHD, and renal disease were all in the top expenditures category. Hypertension can be better controlled by several approaches, including diet, nutritional supplements, lifestyle modification, and conventional antihypertensive medications.56 The Community Guide has found several strategies to be effective for hypertension prevention and control, including self-measured blood pressure, community health workers, clinical decision support systems, reducing out-of-pocket costs for clinical services, and team-based care.57–59 In addition, managing obesity could be one of the effective ways for controlling of hypertension and other chronic conditions.60 Furthermore, appropriate hypertension management strategies should be developed for hypertensive adults with rheumatoid arthritis, depression, and chronic pulmonary diseases. Although these conditions are not directly associated with hypertension, these are frequent comorbidities in hypertensive adults. Nevertheless, little is known about the evidence on hypertension management strategies with these comorbidities.
This study had several strengths. First, the sample used was large, with a nationally representative database. The large sample enabled exploration into detailed comorbidity status and its impact on medical expenditures. Second, this study used a modified EI, expanding the list of CVD-related diseases to include such disorders as CHD, stroke, and hyperlipidemia. To the authors’ knowledge, this is the only study focusing on issues of comorbidity among hypertensive adults. Finally, a rigorous empirical approach that specified various regression models for the estimation was employed, which were able to control for various covariates.
Limitations
This study had several limitations. First, the data used were cross-sectional, and thus the authors can only claim that the medical expenditures were disease-associated although acknowledging that they may not have been the treatment costs for each specific disease. Furthermore, the impact of each comorbidity on the total medical expenditures cannot be interpreted as hypertension-associated. The purpose of this study was to determine how much the comorbidity increased the annual total medical expenditures in hypertensive adults. Second, MEPS does not include institutionalized persons in its database. Such people may have many serious comorbidities, and thus this study no doubt underestimated the percentage of hypertensive adults in the U.S. with comorbidities and therefore the associated direct medical costs. Third, because MEPS is a national survey, there is a possibility of recall bias. Respondents might not be able to correctly provide certain types of information, such as medical history. Fourth, this study did not investigate indirect costs, such as caregiver burden and absenteeism. Further research may be needed to examine the impact of comorbidity on productivity loss and the associated indirect costs in adults with hypertension. Fifth, the outcome variable was annual total medical expenditures including any types of medical services. For future studies, analyzing the breakdown of total medical expenditures by the type of services, such as inpatient hospitalizations, outpatient visits, emergency department visits, office-based physician visits, home health-care visits, and prescription medications could provide additional insights about cost burdens and guide intervention efforts. Finally, it was found that being a current nonsmoker was associated with higher annual medical expenditures among hypertensive adults, compared with being a current smoker. However, it is previously known that smoking in hypertensive adults, including former smokers, was associated with increased medical expenditures.61 In MEPS, there is no information about smoking history. The most likely explanation is that hypertensive adults who are sick, with higher expenditures, are more likely to quit smoking.
CONCLUSIONS
Comorbidities were highly prevalent among U.S. hypertensive adults, and each successive comorbidity significantly increased the medical expenditures. The expenditure increases varied by the type and number of comorbidities. These findings illustrate the importance of looking at the impact of comorbidities and can be used to help develop and evaluate interventions for hypertension prevention and control.
Supplementary Material
Acknowledgments
Publication of this article was supported by the U.S. Centers for Disease Control and Prevention (CDC), an Agency of the U.S. Department of Health and Human Services, and the Association for Prevention Teaching and Research (APTR) Cooperative Agreement No. 1U36 OE000005.
The findings and conclusions in this publication are those of the authors and do not necessarily represent the official position of the CDC.
No financial disclosures were reported by the authors of this paper.
Footnotes
Supplemental material associated with this article can be found in the online version at https://doi.org/10.1016/j.amepre.2017.07.014.
This article is part of a supplement issue titled The Economics of Hypertension and Cardiovascular Disease.
References
- 1.Centers for Disease Control and Prevention (CDC) Vital signs: prevalence, treatment, and control of hypertension—United States, 1999–2002 and 2005–2008. MMWR Morb Mortal Wkly Rep. 2011;60(4):103–108. [PubMed] [Google Scholar]
- 2.Wang G, Fang J, Ayala C. Hypertension-associated hospitalizations and costs in the United States, 1979–2006. Blood Press. 2014;23(2):126–133. doi: 10.3109/08037051.2013.814751. https://doi.org/10.3109/08037051.2013.814751. [DOI] [PMC free article] [PubMed] [Google Scholar]
- 3.Benjamin EJ, Blaha MJ, Chiuve SE, et al. Heart disease and stroke statistics–2017 update: a report from the American Heart Association. Circulation. 2017;135(10):e146–e603. doi: 10.1161/CIR.0000000000000485. https://doi.org/10.1161/CIR.0000000000000485. [DOI] [PMC free article] [PubMed] [Google Scholar]
- 4.Davis K. Expenditures for Hypertension among adults age 18 and older, 2010: estimates for the U.S. civilian noninstitutionalized population. Statistical Brief 404. Rockville, MD: Agency for Healthcare Research and Quality; Apr, 2013. [PubMed] [Google Scholar]
- 5.Weaver CG, Clement FM, Campbell NR, et al. Healthcare costs attributable to hypertension: Canadian population-based cohort study. Hypertension. 2015;66(3):502–508. doi: 10.1161/HYPERTENSIONAHA.115.05702. https://doi.org/10.1161/HYPERTENSIONAHA.115.05702. [DOI] [PubMed] [Google Scholar]
- 6.Sheppard JP, Fletcher K, McManus RJ, Mant J. Prevalence and costs of treating uncomplicated stage 1 hypertension in primary care: a cross-sectional analysis. Br J Gen Pract. 2014;64(627):e641–e648. doi: 10.3399/bjgp14X681817. https://doi.org/10.3399/bjgp14X681817. [DOI] [PMC free article] [PubMed] [Google Scholar]
- 7.Leone A, Landini L, Leone A. Epidemiology and costs of hypertension-related disorders. Curr Pharm Des. 2011;17(28):2955–2972. doi: 10.2174/138161211798157739. https://doi.org/10.2174/138161211798157739. [DOI] [PubMed] [Google Scholar]
- 8.Wang G, Zhang Z, Ayala C. Hospitalization costs associated with hypertension as a secondary diagnosis among insured patients aged 18–64 years. Am J Hypertens. 2010;23(3):275–281. doi: 10.1038/ajh.2009.241. https://doi.org/10.1038/ajh.2009.241. [DOI] [PubMed] [Google Scholar]
- 9.Duh MS, Fulcher NM, White LA, et al. Costs associated with cardiovascular events in patients with hypertension in U.S. managed care settings. J Am Soc Hypertens. 2009;3(6):403–415. doi: 10.1016/j.jash.2009.09.001. https://doi.org/10.1016/j.jash.2009.09.001. [DOI] [PubMed] [Google Scholar]
- 10.Cohen JD. Hypertension epidemiology and economic burden: refining risk assessment to lower costs. Manag Care. 2009;18(10):51–58. [PubMed] [Google Scholar]
- 11.Arredondo A. Out-of-pocket costs to users: medicine options for hypertension. Am J Hypertens. 2008;21(5):492. doi: 10.1038/ajh.2008.150. https://doi.org/10.1038/ajh.2008.150. [DOI] [PubMed] [Google Scholar]
- 12.Mullins CD, Sikirica M, Seneviratne V, Ahn J, Akhras KS. Comparisons of hypertension-related costs from multinational clinical studies. Pharmacoeconomics. 2004;22(15):1001–1014. doi: 10.2165/00019053-200422150-00004. https://doi.org/10.2165/00019053-200422150-00004. [DOI] [PubMed] [Google Scholar]
- 13.Berto P, Lopatriello S. Long-term social costs of hypertension. Expert Rev Pharmacoecon Outcomes Res. 2003;3(1):33–40. doi: 10.1586/14737167.3.1.33. https://doi.org/10.1586/14737167.3.1.33. [DOI] [PubMed] [Google Scholar]
- 14.Agency for Healthcare Research and Quality. Mean Expenses per Person with Care for Selected Conditions by Type of Service: United States, 2014. Medical Expenditure Panel Survey Household Component Data. Generated interactively. https://meps.ahrq.gov/mepsweb/data_stats/tables_compendia_hh_interactive.jsp?_SERVICE=MEPSSocket0&_PROGRAM=MEPSPGM.TC.SAS&File=HCFY2014&Table=HCFY2014%5FCNDXP%5FCA.
- 15.Bell SP, Saraf AA. Epidemiology of Multimorbidity in Older Adults with Cardiovascular Disease. Clin Geriatr Med. 2016;32(2):215–226. doi: 10.1016/j.cger.2016.01.013. https://doi.org/10.1016/j.cger.2016.01.013. [DOI] [PMC free article] [PubMed] [Google Scholar]
- 16.Valderas JM, Starfield B, Sibbald B, Salisbury C, Roland M. Defining comorbidity: implications for understanding health and health services. Ann Fam Med. 2009;7(4):357–363. doi: 10.1370/afm.983. https://doi.org/10.1370/afm.983. [DOI] [PMC free article] [PubMed] [Google Scholar]
- 17.Barnett K, Mercer SW, Norbury M, Watt G, Wyke S, Guthrie B. Epidemiology of multimorbidity and implications for health care, research, and medical education: a cross-sectional study. Lancet. 2012;380(9836):37–43. doi: 10.1016/S0140-6736(12)60240-2. https://doi.org/10.1016/S0140-6736(12)60240-2. [DOI] [PubMed] [Google Scholar]
- 18.Balu S. Estimated annual direct expenditures in the United States as a result of inappropriate hypertension treatment according to national treatment guidelines. Clin Ther. 2009;31(7):1581–1594. doi: 10.1016/j.clinthera.2009.07.010. https://doi.org/10.1016/j.clinthera.2009.07.010. [DOI] [PubMed] [Google Scholar]
- 19.Xu KT, Moloney M, Phillips S. Economics of suboptimal drug use: cost-savings of using JNC-recommended medications for management of uncomplicated essential hypertension. Am J Manag Care. 2003;9(8):529–536. [PubMed] [Google Scholar]
- 20.Wang G, Yan L, Ayala C, George MG, Fang J. Hypertension-associated expenditures for medication among U.S. adults. Am J Hypertens. 2013;26(11):1295–1302. doi: 10.1093/ajh/hpt079. https://doi.org/10.1093/ajh/hpt079. [DOI] [PMC free article] [PubMed] [Google Scholar]
- 21.Shao H, Mohammed MU, Thomas N, et al. Evaluating excessive burden of depression on health status and health care utilization among patients with hypertension in a nationally representative sample from the Medial Expenditure Panel Survey (MEPS 2012) J Nerv Ment Dis. 2017;205(5):397–404. doi: 10.1097/NMD.0000000000000618. https://doi.org/10.1097/NMD.0000000000000618. [DOI] [PubMed] [Google Scholar]
- 22.Balu S, Thomas Incremental expenditure of treating hypertension in the United States. Am J Hypertens. 2006;19(8):810–816. doi: 10.1016/j.amjhyper.2005.12.013. https://doi.org/10.1016/j.amjhyper.2005.12.013. [DOI] [PubMed] [Google Scholar]
- 23.Elixhauser A, Steiner C, Harris DR, Coffey RM. Comorbidity measures for use with administrative data. Med Care. 1998;36(1):8–27. doi: 10.1097/00005650-199801000-00004. https://doi.org/10.1097/00005650-199801000-00004. [DOI] [PubMed] [Google Scholar]
- 24.Austin SR, Wong YN, Uzzo RG, Beck JR, Egleston BL. Why summary comorbidity measures such as the Charlson Comorbidity Index and Elixhauser Score Work. Med Care. 2015;53(9):e65–e72. doi: 10.1097/MLR.0b013e318297429c. https://doi.org/10.1097/MLR.0b013e318297429c. [DOI] [PMC free article] [PubMed] [Google Scholar]
- 25.Thompson NR, Fan Y, Dalton JE, et al. A new Elixhauser-based comorbidity summary measure to predict in-hospital mortality. Med Care. 2015;53(4):374–379. doi: 10.1097/MLR.0000000000000326. https://doi.org/10.1097/MLR.0000000000000326. [DOI] [PMC free article] [PubMed] [Google Scholar]
- 26.Mnatzaganian G, Ryan P, Norman PE, Hiller JE. Accuracy of hospital morbidity data and the performance of comorbidity scores as predictors of mortality. J Clin Epidemiol. 2012;65(1):107–115. doi: 10.1016/j.jclinepi.2011.03.014. https://doi.org/10.1016/j.jclinepi.2011.03.014. [DOI] [PubMed] [Google Scholar]
- 27.Chu YT, Ng YY, Wu SC. Comparison of different comorbidity measures for use with administrative data in predicting short- and long-term mortality. BMC Health Serv Res. 2010;10:140. doi: 10.1186/1472-6963-10-140. https://doi.org/10.1186/1472-6963-10-140. [DOI] [PMC free article] [PubMed] [Google Scholar]
- 28.van Walraven C, Austin PC, Jennings A, Quan H, Forster AJ. A modification of the Elixhauser comorbidity measures into a point system for hospital death using administrative data. Med Care. 2009;47(6):626–633. doi: 10.1097/MLR.0b013e31819432e5. https://doi.org/10.1097/MLR.0b013e31819432e5. [DOI] [PubMed] [Google Scholar]
- 29.Livingston EH. Development of bariatric surgery-specific risk assessment tool. Surg Obes Relat Dis. 2007;3(1):14–20. doi: 10.1016/j.soard.2006.10.009. https://doi.org/10.1016/j.soard.2006.10.009. [DOI] [PubMed] [Google Scholar]
- 30.Kurichi JE, Stineman MG, Kwong PL, Bates BE, Reker DM. Assessing and using comorbidity measures in elderly veterans with lower extremity amputations. Gerontology. 2007;53(5):255–259. doi: 10.1159/000101703. https://doi.org/10.1159/000101703. [DOI] [PMC free article] [PubMed] [Google Scholar]
- 31.Quan H, Sundararajan V, Halfon P, et al. Coding algorithms for defining comorbidities in ICD-9-CM and ICD-10 administrative data. Med Care. 2005;43(11):1130–1139. doi: 10.1097/01.mlr.0000182534.19832.83. https://doi.org/10.1097/01.mlr.0000182534.19832.83. [DOI] [PubMed] [Google Scholar]
- 32.Schneeweiss S, Wang PS, Avorn J, Glynn RJ. Improved comorbidity adjustment for predicting mortality in Medicare populations. Health Serv Res. 2003;38(4):1103–1120. doi: 10.1111/1475-6773.00165. https://doi.org/10.1111/1475-6773.00165. [DOI] [PMC free article] [PubMed] [Google Scholar]
- 33.Stukenborg GJ, Wagner DP, Connors Comparison of the performance of two comorbidity measures, with and without information from prior hospitalizations. Med Care. 2001;39(7):727–739. doi: 10.1097/00005650-200107000-00009. https://doi.org/10.1097/00005650-200107000-00009. [DOI] [PubMed] [Google Scholar]
- 34.Menendez ME, Neuhaus V, van Dijk CN, Ring D. The Elixhauser comorbidity method outperforms the Charlson index in predicting inpatient death after orthopaedic surgery. Clin Orthop Relat Res. 2014;472(9):2878–2886. doi: 10.1007/s11999-014-3686-7. https://doi.org/10.1007/s11999-014-3686-7. [DOI] [PMC free article] [PubMed] [Google Scholar]
- 35.Meng L, Chen D, Yang Y, Zheng Y, Hui R. Depression increases the risk of hypertension incidence: a meta-analysis of prospective cohort studies. J Hypertens. 2012;30(5):842–851. doi: 10.1097/HJH.0b013e32835080b7. https://doi.org/10.1097/HJH.0b013e32835080b7. [DOI] [PubMed] [Google Scholar]
- 36.Long J, Duan G, Tian W, et al. Hypertension and risk of depression in the elderly: a meta-analysis of prospective cohort studies. J Hum Hypertens. 2015;29(8):478–482. doi: 10.1038/jhh.2014.112. https://doi.org/10.1038/jhh.2014.112. [DOI] [PubMed] [Google Scholar]
- 37.Machlin SR, Soni A. Health care expenditures for adults with multiple treated chronic conditions: estimates from the Medical Expenditure Panel Survey, 2009. Prev Chronic Dis. 2013;10:E63. doi: 10.5888/pcd10.120172. https://doi.org/10.5888/pcd10.120172. [DOI] [PMC free article] [PubMed] [Google Scholar]
- 38.U.S. Centers for Medicare & Medicaid Services. [Accessed April 17, 2017];Chronic Conditions Chartbook: 2012 Edition. www.cms.gov/Research-Statistics-Data-and-Systems/Statistics-Trends-and-Reports/Chronic-Conditions/2012Ch-artBook.html.
- 39.Njie GJ, Finnie RK, Acharya SD, et al. Reducing medication costs to prevent cardiovascular disease: a community guide systematic review. Prev Chronic Dis. 2015;12:E208. doi: 10.5888/pcd12.150242. https://doi.org/10.5888/pcd12.150242. [DOI] [PMC free article] [PubMed] [Google Scholar]
- 40.Neal B, MacMahon S, Chapman N Blood Pressure Lowering Treatment Trialists Collaboration. Effects of ACE inhibitors, calcium antagonists, and other blood-pressure-lowering drugs: results of prospectively designed overviews of randomised trials. Lancet. 2000;356(9246):1955–1964. doi: 10.1016/s0140-6736(00)03307-9. https://doi.org/10.1016/S0140-6736(00)03307-9. [DOI] [PubMed] [Google Scholar]
- 41.Karnes JH, Cooper-DeHoff RM. Antihypertensive medications: benefits of blood pressure lowering and hazards of metabolic effects. Expert Rev Cardiovasc Ther. 2009;7(6):689–702. doi: 10.1586/erc.09.31. https://doi.org/10.1586/erc.09.31. [DOI] [PMC free article] [PubMed] [Google Scholar]
- 42.Boan AD, Lackland DT, Ovbiagele B. Lowering of blood pressure for recurrent stroke prevention. Stroke. 2014;45(8):2506–2513. doi: 10.1161/STROKEAHA.114.003666. https://doi.org/10.1161/STROKEAHA.114.003666. [DOI] [PMC free article] [PubMed] [Google Scholar]
- 43.Campbell NR, Gilbert RE, Leiter LA, et al. Hypertension in people with type 2 diabetes: update on pharmacologic management. Can Fam Physician. 2011;57(9):997–1002. e347–e353. [PMC free article] [PubMed] [Google Scholar]
- 44.Chahoud J, Mrad J, Semaan A, Asmar R. Prevalence of diabetes mellitus among patients with essential arterial hypertension. J Med Liban. 2015;63(2):74–80. doi: 10.12816/0012554. https://doi.org/10.12816/0012554. [DOI] [PubMed] [Google Scholar]
- 45.American Diabetes Association. Economic costs of diabetes in the U.S. in 2007. Diabetes Care. 2008;31(3):596–615. doi: 10.2337/dc08-9017. https://doi.org/10.2337/dc08-9017. [DOI] [PubMed] [Google Scholar]
- 46.Mirambeau AM, Wang G, Ruggles L, Dunet DO. A cost analysis of a community health worker program in rural Vermont. J Community Health. 2013;38(6):1050–1057. doi: 10.1007/s10900-013-9713-x. https://doi.org/10.1007/s10900-013-9713-x. [DOI] [PMC free article] [PubMed] [Google Scholar]
- 47.Lea JP, Nicholas SB. Diabetes mellitus and hypertension: key risk factors for kidney disease. J Natl Med Assoc. 2002;94(suppl 8):7S–15S. [PMC free article] [PubMed] [Google Scholar]
- 48.Horowitz B, Miskulin D, Zager P. Epidemiology of hypertension in CKD. Adv Chronic Kidney Dis. 2015;22(2):88–95. doi: 10.1053/j.ackd.2014.09.004. https://doi.org/10.1053/j.ackd.2014.09.004. [DOI] [PubMed] [Google Scholar]
- 49.Sarafidis PA, Sharpe CC, Wood E, et al. Prevalence, patterns of treatment, and control of hypertension in predialysis patients with chronic kidney disease. Nephron Clin Pract. 2012;120(3):c147–c155. doi: 10.1159/000337571. https://doi.org/10.1159/000337571. [DOI] [PubMed] [Google Scholar]
- 50.Jancova E, Vankova Z, Honsova E, et al. Prevalence and risk of hypertension in renal disease—data from the Czech Registry of Renal Biopsies. Kidney Blood Press Res. 2008;31(2):135–142. doi: 10.1159/000126736. https://doi.org/10.1159/000126736. [DOI] [PubMed] [Google Scholar]
- 51.Valika A, Peixoto AJ. Hypertension management in transition: from CKD to ESRD. Adv Chronic Kidney Dis. 2016;23(4):255–261. doi: 10.1053/j.ackd.2016.02.002. https://doi.org/10.1053/j.ackd.2016.02.002. [DOI] [PubMed] [Google Scholar]
- 52.Perico N, Remuzzi G. Chronic kidney disease: a research and public health priority. Nephrol Dial Transplant. 2012;27(suppl 3):iii19–iii26. doi: 10.1093/ndt/gfs284. https://doi.org/10.1093/ndt/gfs284. [DOI] [PubMed] [Google Scholar]
- 53.Graham CN, Hechmati G, Fakih MG, et al. Cost-minimization analysis of panitumumab compared with cetuximab for first-line treatment of patients with wild-type RAS metastatic colorectal cancer. J Med Econ. 2015;18(8):619–628. doi: 10.3111/13696998.2015.1035659. https://doi.org/10.3111/13696998.2015.1035659. [DOI] [PubMed] [Google Scholar]
- 54.Tsartsalis D, Dragioti E, Kontoangelos K, et al. The impact of depression and cardiophobia on quality of life in patients with essential hypertension. Psychiatriki. 2016;27(3):192–203. doi: 10.22365/jpsych.2016.273.192. https://doi.org/10.22365/jpsych.2016.273.192. [DOI] [PubMed] [Google Scholar]
- 55.Graham N, Smith DJ. Comorbidity of depression and anxiety disorders in patients with hypertension. J Hypertens. 2016;34(3):397–398. doi: 10.1097/HJH.0000000000000850. https://doi.org/10.1097/HJH.0000000000000850. [DOI] [PubMed] [Google Scholar]
- 56.Caligiuri SPB, Pierce GN. A review of the relative efficacy of dietary, nutritional supplements, lifestyle, and drug therapies in the management of hypertension. Crit Rev Food Sci Nutr. 2017;57(16):3508–3527. doi: 10.1080/10408398.2016.1142420. https://doi.org/10.1080/10408398.2016.1142420. [DOI] [PubMed] [Google Scholar]
- 57.The Community Guide. [Accessed June 16, 2017];Cardiovascular disease. www.thecommunityguide.org/topic/cardiovascular-disease.
- 58.Kravetz JD, Walsh RF. Team-based hypertension management to improve blood pressure control. J Prim Care Community Health. 2016;7(4):272–275. doi: 10.1177/2150131916645580. https://doi.org/10.1177/2150131916645580. [DOI] [PMC free article] [PubMed] [Google Scholar]
- 59.Community Preventive Services Task Force. Team-based care to improve blood pressure control: recommendation of the Community Preventive Services Task Force. Am J Prev Med. 2014;47(1):100–102. doi: 10.1016/j.amepre.2014.03.003. https://doi.org/10.1016/j.amepre.2014.03.003. [DOI] [PubMed] [Google Scholar]
- 60.Malik VS, Willett WC, Hu FB. Global obesity: trends, risk factors and policy implications. Nat Rev Endocrinol. 2013;9(1):13–27. doi: 10.1038/nrendo.2012.199. https://doi.org/10.1038/nrendo.2012.199. [DOI] [PubMed] [Google Scholar]
- 61.Nakamura K, Okamura T, Hayakawa T, et al. Medical expenditures of men with hypertension and/or a smoking habit: a 10-year follow-up study of National Health Insurance in Shiga, Japan. Hypertens Res. 2010;33(8):802–807. doi: 10.1038/hr.2010.81. https://doi.org/10.1038/hr.2010.81. [DOI] [PubMed] [Google Scholar]
Associated Data
This section collects any data citations, data availability statements, or supplementary materials included in this article.