

Abstract
Recently reported studies have associated radiation exposure from computed tomography (CT) scanning with small excess cancer risks. However, since existing medical records were used in these studies, they could not control for reasons for the CT scans and therefore, the results may have been confounded by indication. Here we conducted a study to estimate potential indication bias that could affect hazard ratios for colorectal, lung and female breast cancers by reasons for a CT scan. This involved a retrospective cohort study of electronic records from all patients aged 18–89 years without previous cancer diagnoses, who received at least one CT scan at Columbia University Medical Center in the period of 1994–2014. This investigation is not a study of CT-related cancer risks with adjustment for reasons, but an evaluation of the potential for confounding by indication in such studies. Among 75,968 patients, 212,487 CT scans were analyzed during a mean follow-up of 7.6 years. For colorectal and female breast cancers, no hazard ratio bias estimates for any of the CT reasons reached statistical significance. For lung cancer, significant biases occurred only in patients with unknown CT reasons and in patients with CTs for “abnormal findings” and in those with CTs for cancer- or nodule-related reasons. This retrospective cohort study among adults with ≥1 CT scan evaluates, for the first time, CT reason-specific indication biases of potential CT-related cancer risks. Overall, our data suggest that, in studies of adults who underwent CT scans, indication bias is likely to be of negligible importance for colorectal cancer and female breast cancer risk estimation; for lung cancer, indication bias is possible but would likely be associated with only a small modulation of the risk estimate.
INTRODUCTION
Computed tomography (CT) scans deliver higher radiation doses than most other diagnostic radiation procedures (1), and their use has increased dramatically in developed countries (2, 3). Consequently, radiation-induced carcinogenesis due to CT scanning has become a public health concern. The annual number of CT scans in the U.S. in 2007 was 70-million, of which 20–30 million CT scans may have had limited clinical utility (4). Published retrospective cohort studies of CT-related radiation exposure among children have suggested increased risks for leukemia and brain tumors (5–8). These studies were criticized because the analyses failed to account for the reasons for the CT examinations, as they were not ascertained (9, 10). If the reasons were associated with a subsequent cancer diagnosis, confounding by indication could occur. However, other specially-designed studies have investigated cancer susceptibility syndromes, such as Down syndrome, as a potential source of indication bias and the potential was found to be negligible (11, 12).
While recently epidemiological studies have examined potential disease risks from pediatric CT scanning, studies of cancer risk from CT scans during adulthood are also relevant. Adults receive over 10 times more CT scans than children (13–15) and most radiation-induced cancers occur during middle or old age. While these CT risk studies are feasible in adults, large sample sizes are needed (16).
We conducted a retrospective cohort study to evaluate the association between the reasons for CT scans among adult patients of the Columbia University Medical Center (CUMC) and subsequent risk of lung, female breast or colorectal cancer. This investigation is not a study of CT-related cancer risks with adjustment for reasons, but rather serves as a basis to evaluate the potential for confounding by indication. The follow-up time is too short to assess radiation-related cancer risks.
METHODS
Study Population and Design
The study population included all patients who received a CT scan at CUMC in the period 1994–2014 at ages 18–89 years, and with at least one visit more than two years prior to their first post-1994 CT scan. Follow-up started one year after the first CT scan after 1994 for those who remained cancer-free for the one year. From electronic records, we abstracted data for each patient, including date of birth, sex, race, date of first visit at CUMC, cancer incidence and death. For all subjects, we determined the dates, reasons and body parts scanned for CT scans performed at CUMC until one year prior to cancer diagnosis or end of follow-up. We did not estimate quantitative radiation tissue dose. The requirement of one or more prior visits provided the basis for our assumption that those patients would likely also come to CUMC for a cancer diagnosis. We excluded patients who had missing information on the date of a CT scan. Our a priori selected outcomes were colorectal cancer, female breast cancer and lung cancer, the most common malignancies among adults. We ceased follow-up at the earliest date of diagnosis of any cancer, death or December 2014, whichever occurred earliest. Furthermore, patients with a benign first tumor were censored at the date of its diagnosis, since the incidence of a benign tumor might be a risk factor for one of the target cancers and thereby alter the referent hazard function. Cancer diagnoses were coded according to the WHO International Classification of Diseases (ICD-9). For a graphic illustration of the study population, see Fig. 1.
FIG. 1.
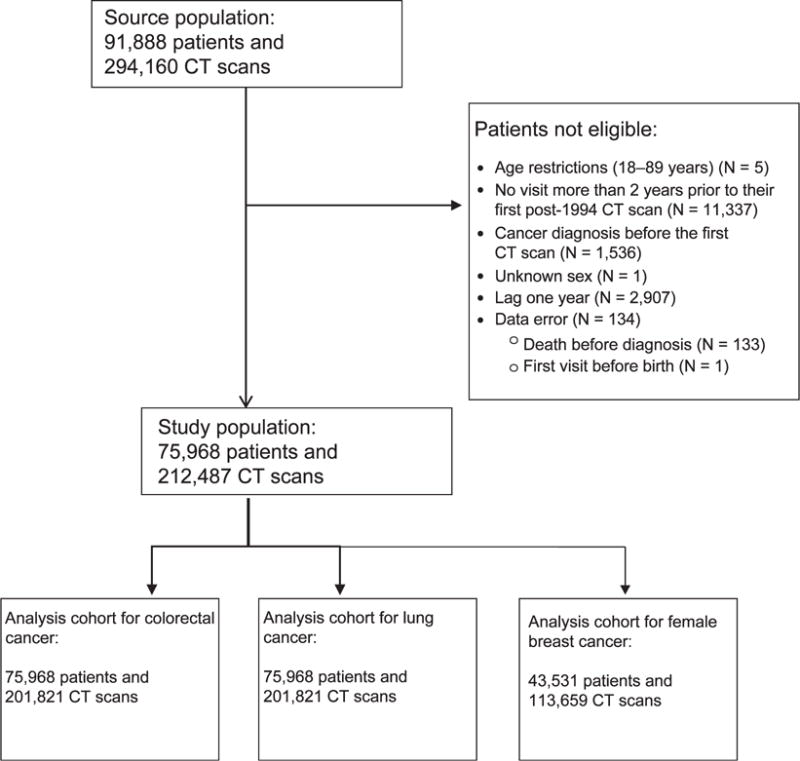
Flow chart of the study population.
For each outcome, we evaluated only scans to those body parts that would expose the target organ to a substantial dose, e.g., CT scans of the abdomen, pelvis and lower spine for colorectal cancer, and of the chest and upper spine for lung and breast cancer. A medical doctor (IS), who was blinded to outcome status, grouped reasons for scans into broad categories, e.g., pain, kidney issues, suspected cancer. Classification of reasons was challenging and involved some degree of judgment, particularly when records were cryptic or abbreviated. Therefore, categories were not defined a priori. Based on a keyword search, each CT scan was then classified to one or more categories (Supplementary Tables S1 and S2; http://dx.doi.org/10.1667/RR14807.1.S1). Note that each reason represents a clinician’s judgment about the need for the CT scan and not a preliminary disease diagnosis.
Statistical Analysis
We followed an approach that is related to the Axelson and Steenland (17) formula to estimate the bias of radiation-related relative risks (RR) for colorectal, female breast and lung cancer due to indication for each specific reason. During a medical evaluation, a patient may receive a CT scan for a variety of reasons, some of which may be related ultimately to the specific outcome under epidemiological investigation. As shown in Table 1, the relevant data in a cohort study of the effects of CT scanning are the number of events, number of patients and disease rate for those who do not receive CT scans (d0, n0 and I0, respectively), and those who receive a CT scan for outcome-related reasons (dr, nr and Ir) or other reasons that are not outcome-related (dn, nn and In.)
TABLE 1.
Relevant Data for CT Scan Cohort Study
| CT scan = no | CT scan = yes
|
||
|---|---|---|---|
| Outcome-related reason | Not outcome-related reason | ||
| No. of events | d0 | dr | dn |
| No. of patients | n0 | nr | nn |
| Disease rate | I0 | Ir | In |
Notes. Relevant data are shown in terms of the number of events, number of patients and disease rate for those who did not receive CT scans (d0, n0 and I0, respectively), and those who received a CT scan for outcome-related reasons (dr, nr and Ir) or other reasons that are not outcome-related (dn, nn and In).
Since Ir may be related to prodromal symptoms associated with the outcome, in a study of the effects of CT scans on an outcome, most of the interest is typically in the estimation of RRn = In/I0, i.e., the relative risk of the outcome in those with a CT scan that was not related to the diagnosis under investigation relative to those without a CT scan. In the absence of knowledge of the reason for a CT scan, the observed estimate is RROBS = {Irπ + In(1 − π)}/I0, where π is the probability of the outcome-related reason among patients with a CT scan. We rewrite this expression as:
| (1) |
where RRr = Ir/In represents the relative impact of the presumed outcome-related reason for the CT scan. Our study provides estimates of RRr and μ and thus an estimate of a potential bias.
For each of the three outcomes, we fit the Cox proportional hazards regression model,
| (2) |
with age as the time scale and adjustment variables zj (categorical year of birth, gender, race), a time-dependent CT exposure indicator d (no CT = 0, CT = 1) and the reasons ri for the CT scan, where we extend Eq. (1) to allow for multiple categories. The exp(beta1),.…, exp(betak) are the reason-specific hazard ratios (HR) and estimate the various RRr’s. For example, in analyses of colorectal cancer, the HR for pain as a reason, exp(βpain), compares patients who previously (lagged by 1 year) had an abdomen/pelvis/lower spine scan for “pain” with those who had a scan of the abdomen/pelvis/lower spine but for reasons “other than pain”. We approximated the variance of the bias using a Taylor series expansion for the product of two independent random variables (see Appendix for details). Confidence intervals for the bias were calculated assuming it is normally distributed. Statistical analyses were performed using SAS version 9.4 (SAS Institute, Cary, NC).
RESULTS
There were 212,487 CT scans among the 75,968 subjects (42.7% male). The average duration of follow-up was 7.6 years (median, 6.7 years; 75th percentile, 11.1 years; 90th percentile, 15.3 years; Tables 2 and 3). There were 98 diagnoses of colorectal cancer, 189 of lung cancer and 165 of female breast cancer.
TABLE 2.
Characteristics of Patients from CUMC who Received at Least One CT Scan Aged 18–89 Years in the Period 1994–2014
| Subjects
|
||
|---|---|---|
| N | % | |
| Sex | ||
| Male | 32,437 | 42.7 |
| Female | 43,531 | 57.3 |
| Race | ||
| White | 35,201 | 46.3 |
| Black | 11,751 | 15.5 |
| Other | 29,016 | 38.2 |
| Age at CT scan | ||
| 18–29 | 14,416 | 19.0 |
| 30–39 | 12,390 | 16.3 |
| 40–49 | 13,377 | 17.6 |
| 50–59 | 12,261 | 16.1 |
| 60–69 | 10,293 | 13.6 |
| 70–79 | 8,634 | 11.4 |
| ≥80 | 4,598 | 6.1 |
| Year of first examination | ||
| 1994–1999 | 12,826 | 16.9 |
| 2000–2004 | 18,640 | 24.5 |
| 2005–2009 | 23,167 | 30.5 |
| ≥2010 | 21,335 | 28.1 |
| Birth year | ||
| ≤1929 | 8,477 | 11.2 |
| 1930–1939 | 8,395 | 11.1 |
| 1940–1949 | 10,574 | 13.9 |
| 1950–1959 | 13,218 | 17.4 |
| 1960–1969 | 13,065 | 17.2 |
| 1970–1979 | 11,224 | 14.8 |
| ≥1980 | 11,015 | 14.5 |
| Number of CT scans | ||
| 1 | 31,524 | 41.5 |
| 2 | 20,939 | 27.6 |
| 3–10 | 21,144 | 27.8 |
| 11–20 | 1,926 | 2.5 |
| ≥21 | 435 | 0.6 |
| First cancer diagnosis during follow-up | ||
| None | 71,363 | 93.9 |
| Colorectal cancer | 98 | 0.3 |
| Female breast cancer | 165 | 0.1 |
| Lung cancer | 189 | 0.2 |
| Other malignant cancers | 1,278 | 1.7 |
| Benign tumors | 2,874 | 3.8 |
TABLE 3.
Number of CT Scans by Sex and Body Part among Patients from CUMC Who Received at Least One CT Scan Aged 18–89 Years in the Period 1994–2014
| Body part | Male
|
Female
|
All
|
|||
|---|---|---|---|---|---|---|
| N | Percentage | N | Percentage | N | Percentage | |
| Head and neck | 34,948 | 37.9 | 43,733 | 36.5 | 78,681 | 37.0 |
| Chesta | 17,342 | 18.7 | 21,233 | 17.7 | 38,575 | 18.2 |
| Abdomen and pelvisb | 34,774 | 37.5 | 48,837 | 40.8 | 83,611 | 39.4 |
| Upper spinea | 2,754 | 3.0 | 2,289 | 1.9 | 5,043 | 2.4 |
| Lower spineb | 917 | 1.0 | 1,438 | 1.2 | 2,355 | 1.1 |
| Extremities | 1,549 | 1.7 | 1,600 | 1.3 | 3,149 | 1.5 |
| Miscellaneous/unknown | 436 | 0.5 | 637 | 0.5 | 1,073 | 0.5 |
Only these CT scans are used for lung and female breast cancer analyses.
Only these CT scans are used for colorectal cancer analyses.
Among 85,905 CT scans of the abdomen/pelvis/lower spine, among 33,734 patients, unique reasons were reported for 70,276 scans (81.8%). For 43,155 scans of the chest/upper spine, 19,375 scans (45.4%) had identifiable reasons. Those CT scans for which no reason was entered into the electronic records were assigned to category “unknown”. Multiple, very rare CT reasons were combined into the category of “others” (Tables 4–6 and Supplementary Table S1a–c; http://dx.doi.org/10.1667/RR14807.1.S1).
TABLE 4.
Estimated Hazard Ratios and Biases for Colorectal Cancer by Reason for CT Scan of the Abdomen/Pelvis/Lower Spine among Patients from CUMC who Received at Least One CT Scan Aged 18–89 Years in the Period 1994–2014
| CT scan reasons | N (%)a | Cases | HRb | 95% CI | P value | Prevalence (%)c | Bias | 95% CI | |
|---|---|---|---|---|---|---|---|---|---|
|
| |||||||||
| Ever (vs. never) abdomen/pelvis/lower spine CT scan for reason | |||||||||
| 1 | Kidney | 11,269 (13.1) | 2 | 0.39 | 0.09–1.68 | 0.21 | 13.19 | 0.92 | 0.83–1.01 |
| 2 | Lesions | 1,857 (2.2) | 1 | 0.53 | 0.07–4.25 | 0.55 | 2.43 | 0.99 | 0.95–1.02 |
| 3 | Trauma | 2,112 (2.5) | 1 | 0.78 | 0.10–6.11 | 0.78 | 3.02 | 0.99 | 0.93–1.06 |
| 4 | Heart/lung | 2,707 (3.2) | 2 | 0.89 | 0.21–3.76 | 0.89 | 3.42 | 1.00 | 0.95–1.05 |
| 5 | Bleeding | 4,744 (5.5) | 2 | 0.90 | 0.20–4.05 | 0.89 | 6.19 | 0.99 | 0.90–1.09 |
| 6 | Status | 2,418 (2.8) | 2 | 1.02 | 0.23–4.50 | 0.98 | 3.34 | 1.00 | 0.94–1.06 |
| 7 | Other | 4,516 (5.3) | 4 | 1.04 | 0.36–3.02 | 0.94 | 7.13 | 1.00 | 0.92–1.09 |
| 8 | Liver/pancreas | 5,063 (5.9) | 4 | 1.08 | 0.35–3.27 | 0.90 | 5.43 | 1.00 | 0.93–1.08 |
| 9 | Intestinal/gastric | 8,777 (10.2) | 7 | 1.28 | 0.55–3.00 | 0.57 | 11.03 | 1.03 | 0.91–1.16 |
| 10 | Pain | 37,540 (43.7) | 18 | 1.69 | 0.85–3.38 | 0.14 | 44.57 | 1.31 | 0.77–1.84 |
| 11 | Infection | 7,468 (8.7) | 8 | 2.64 | 1.17–6.00 | 0.02 | 8.25 | 1.14 | 0.95–1.32 |
| 12 | Cancer | 4,035 (4.7) | 9 | 2.83 | 1.28–6.27 | 0.01 | 5.41 | 1.10 | 0.97–1.23 |
| 13 | Unknown | 15,629 (18.2) | 4 | 3.53 | 1.14–10.95 | 0.03 | 34.99 | 1.89 | 0.36–3.41 |
Notes. HR = hazard ratio; CI = confidence.
Percentage relative to 85,905 abdomen/pelvis/lower spine CT scans. Some scans have multiple reasons.
One regression was performed with adjustment for categorical year of birth, gender and race (white, black, other) and including a time-dependent binary variable ever versus never had a CT scan of the abdomen/pelvis/lower spine and a time-dependent binary variable for each reason with categories: ever had an abdomen/pelvis/lower spine scan for that reason, never had an abdomen/pelvis/lower spine scan for that reason (i.e., had such a scan for another reason) (reference).
Prevalence of subjects who ever had an abdomen/pelvis/lower spine CT scan for each particular reason during follow-up. For example, the RR is 2.64 for ever having had a CT scan to the abdomen/pelvis/lower spine for the reason “infection” compared to not having had such a scan for this particular reason. Since 8.25% of all subjects with a scan to the abdomen/pelvis/lower spine ever had at least one such scan for “infection” as a reason, π1 = 0.0825. Relative bias is therefore 2.64 * 0.0825 + (1 − 0.0825) = 1.14 or 14%.
TABLE 6.
Estimated Hazard Ratios and Biases for Female Breast Cancer by Reason for CT Scan of the Chest/Upper Spine among Patients from CUMC who Received at least one CT Scan Aged 18–89 Years in the Period 1994–2014
| CT scan reasonsd | N (%)a | Cases | HRb | 95% CI | P value | Prevalence (%)c | Bias | 95% CI | |
|---|---|---|---|---|---|---|---|---|---|
|
| |||||||||
| Ever (vs never) chest/upper spine CT scan for reason | |||||||||
| 1 | COPD Emphysema Bronchitis |
1,468 (3.4) | 3 | 0.50 | 0.14–1.77 | 0.28 | 5.53 | 0.97 | 0.93–1.01 |
| 2 | Pain | 2,333 (5.4) | 4 | 0.51 | 0.18–1.48 | 0.21 | 11.88 | 0.94 | 0.87–1.01 |
| 3 | Others | 2,172 (5.0) | 5 | 0.69 | 0.27–1.75 | 0.43 | 8.93 | 0.97 | 0.91–1.03 |
| 4 | Infection | 1,929 (4.4) | 4 | 0.71 | 0.25–2.01 | 0.52 | 6.38 | 0.98 | 0.93–1.03 |
| 5 | Cancer Nodule Density |
3,255 (7.5) | 11 | 0.75 | 0.37–1.52 | 0.43 | 13.10 | 0.97 | 0.90–1.04 |
| 6 | Cough | 766 (1.8) | 2 | 0.76 | 0.18–3.19 | 0.71 | 3.81 | 0.99 | 0.94–1.04 |
| 7 | Neurologic | 499 (1.2) | 1 | 0.80 | 0.11–5.97 | 0.83 | 2.42 | 1.00 | 0.94–1.05 |
| 8 | Cardiac | 1,542 (3.5) | 4 | 0.87 | 0.31–2.45 | 0.80 | 6.68 | 0.99 | 0.93–1.06 |
| 9 | Lung issues | 4,354 (10.0) | 11 | 0.88 | 0.41–1.88 | 0.73 | 14.58 | 0.98 | 0.88–1.08 |
| 10 | Shortness of breath | 1,518 (3.5) | 3 | 0.91 | 0.28–2.97 | 0.87 | 7.84 | 0.99 | 0.90–1.09 |
| 11 | Syndrome Disease |
364 (0.8) | 2 | 1.19 | 0.27–5.22 | 0.82 | 1.76 | 1.00 | 0.97–1.04 |
| 12 | Fall Trauma Injury |
2,059 (4.7) | 5 | 1.25 | 0.46–3.41 | 0.66 | 7.20 | 1.02 | 0.92–1.11 |
| 13 | CHF | 338 (0.8) | 1 | 1.33 | 0.18–10.07 | 0.78 | 1.17 | 1.00 | 0.96–1.05 |
| 14 | Abnormal findings | 817 (1.9) | 4 | 1.61 | 0.57–4.59 | 0.37 | 3.79 | 1.02 | 0.95–1.09 |
| 15 | Unknown | 23,780 (54.6) | 42 | 1.69 | 0.77–3.68 | 0.19 | 74.38 | 1.51 | 0.49–2.54 |
| 16 | Bleeding | 297 (0.7) | 1 | 1.69 | 0.20–14.25 | 0.63 | 0.97 | 1.01 | 0.96–1.06 |
| 17 | Spinal and bone problems | 789 (1.8) | 4 | 2.09 | 0.68–6.41 | 0.20 | 3.89 | 1.04 | 0.94–1.14 |
| 18 | Esophagus Abdominal organs |
435 (1.0) | 3 | 2.31 | 0.67–7.94 | 0.43 | 1.87 | 1.02 | 0.97–1.08 |
| 19 | Effusion | 519 (1.2) | 2 | 2.32 | 0.52–10.44 | 0.27 | 1.48 | 1.02 | 0.96–1.08 |
| 20 | Kidney | 164 (0.4) | 1 | 4.27 | 0.57–32.06 | 0.16 | 0.55 | 1.02 | 0.95–1.08 |
| 21 | Screening | 509 (1.2) | 3 | 4.93 | 1.32–18.39 | 0.02 | 24.08 | 1.95 | 0.19–3.70 |
Notes. HR = hazard ratio; CI = confidence interval; COPD = chronic obstructive pulmonary disease; CHF = congestive heart failure.
Percentage relative to 43,155 chest/upper spine CT scans. Some scans have multiple reasons.
One regression was performed with adjustment for categorical year of birth and race (white, black, other) and, including a time-dependent binary variable ever versus never, had a CT scan of the chest/upper spine scan and a time-dependent binary variable for each reason, with categories: ever had a chest/upper spine scan and for that reason; never had a chest/upper spine scan for that reason (reference).
Prevalence of subjects who ever had a chest/upper spine CT scan for each particular reason during follow-up.
For multiple sclerosis, dyspnea, alcohol/drugs, asthma, sarcoid, embolism, dissection, perforation, inflammation and immunosuppression/human immunodeficiency virus, there were no cases, and so they are not included in this table.
HR = hazard ratio; CI = confidence interval; COPD = chronic obstructive pulmonary disease; CHF = congestive heart failure.
For colorectal cancer, none of the CT reason-specific hazard ratio bias estimates reached statistical significance (Table 4, Fig. 2). The individual HRs were significantly increased only for two CT reasons: “cancer” and “infection” (Table 4). These findings are consistent with expectations that colorectal cancer risk may be elevated in patients previously suspected to have malignant or premalignant conditions and/or certain infections. However, due to the low prevalence of these conditions, associated bias estimates were below 15% and were not statistically significant (Table 4).
FIG. 2.
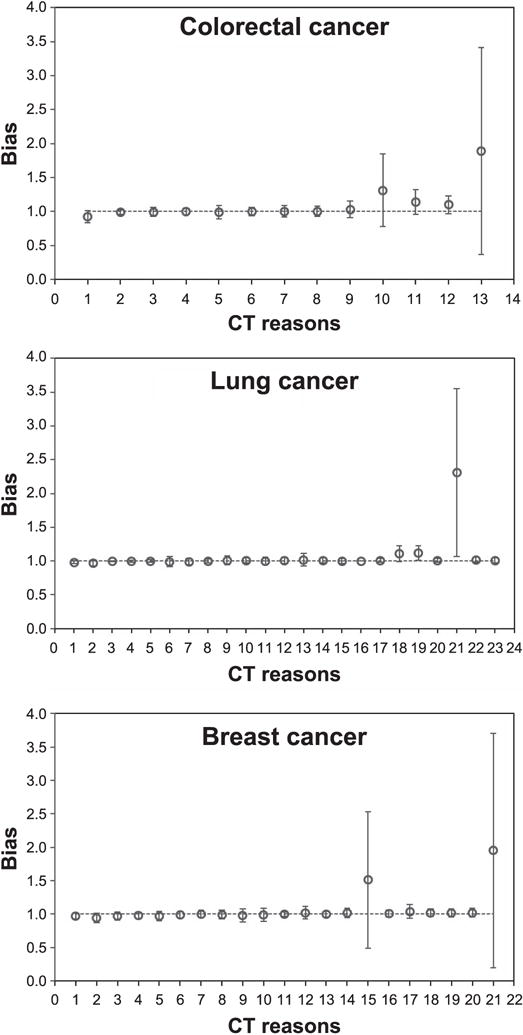
Computed tomography (CT) reason-specific hazard ratio bias estimates (symbols) and their 95% confidence intervals (error bars) for colorectal, lung and breast cancer. The different reasons for the CT scans are listed sequentially on the x-axis in the same order as in Tables 4–6 for colorectal cancer, lung cancer and breast cancer, respectively.
For lung cancer, biases significantly >1 occurred only in patients with unknown CT reasons, in those with CT scans for cancer-related reasons (e.g., lung nodule, density) and in those with CT scans for “abnormal findings” (Table 5, Fig. 2). The first two of these CT reasons, as well as two others (“inflammation” and “lung issues”) produced significantly elevated HRs (Table 5). The results for “inflammation”, “lung issues” and “cancer, nodule, density” categories are intuitively explainable because patients with such CT reasons may have been predisposed to cancer, for example, because they could have been tobacco smokers. The results for “unknown” CT reasons are less clear.
TABLE 5.
Estimated Hazard Ratios and Biases for Lung Cancer by Reason for CT Scan of the Chest/Upper Spine among Patients from CUMC who Received at Least One CT Scan Aged 18–89 Years in the Period 1994–2014
| CT scan reasonsd | N (%)a | Cases | HRb | 95% CI | P value | Prevalence (%)c | Bias | 95% CI | |
|---|---|---|---|---|---|---|---|---|---|
|
| |||||||||
| Ever (vs. never) chest/upper spine CT scan for reason | |||||||||
| 1 | Abnormal findings | 817 (1.9) | 3 | 0.44 | 0.14–1.40 | 0.16 | 3.78 | 0.98 | 0.96–1.00 |
| 2 | Shortness of breath | 1,518 (3.5) | 3 | 0.50 | 0.16–1.58 | 0.24 | 6.61 | 0.97 | 0.93–1.01 |
| 3 | Esophagus Abdominal organs |
435 (1.0) | 2 | 0.65 | 0.15–2.75 | 0.56 | 0.44 | 1.00 | 0.99–1.00 |
| 4 | Sarcoid Lupus Autoimmune |
249 (0.6) | 1 | 0.67 | 0.09–4.92 | 0.69 | 0.94 | 1.00 | 0.98–1.01 |
| 5 | Immune suppression HIV |
258 (0.6) | 1 | 0.80 | 0.11–6.02 | 0.82 | 1.02 | 1.00 | 0.98–1.02 |
| 6 | Fall Trauma Injury |
2,059 (4.7) | 5 | 0.86 | 0.34–2.20 | 0.76 | 9.12 | 0.99 | 0.91–1.06 |
| 7 | Infection | 1,929 (4.4) | 10 | 0.93 | 0.47–1.83 | 0.83 | 7.28 | 0.99 | 0.95–1.04 |
| 8 | Dissection Aneurysm |
803 (1.8) | 5 | 1.07 | 0.43–2.69 | 0.89 | 3.05 | 1.00 | 0.97–1.03 |
| 9 | Others | 2,172 (5.0) | 12 | 1.09 | 0.59–2.01 | 0.79 | 9.31 | 1.01 | 0.94–1.07 |
| 10 | COPD Emphysema Bronchitis |
1,468 (3.4) | 14 | 1.11 | 0.59–2.09 | 0.74 | 5.54 | 1.01 | 0.97–1.05 |
| 11 | Spinal and bone problems | 789 (1.8) | 3 | 1.12 | 0.34–3.70 | 0.85 | 3.55 | 1.00 | 0.95–1.06 |
| 12 | Cardiac | 1,542 (3.5) | 10 | 1.13 | 0.58–2.21 | 0.71 | 6.55 | 1.01 | 0.96–1.06 |
| 13 | Pain | 2,333 (5.4) | 8 | 1.16 | 0.55–2.45 | 0.70 | 10.57 | 1.02 | 0.92–1.11 |
| 14 | Cough | 766 (1.8) | 6 | 1.25 | 0.54–2.90 | 0.61 | 3.49 | 1.01 | 0.97–1.05 |
| 15 | Dyspnea | 221 (0.5) | 1 | 1.36 | 0.19–9.88 | 0.76 | 1.03 | 1.00 | 0.97–1.04 |
| 16 | Bleeding | 297 (0.7) | 3 | 1.44 | 0.43–4.87 | 0.56 | 0.13 | 1.00 | 1.00–1.00 |
| 17 | Syndrome Disease |
364 (0.8) | 5 | 1.75 | 0.69–4.41 | 0.24 | 1.59 | 1.01 | 0.98–1.04 |
| 18 | Lung issues | 4,354 (10.) | 37 | 1.75 | 1.12–2.74 | 0.01 | 14.94 | 1.11 | 0.99–1.23 |
| 19 | Cancer Nodule Density |
3,255 (7.5) | 43 | 1.92 | 1.24–2.96 | <0.01 | 12.58 | 1.12 | 1.01–1.22 |
| 20 | Screening | 509 (1.2) | 5 | 2.06 | 0.79–5.40 | 0.14 | 1.27 | 1.01 | 0.99–1.04 |
| 21 | Unknown | 23,780 (54.6) | 89 | 2.75 | 1.53–4.95 | <0.01 | 75.14 | 2.31 | 1.07–3.56 |
| 22 | Inflammation | 296 (0.7) | 5 | 2.85 | 1.10–7.37 | 0.03 | 1.28 | 1.02 | 0.99–1.06 |
| 23 | Alcohol/drugs | 38 (0.1) | 1 | 7.47 | 0.98–57.11 | 0.05 | 0.18 | 1.01 | 0.98–1.05 |
Notes. HR = Hazard ratio; CI = Confidence interval; COPD=Chronic obstructive pulmonary disease; HIV=Human immunodeficiency virus.
Percentage relative to 43,155 chest/upper spine CT scans. Some scans have multiple reasons.
One regression was performed with adjustment for categorical year of birth, gender and race (white, black, other) and including a time-dependent binary variable: ever versus never had a CT scan of the chest/upper spine scan, and a time-dependent binary variable for each reason with categories: ever had a chest/upper spine scan and for that reason versus never had a chest/upper spine scan for that reason (reference).
Prevalence of subjects who ever had a chest/upper spine CT scan for each particular reason during follow-up.
For multiple sclerosis, effusion, asthma, congestive heart failure, embolism, neurologic, kidney, perforation and others, there were no cases, and so they are not included in this table.
The patterns for female breast cancer were similar to those for colorectal cancer: none of the reason-specific biases reached statistical significance, and cancer HRs were significantly elevated only for the “screening” CT category (Table 6, Fig. 2). Therefore, patients who underwent screening CT procedures were expectedly more likely to be later diagnosed with breast cancer, but the low prevalence of such procedures resulted in negligible bias.
Using a two-sided sign test, CT reason-specific HRs were below or above 1 for each of the three cancer outcomes with frequencies consistent with random variation (P = 0.58 for colorectal cancer, P = 0.09 for lung cancer and P = 0.99 for female breast cancer). Of the bias estimates for 57 reasons, 40 (70%) are between −2% and 2%, and 46 (81%) are between −5% and 5%. Three of the 57 bias estimates (5.3%, i.e., what would be expected by chance) differed significantly from 1.0.
Hazard ratios, exp(β0) in Eq. (2), were 0.53 [95% confidence interval (CI): 0.26–1.09, P = 0.09] for colorectal cancer and CT scans of the abdomen/pelvis/lower spine, and 1.02 (95% CI: 0.58–1.80, P = 0.94) and 1.38 (95% CI: 0.62–3.08, P = 0.43) for lung and female breast cancer, respectively, and chest/upper spine CT scans, compared to patients who had CT scans to distal unrelated body parts. The main results were very similar when we started follow-up six months (instead of 12 months) after the first CT scan and when we reduced the lag period from 12 to 6 months.
DISCUSSION
This is the first quantitative study of the potential confounding of CT-related radiation cancer risk due to reasons for CT scans. Hazard ratios for specific reasons, although varying widely, were symmetrically distributed around unity and significance P values were consistent with random variation, indicating that most reasons were probably unrelated to cancer risk. When combined with the relatively low prevalence of CT scans for specific reasons, the estimated biases of radiation-related RRs were negligible for the majority of reasons.
Previous work has demonstrated that studies of cancer risk due to radiation exposure from CT scans among adults are feasible, although sample sizes in the order of 0.4–1.3 million exposed adults are needed (16). Our results are reassuring for such a study. During a relatively short follow-up (median: 6.7 years, 75th percentile: 11.1 years), which makes the observation of cancers due to CT-related radiation unlikely, most reasons were not associated with substantially increased or decreased hazard ratios. Our data do not allow conclusions about indication bias in studies of pediatric CT exposure and risk of leukemia and brain tumors since the indications for relevant CT scans likely differ substantially by age.
CT scans associated with the largest potential bias were those performed for unknown reasons (89% bias for colorectal cancer, 131% for lung cancer and 51% for female breast cancer). It is unclear why a substantial fraction of CT scans had no associated reason in the electronic system, since this response occurred when the treating clinicians did not record the reasons for these CT scans. It may be that the category includes the rare and less clear indications, or indicates the less comprehensive recording of indication information by hospital personnel, or that patients with unknown CT reasons more often had malignant/premalignant conditions. If true, it would be difficult in an epidemiological study to identify these patients by information about the reason for their scans unless investigators directly interviewed patients.
Our study has several strengths. It involves a large cohort of patients from a major hospital in New York City and uses patient-specific information on reasons for CT scans and cancer diagnosis. A careful classification of reasons for CT scans resulted in broad groups of indications. The HRs for reasons of CT scans appear plausible, which suggests that the methodology can detect an association. For example, the significantly elevated hazard ratio for breast cancer due to “screening” might be due to the fact that patients who visit the hospital for a screening CT scan probably have a higher risk of breast cancer than other patients, although this is a rare occurrence.
Nevertheless, our study also has several weaknesses. Ascertainment of CT scans and cancer incidence is likely incomplete since we only include information from CUMC files. By limiting our cohort to patients with at least one visit to CUMC two or more years prior to their first CT scan, we attempt to exclude patients who may have visited other hospitals for major health problems. In addition, despite our large cohort size, the numbers of cases for the different cancers are relatively few. As a consequence, many reason-specific RRs are based on few exposed cases, which leads to wide confidence intervals. Furthermore, with regard to the reasons for CT scans, we had to rely on the level of detail recorded in the electronic system and an expert-opinion classification of this information into broad categories. Misclassification likely occurred and would generally attenuate RRs, i.e., bias could be slightly underestimated. Finally, as with most studies of CT-related radiation exposure and cancer risk, we did not have data available on other risk factors for the outcomes of interest. It is conceivable that the reason for a CT scan might be correlated with a risk factor and with the outcome, e.g., cough among smokers. However, this correlation is not unexpected and contributes to making the reason for a CT scan a potential confounder.
In conclusion, our data suggest that, in studies of adults who underwent CT scans, indication bias is likely to be of negligible importance for colorectal cancer and female breast cancer risk estimation; for lung cancer, indication bias is possible but would likely be associated with only a small modulation of the risk estimate.
Supplementary Material
Table S1. Part a: Reasons for abdomen/pelvis/lower spine CT scans in the “other” category among colorectal cancer cases. Part b: Reasons for chest/upper spine CT scans in the “other” category among lung cancer cases. Part c: Reasons for chest/upper spine CT scans in the “other” category among breast cancer cases.
Table S2. Part a: Keywords and description of the categories for abdomen/pelvis/lower spine CT scans. Part b: Keywords and description of the categories for chest/upper spine CT scans.
Acknowledgments
We thank the Nijbakker-Morra Foundation for a travel grant enabling Johanna Meulepas to visit Columbia University. We are grateful to Dr. Jianhua Li for extracting the data needed for this study from CMC medical records. Dr. Lubin was supported by the Intramural Research Program of the National Institutes of Health, National Cancer Institute, Division of Cancer Epidemiology and Genetics. The funders had no involvement in the study design, data collection, analysis and interpretation, the writing of the report or the decision to submit the paper for publication.
APPENDIX
Calculation of Variance of Bias
The variance of the bias is approximated by a Taylor series for the product of two independent random variables (18).
| (A1) |
We assume that π and RRr are independent and that RRr is lognormally distributed. Since π is estimated from a large number, N, of patients with a CT scan to the relevant region (N = 33,734 for abdomen/pelvis/lower spine; N = 19,308 for chest/upper spine; N = 10,482 for chest/upper spine for females), Var(π) = π * (1 − π)/N is very small (<0.00001). That is, the variance of the bias is approximated by:
| (A2) |
where E(π) = π and with σ2 the variance of the corresponding regression coefficient, log(RRr), in the Cox regression. This means that confidence intervals of the bias will be wide if a reason is common and/or associated with a large HR. Received: April 20, 2017; accepted: October 11, 2017; published online: December 5, 2017
Footnotes
Editor’s note. The online version of this article (DOI: 10.1667/RR14807.1) contains supplementary information that is available to all authorized users.
References
- 1.Rehani MM, Berry M. Radiation doses in computed tomography. The increasing doses of radiation need to be controlled. BMJ. 2000;320:593–4. doi: 10.1136/bmj.320.7235.593. [DOI] [PMC free article] [PubMed] [Google Scholar]
- 2.Brenner DJ, Hall EJ. Computed tomography–an increasing source of radiation exposure. N Engl J Med. 2007;357:2277–84. doi: 10.1056/NEJMra072149. [DOI] [PubMed] [Google Scholar]
- 3.Hricak H, Brenner DJ, Adelstein SJ, Frush DP, Hall EJ, Howell RW, et al. Managing radiation use in medical imaging: a multifaceted challenge. Radiology. 2011;258:889–905. doi: 10.1148/radiol.10101157. [DOI] [PubMed] [Google Scholar]
- 4.Brenner DJ. Slowing the increase in the population dose resulting from CT scans. Radiat Res. 2010;174:809–15. doi: 10.1667/RR1859.1. [DOI] [PubMed] [Google Scholar]
- 5.Pearce MS, Salotti JA, Little MP, McHugh K, Lee C, Kim KP, et al. Radiation exposure from CT scans in childhood and subsequent risk of leukaemia and brain tumours: a retrospective cohort study. Lancet. 2012;380:499–505. doi: 10.1016/S0140-6736(12)60815-0. [DOI] [PMC free article] [PubMed] [Google Scholar]
- 6.Berrington de Gonzalez A, Salotti JA, McHugh K, Little MP, Harbron RW, Lee C, et al. The relationship between pediatric CT scans and subsequent risk of leukemia and brain tumors: assessment of the impact of underlying conditions. Br J Cancer. 2016;114:388–94. doi: 10.1038/bjc.2015.415. [DOI] [PMC free article] [PubMed] [Google Scholar]
- 7.Mathews JD, Forsythe AV, Brady Z, Butler MW, Goergen SK, Byrnes GB, et al. Cancer risk in 680 000 people exposed to computed tomography scans in childhood or adolescence: data linkage study of 11 million Australians. BMJ. 2013;346:f2360. doi: 10.1136/bmj.f2360. [DOI] [PMC free article] [PubMed] [Google Scholar]
- 8.Huang WY, Muo CH, Lin CY, Jen YM, Yang MH, Lin JC, et al. Paediatric head CT scan and subsequent risk of malignancy and benign brain tumour: a nation-wide population-based cohort study. Br J Cancer. 2014;110:2354–60. doi: 10.1038/bjc.2014.103. [DOI] [PMC free article] [PubMed] [Google Scholar]
- 9.Boice JD., Jr Radiation epidemiology and recent paediatric computed tomography studies. Ann ICRP. 2015;44:S236–48. doi: 10.1177/0146645315575877. [DOI] [PubMed] [Google Scholar]
- 10.Walsh L, Shore R, Auvinen A, Jung T, Wakeford R. Risks from CT scan-what do recent studies tell us? J Radiol Prot. 2014;34:E1–5. doi: 10.1088/0952-4746/34/1/E1. [DOI] [PubMed] [Google Scholar]
- 11.Journy N, Rehel JL, Ducou Le Pointe H, Lee C, Brisse H, Chatell JF, et al. Are the studies on cancer risk from CT scans biased by indication? Elements of answer from a large-scale cohort study in France. Br J Cancer. 2015;112:185–93. doi: 10.1038/bjc.2014.526. [DOI] [PMC free article] [PubMed] [Google Scholar]
- 12.Meulepas JM, Ronckers CM, Merks J, Weijerman ME, Lubin JH, Hauptmann M. Confounding of the association between radiation exposure from CT scans and risk of leukemia and brain tumors by cancer susceptibility syndromes. J Radiol Prot. 2016;36:953–74. doi: 10.1088/0952-4746/36/4/953. [DOI] [PubMed] [Google Scholar]
- 13.Hansen J, Jurik AG. Analysis of current practice of CT examinations. Acta Oncologica. 2009;48:295–301. doi: 10.1080/02841860802266714. [DOI] [PubMed] [Google Scholar]
- 14.Mettler FA, Jr, Thomadsen BR, Bhargavan M, Gilley DB, Gray JE, Lipoti JA, et al. Medical radiation exposure in the U.S. in 2006: preliminary results. Health Phys. 2008;95:502–7. doi: 10.1097/01.HP.0000326333.42287.a2. [DOI] [PubMed] [Google Scholar]
- 15.Berrington de Gonzalez A, Mahesh M, Kim KP, Bhargavan M, Lewis R, Mettler F, et al. Projected cancer risks from computed tomographic scans performed in the United States in 2007. Arch Intern Med. 2009;169:2071–7. doi: 10.1001/archinternmed.2009.440. [DOI] [PMC free article] [PubMed] [Google Scholar]
- 16.Shuryak I, Lubin JH, Brenner DJ. Potential for adult-based epidemiological studies to characterize overall cancer risks associated with a lifetime of CT scans. Radiat Res. 2014;181:584–91. doi: 10.1667/RR13622.1. [DOI] [PMC free article] [PubMed] [Google Scholar]
- 17.Axelson O, Steenland K. Indirect methods of assessing the effects of tobacco use in occupational studies. Am J Ind Med. 1988;13:105–18. doi: 10.1002/ajim.4700130107. [DOI] [PubMed] [Google Scholar]
- 18.Goodman LA. On the exact variance of products. J Am Statist Assoc. 1960;55:708–13. [Google Scholar]
Associated Data
This section collects any data citations, data availability statements, or supplementary materials included in this article.
Supplementary Materials
Table S1. Part a: Reasons for abdomen/pelvis/lower spine CT scans in the “other” category among colorectal cancer cases. Part b: Reasons for chest/upper spine CT scans in the “other” category among lung cancer cases. Part c: Reasons for chest/upper spine CT scans in the “other” category among breast cancer cases.
Table S2. Part a: Keywords and description of the categories for abdomen/pelvis/lower spine CT scans. Part b: Keywords and description of the categories for chest/upper spine CT scans.