Summary
We report the first demonstration of a fast wavelength‐switchable 340/380 nm light‐emitting diode (LED) illuminator for Fura‐2 ratiometric Ca2+ imaging of live cells. The LEDs closely match the excitation peaks of bound and free Fura‐2 and enables the precise detection of cytosolic Ca2+ concentrations, which is only limited by the Ca2+ response of Fura‐2. Using this illuminator, we have shown that Fura‐2 acetoxymethyl ester (AM) concentrations as low as 250 nM can be used to detect induced Ca2+ events in tsA‐201 cells and while utilising the 150 s switching speeds available, it was possible to image spontaneous Ca2+ transients in hippocampal neurons at a rate of 24.39 Hz that were blunted or absent at typical 0.5 Hz acquisition rates. Overall, the sensitivity and acquisition speeds available using this LED illuminator significantly improves the temporal resolution that can be obtained in comparison to current systems and supports optical imaging of fast Ca2+ events using Fura‐2.
Keywords: Fluorescence microscopy, light‐emitting diodes, medical and biological imaging, microscopy, physiology
Lay description
The ability to study calcium dynamics using fluorescence microscopy allows a large population of cells to be studied simultaneously and with minimum damage to the cells. One of the key fluorescent dyes that reports the quantity of calcium inside a cell, Fura‐2, has an excitation wavelength of 380 nm when unbound to calcium and 340 nm when bound to calcium. When a ratio of the fluorescence emission signal is taken at these two wavelengths, quantitative information about the intracellular calcium concentration can be obtained. Until now, fluorescence excitation of Fura‐2 had to be performed using either an arc lamp, which has poor amplitude stability and slow wavelength switching speeds, which means that fast changes in calcium may be missed, or light‐emitting diode (LED) combinations of 350/380 or 360/380 nm. Although LEDs have faster switching speeds and higher amplitude stability than arc lamps, the 350 and 360 nm wavelengths are not well matched to the narrow 340 nm excitation peak wavelength of Fura‐2. In this report, we demonstrate the first application of a 340/380 nm LED illuminator for ratiometric Fura‐2 calcium imaging of live cells. This illuminator uses wavelengths more accurately matching the peak wavelengths of Fura‐2, and we found that this conferred several advantages over existing illuminators. We found that it is possible to detect changes in intracellular calcium with a precision of better than 5 nM. Because Fura‐2 has a theoretical precision of 5–10 nM, our instrument performance was only limited by the response of the dye. We also explored the prospect of using lower concentrations of Fura‐2 than typically used in calcium imaging studies, and we observed that it was possible to use 25% of the normal dye concentration without compromising the measurement. Finally, we demonstrated the utility of rapid switching (150 s) between the 340 and 380 nm LEDs to image and quantify the change in calcium concentration during drug‐mediated calcium events in hippocampal neurons at video rate, with no obvious photobleaching or cell damage.
Introduction
Calcium (Ca2+) plays a varied and integral role in mediating and controlling many biological processes including the regulation of muscle contractions (Szent‐Györgyi, 1975), triggering insulin release from pancreatic cells (Dyachok & Gylfe, 2001), and the release of neurotransmitters in neurons (Frenguellil & Malinow, 1996). Increases in cytosolic Ca2+ levels can originate from a number of sources including release from internal stores triggered by activation of G‐protein‐coupled receptors by both endogenous and exogenous stimuli (Bootman, 2012) or from external sources via influx through voltage‐gated Ca2+ channels (Berridge et al., 2000). Hence, the measurement of Ca2+ dynamics has been utilised extensively in biological research as it can reveal how specimens respond to different stimuli, and how Ca2+ signalling is altered in disease states.
Although electrophysiological studies are still the gold standard for measuring electrical activity within and between excitable cells due to their high temporal resolution (Scanziani & Häusser, 2009), the spatial resolution is low and the nature of the technique leads to low throughput data production. In contrast, the development of Ca2+ specific fluorescent indicators allows for high throughput data acquisition with good spatial resolution (Tsien, 1999; Hell, 2007; Scanziani & Häusser, 2009), which has allowed intracellular Ca2+ dynamics to be investigated noninvasively in multiple cells simultaneously using widefield epifluorescence microscopy.
Fluorescent Ca2+ indicators typically fall into two different categories, namely single excitation wavelength indicators, including Fluo‐4 and Fluo‐3, or dual‐wavelength dyes (emission or excitation) such as Fura‐2 or Indo‐1 (Takahashi et al., 1999). Single wavelength indicators have a high quantum yield, allow for a simple excitation and detection setup. The Ca2+ concentration changes are then identifiable through an emission intensity change (Paredes et al., 2008). However, these indicators are unable to provide quantitative Ca2+ data because the emission intensities may be influenced by dye concentration or photobleaching during imaging (Maravall et al., 2000).
Dual wavelength or ratiometric Ca2+ indicators have either excitation or emission wavelengths that shift in response to concentration changes in cytosolic Ca2+ (Rudolf et al., 2003), and as such require an imaging setup that ensures that the free and bound Ca2+ wavelengths are recorded separately. The quantitative cytosolic Ca2+ concentrations are obtained by taking a ratio of the Ca2+ free and bound wavelengths, with these ratios being unaffected by the light intensities or the dye concentration within the cytosol (Gomes et al., 1998; Paredes et al., 2008; Barreto‐Chang & Dolmetsch, 2009). Although quantitative data can be acquired, dual wavelength indicators typically have a smaller dynamic range than single wavelength dyes (Bootman et al., 2013a). Fura‐2 is a ratiometric fluorescent Ca2+ indicator that was developed as an improved alternative to the Ca2+ indicator, Quin2 (Grynkiewicz et al., 1985). Fura‐2 also holds advantages over another ratiometric dye, Indo‐1, as it has a larger dynamic range between Ca2+ bound and free states (Bootman et al., 2013a) and is more resistant to photobleaching (Paredes et al., 2008). When cytosolic free Ca2+ binds to Fura‐2, the peak excitation wavelength changes from 380 to 340 nm, whereas the peak emission around 510 nm remains unchanged (Grynkiewicz et al., 1985). By sequential excitation of Fura‐2 at 340 and 380 nm and taking a ratio of the emission signals for each excitation wavelength, these ratios can be calibrated to a measurement of the corresponding cytosolic Ca2+ concentration by measuring the ratio of the fluorescence emission signal in the presence of known free Ca2+ concentrations.
Historically, the most commonly used light source for widefield Fura‐2 excitation has been an arc lamp with a monochromator (Paredes et al., 2008). Users of these systems have had to sacrifice precise and immediate control over light intensity without the use of neutral density filters and are limited to wavelength switching speeds on a millisecond timescale. In addition, arc lamp light sources exhibit inherent amplitude instability on the order of 5% (Petty, 2007), which reduces the accuracy of measurement and as a result small changes in Ca2+ may go undetected (Lavi et al., 2003; Wagenaar, 2012; McDonald et al., 2012).
Previous investigations have used two‐photon microscopy to conduct Fura‐2 Ca2+ imaging (Ricken et al., 1998; Stutzmann et al., 2003). By using this technique, it is possible to reduce photobleaching rates in the out of focus planes (Patterson & Piston, 2000) and image deeper into bulk specimens (Birkner et al., 2016). However, point‐scanning two‐photon excitation is slow (Denk et al., 1990; Watson et al., 2009), as is the wavelength scanning of the laser (Flynn et al., 2015). This combination does not readily support detection and measurement of fast changes in Ca2+ concentration that are possible with a widefield microscope and a fast camera. More recently, widefield two‐photon microscopy has been shown to image hippocampal neurons loaded with Fluo‐4 (Amor et al., 2016), but this work does not support quantitative measurement of Ca2+ concentration.
More recently, light‐emitting diodes (LEDs) have been utilised to excite Fura‐2. This type of illuminator can support high stability switching on microsecond timescales and offer precise output intensity control by simply changing the LED drive current. Until recently, commercial LED systems have only offered LED combinations of 350/380 nm or 360/380 nm, which do not precisely match the excitation wavelengths required or only allow excitation at the isosbestic point (Bootman et al., 2013a). We have taken advantage of a new shorter wavelength, high‐brightness LED at 340 nm to develop a 340/380 nm switchable LED illuminator. We demonstrate its application in microscopy by performing Fura‐2 ratiometric Ca2+ imaging in both an immortalised cell line and in primary cultured neurons exhibiting pharmacologically induced and synaptically driven Ca2+ responses.
Materials and methods
Characterisation of 340/380 nm LED system
The peak output spectra for the 340 nm (pE‐100‐340, CoolLED, Andover, UK) and 380 nm LEDs (pE‐100‐380, CoolLED) were measured using a spectrometer (USB2000+UV‐VIS‐ES, OceanOptics, Florida, USA). The peak wavelength and full width at half maximum (FWHM) for each LED were found to be 342.2 ± 1.5 (FWHM: 9.3 ± 1.5) nm and 383.3 ± 1.5 (FWHM: 8.3 ± 1.5) nm. Plots of these spectra can be seen in Figure 1.
Figure 1.
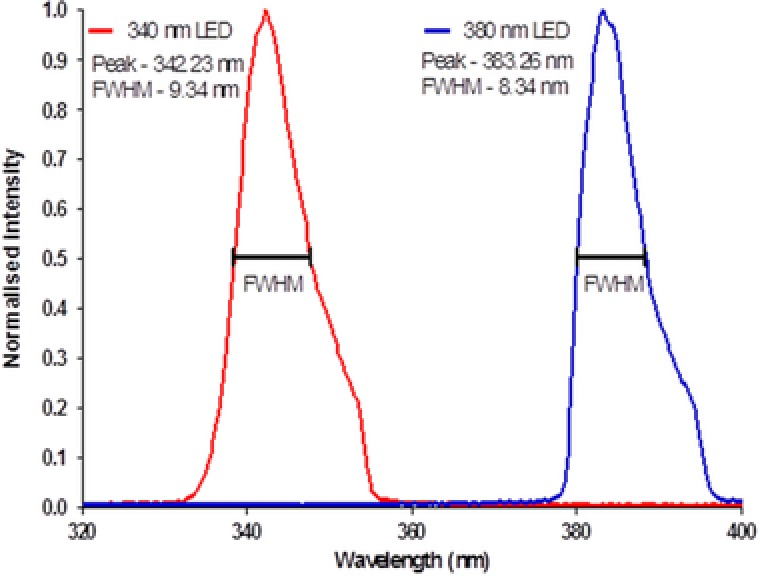
Output spectra of 340/380 nm LEDs obtained at a drive current of 1.52 ± 0.16 A.
Power measurements were recorded using a power meter (Fieldmax II, Coherent, California, USA) with a thermal head (PM10, Coherent, California, USA). The average power was taken from three separate measurements with an integration time of 3 s. Measurements were taken at the specimen plane under an Olympus 20×/0.5 water dipping objective lens at drive currents up to 1.52 ± 0.16 A for each LED.
The 340 nm LED demonstrated a linear increase in optical power of approximately 6.6 mW A−1 up to 0.59 ± 0.07 A. Above this current the 340 nm LED exhibited rollover, a phenomenon where with an increase in drive current the optical power begins to plateau or even decrease. The 380 nm LED showed a linear increase in optical power of approximately 14.7 mW A−1 increase in current up to 1.52 ± 0.16 A. The optical power at different drive currents are shown in Figure 2.
Figure 2.
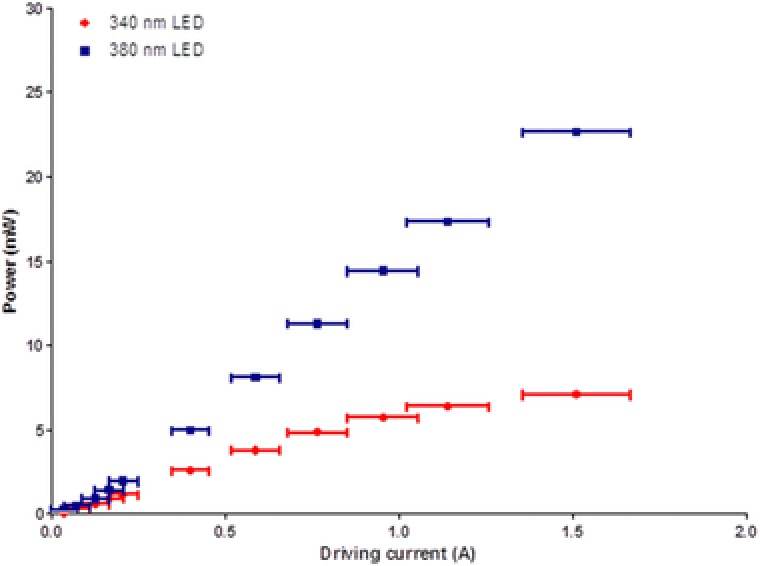
Optical powers measured at the specimen plane of an Olympus BX50 microscope under a 20× water dipping lens at different LED drive currents.
The 340 and 380 nm LEDs had an average power at the specimen plane of 3.76 ± 0.02 mW and 8.10 ± 0.03 mW, respectively when driven at a current of 0.59 ± 0.07 A, which was the largest driving current measured before the 340 nm LED begins to rollover. For the experiments presented, the 340 nm LED was used at an optical power at the microscope specimen plane of 1.32 ± 0.01 mW and the 380 nm LED was kept between 1.40 ± 0.02 and 3.08 ± 0.01 mW. The Olympus 20×/0.5 water dipping objective lens gives a field size of 0.95 mm2 so using these LED output power values we measure intensities at the specimen plane of 1.39 ± 0.01 mW mm−2 for the 340 nm LED and between 1.47 ± 0.02 and 3.24 ± 0.01 mW mm−2 for the 380 nm LED.
tsA‐201 cell culture
tsA‐201 cells, a modified HEK‐293 cell line, were maintained in 5% CO2, in a humidified incubator at 37°C, in growth media containing Minimum Essential Media (MEM) (with Earle's, without L‐glutamine), 10% foetal calf serum (Biosera, Sussex, UK), 1% nonessential amino acids (Gibco, Paisley, UK), 1% penicillin (10 000 U mL−1) and streptomycin (10 mg mL−1) (Sigma, Dorset, UK). When the cells were 90% confluent, they were split and plated on 13 mm glass coverslips coated with poly‐L‐lysine (0.1 mg mL−1, Sigma).
Primary mouse hippocampal culture
Mouse hippocampal cultures were prepared as described previously (Gan et al., 2011; Abdul Rahman et al., 2016). Briefly, 1‐ to 2‐day‐old C57/BL6J pups were killed by cervical dislocation and decapitated. The hippocampi were removed, triturated and the resulting cells were plated out at a density of 5.5 × 10⁵ cells mL−1 onto 13 mm poly‐L‐lysine (0.01 mg mL−1) coated coverslips. Cultures were incubated in culture medium consisting of Neurobasal‐A Medium (Invitrogen, Paisley, UK) supplemented with 2% (v/v) B‐27 (Invitrogen, Paisley, UK) and 2 mM L‐glutamine and maintained in a humidified atmosphere at 37°C/5% CO2 for 10–14 days in vitro (DIV). All animal care and experimental procedures were in accordance with UK Home Office guidelines and approved by the University of Strathclyde Ethics Committee.
Ca2+ imaging
Cultures were washed three times in HEPES‐buffered saline (HBS) composed of the following (in mM): NaCl 140, KCl 5, MgCl2 2, CaCl2 2, HEPES 10, D‐glucose 10, pH 7.4, 310 ± 2 mOsm. They were then loaded with Fura‐2 AM (250 nM to 1 M; Invitrogen, Paisley, UK) made up in HBS for 45–60 min at 37°C, after which they were washed with HBS a further three times prior to imaging. Throughout imaging, the cultures were constantly perfused with HBS at a rate of 3–3.5 mL min−1 with all drug solutions being added via the perfusate. Cultures were placed in a perfusion bath under a 20×/0.5 water dipping objective lens (Olympus UMPlanFl, Tokyo, Japan) in an upright widefield epifluorescence microscope (Olympus BX50). The 340 and 380 nm LEDs were coupled to the microscope with a beam path combiner (pE‐combiner, CoolLED, Andover, UK), which contained a >365 dichroic mirror (365dmlp, Chroma, Vermont, USA), and clean up filters for each LED (Semrock BrightLine 340/26 nm bandpass filter for the 340 nm LED and a Semrock BrightLine 387/11 nm bandpass filter, Illinois, USA, for the 380 nm LED). A schematic diagram for this setup can be seen below (Fig. 3).
Figure 3.
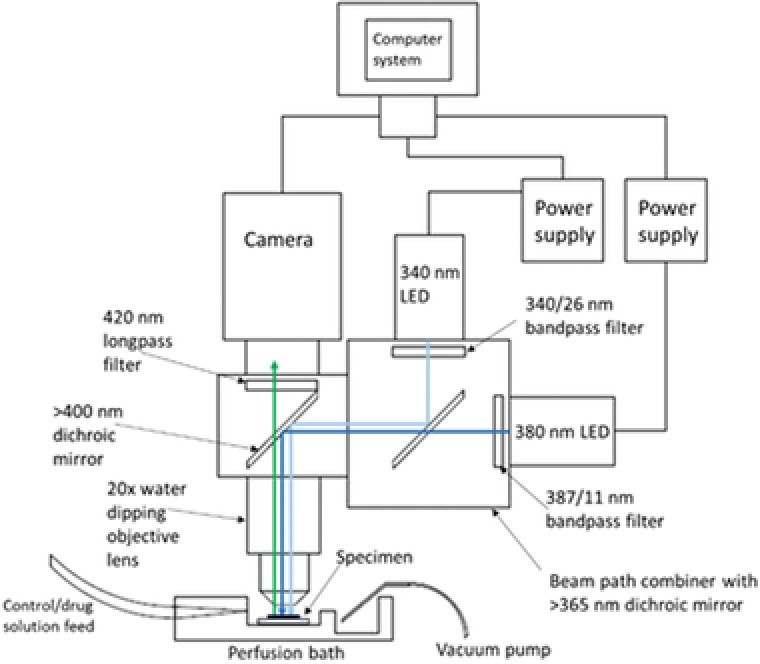
Schematic diagram of experimental imaging setup showing the location of the specimen in relation to the objective lens and where the perfused solution flows over the specimen and gets removed from the bath. The light paths of the 340/380 nm LEDs are also shown to converge through the use of 365 nm dichroic mirror and then illuminate the specimen in the perfusion bath sequentially. The emitted Fura‐2 AM fluorescence propagates upwards through the objective lens, >400 nm dichroic mirror (Olympus) and 420 longpass filter (Olympus) to the camera. The camera and power supplies for both LEDs are connected to a computer system for TTL triggering and recording fluorescent signals.
During routine imaging, cultures were alternatively illuminated with the 340 and 380 nm LEDs, each with an exposure time of 100 ms, and imaged at a rate of 0.5 Hz with emission being detected above 420 nm by a CMOS camera (ORCA‐Flash 4.0LT, Hamamatsu, Hamamatsu City, Japan) using a binning of n = 2. For video rate image capture, an LED switching speed of 150 s was used with exposure times reduced to 20.5 ms, facilitating imaging at a rate of 24.39 Hz. All signals were recorded using the WinFluor imaging software (Dempster et al., 2002), which also synchronised and TTL triggered the 340/380 nm illuminator and camera. Results were calculated as changes in fluorescence ratio occurring within the cytosol and expressed as a fold increase above the normalised baseline.
Data analysis and statistics
An area on each coverslip, which was free of cells, was selected to determine the background fluorescence level and subtracted from each of the ROIs. The background‐corrected emission fluorescence time courses from 340 and 380 nm excitation obtained using WinFluor were read into a MATLAB script to determine the average baseline Ca2+ level obtained during the initial HBS solution wash. Each ROI was then normalised to the associated calculated baseline. The average peak fold increases of emission ratios above the baseline for drug washes were then calculated using the normalised emission ratios.
To convert the emission ratios from the 340/380 nm excitation into a measurement of the free cytosolic Ca2+ concentration we used the following equation (Grynkiewicz et al., 1985),
| (1) |
where KD is the dissociation constant for Fura‐2 (224 nM) (Grynkiewicz et al., 1985), R is the experimental emission ratios and F min, R max, F max and R min are the 380 nm fluorescence emission signals and emission ratio from 340/380 nm excitation at saturating and zero free Ca2+ levels, respectively. To determine the experimental values required for Eq. (1) we recorded the emission ratios obtained from 39 and 0 M free Ca2+ solutions obtained using a Fura‐2 Ca2+ imaging calibration kit (Invitrogen, Paisley, UK). The percentage Ca2+ baseline fluctuations were determined by finding the maximum and minimum deviations from the recorded baseline. This deviation was then calculated as the percentage of the average baseline level.
All biological replicates are reported as an ‘n’ number, which are equal to the total number of ROIs investigated throughout each experiment taken from at least four different cultures. All data are expressed as mean ± standard error of the mean. Data were compared by using either an unpaired student t‐test or a one‐way ANOVA with Tukey's comparison when appropriate, with P values < 0.05 considered significant.
Results
Fura‐2 AM ratiometric Ca2+ imaging of induced Ca2+ transients in live cell specimens
Pharmacologically induced increases in intracellular Ca2+ were observed in tsA‐201 cells (n = 572) and cultured hippocampal neurons (n = 388). The pharmacological stimuli were selected for use as they are known to cause large but slow Ca2+ concentration changes in the live cell specimens. The normalised emission ratio fold increases above the resting baseline in the tsA‐201 cells were 1.67 ± 0.04 (n = 572) evoked by ATP (5 M) and 3.08 ± 0.04 (n = 572) by trypsin (100 nM), respectively. In hippocampal neurons, application of glutamate (20 M) caused a fluorescence fold increase of 4.2 ± 0.1 (n = 388) with potassium chloride (KCl, 20 Mm) application eliciting fold increases of 2.51 ± 0.06 (n = 388).
Using Eq. (1) each ROI was converted to a measurement of cytosolic Ca2+ to allow quantitative data to be obtained. From measurement of the cytosolic Ca2+ concentrations using Ca2+ standards, ATP (5 M) induced cytosolic Ca2+ increases of 280.4 ± 7.8 nM (n = 572, P < 0.0001 compared to average baseline of 81.2 ± 5.6 nM, Figs. 4A, B,) and trypsin (100 nM) caused a 581.9 ± 10.2 nM increase (n = 572, P < 0.0001 compared to average baseline of 81.6 ± 5.6 nM, Figs. 4A, B) in the tsA‐201 cells. In hippocampal neurons, glutamate (20 M) induced Ca2+ increases of 645.4 ± 18.2 nM (n = 388, P < 0.0001 compared to average baseline of 92.3 ± 10.1 nM, Figs. 4C, D) and KCl (20 mM) elicited increases in Ca2+ of 357.6 ± 9.2 nM (n = 388, P < 0.0001 compared to baseline of 92.3 ± 10.1 nM, Figs. 4C, D). Video files demonstrating ratiometric Fura‐2 imaging of tsA‐201 cells and hippocampal neurons at frame speeds of 0.5 Hz are shown in files SV1 and SV2. These files have undergone .JPG compression and have had the playback speed changed to 25 Hz.
Figure 4.
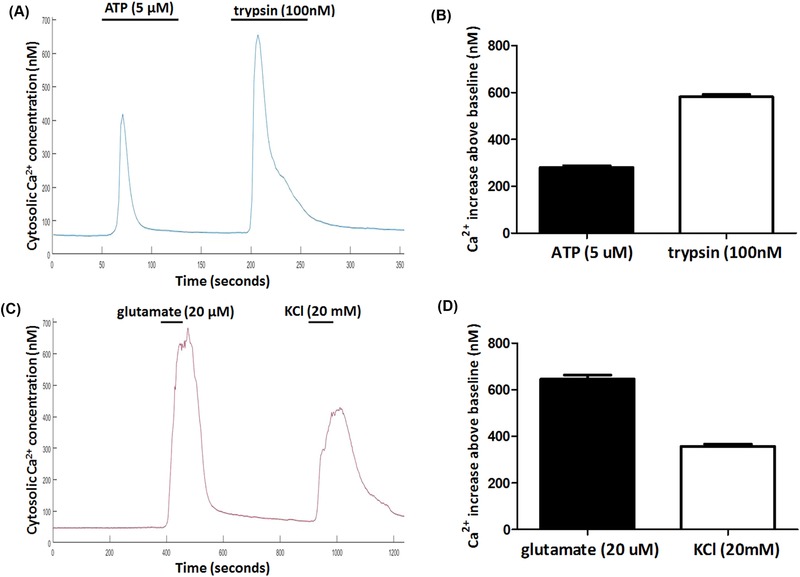
(A) Representative trace of Ca2+ changes in tsA‐201 cells (n = 572) elicited by the application of ATP (5 M) and trypsin (100 nM). (B) Average pharmacologically stimulated Ca2+ increases above the baseline levels in tsA‐201 cells. (C) Representative trace of Ca2+ increase in hippocampal neurons (n = 388) through the application of glutamate (20 M) and KCl (20 mM). (D) Average Ca2+ increases above resting levels in hippocampal neurons for each stimulus.
Ca2+ baseline fluctuation measurements
To determine the minimum cytosolic Ca2+ concentration change that could be accurately monitored from the baseline levels using the 340/380 nm LED illuminator, we analysed the baseline fluctuations observed in the experiments reported above. By obtaining the maximum and minimum values in each of the baseline measurements for the tsA‐201 and hippocampal neuron Ca2+ imaging experiments, we measured an average peak to peak fluctuation of 5.9 ± 0.2 % (n = 572) for the tsA‐201 cells and 4.2 ± 0.2 % (n = 388) in the hippocampal neurons. Using Eq. (1), these fluctuations equate to a cytosolic Ca2+ concentration fluctuation of 4.8 ± 0.2 nM in the tsA‐201 cells and 3.9 ± 0.2 nM in the hippocampal neurons. An example plot of the Ca2+ fluctuations observed in the hippocampal neurons can be seen in Figure 5.
Figure 5.
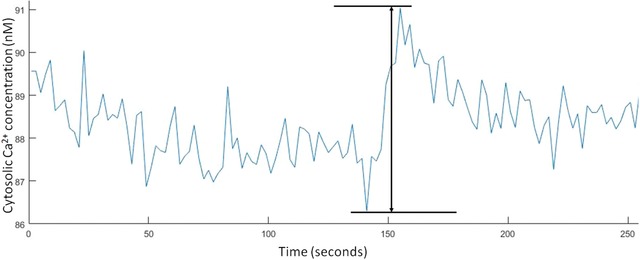
Example plot of the peak‐to‐peak noise recorded in the hippocampal neurons baseline Ca2+ concentrations while carrying out 0.5 Hz ratiometric Fura‐2 Ca2+imaging.
To confirm this finding, we diluted a 17 nM free Ca2+ solution from a Fura‐2 Ca2+ imaging calibration kit (Invitrogen, Paisley, UK) with distilled water to obtain a series of solutions with decreasing Ca2+ concentrations that decreased in steps of 2 nM. By imaging 5 L of each solution and obtaining the background corrected fluorescence emission ratio we were able to determine that at concentrations above 5 nM we could identify changes in Ca2+ on the order of 2 nM.
340/380 nm LEDs allow Ca2+ imaging using lower Fura‐2 AM concentrations
We investigated the possibility of using lower concentrations than the 1 M typically recommended in Fura‐2 AM loading protocols (Barreto‐Chang & Dolmetsch, 2009; Bootman et al., 2013b). We imaged trypsin (100 nM) mediated Ca2+ transients in tsA‐201 cells loaded with either 750 nM (n = 111), 500 nM (n = 119) or 250 nM (n = 130) Fura‐2 AM and compared the average Ca2+ increase above the baseline to the value obtained in the initial experiments using 1 M of Fura‐2 AM (n = 572, Fig. 6). The Ca2+ increases above the baseline for the 750, 500 and 250 nM were 633.0 ± 33.9 nM (n = 111, P > 0.05 compared to 1 M Fura‐2 AM, Fig. 6) 552.6 ± 22.7 nM (n = 119, P > 0.05 compared to 1 M Fura‐2 AM, Fig. 6) and 616.0 ± 24.9 nM (n = 130, P > 0.05 compared to 1 M Fura‐2 AM, Fig. 6), respectively.
Figure 6.
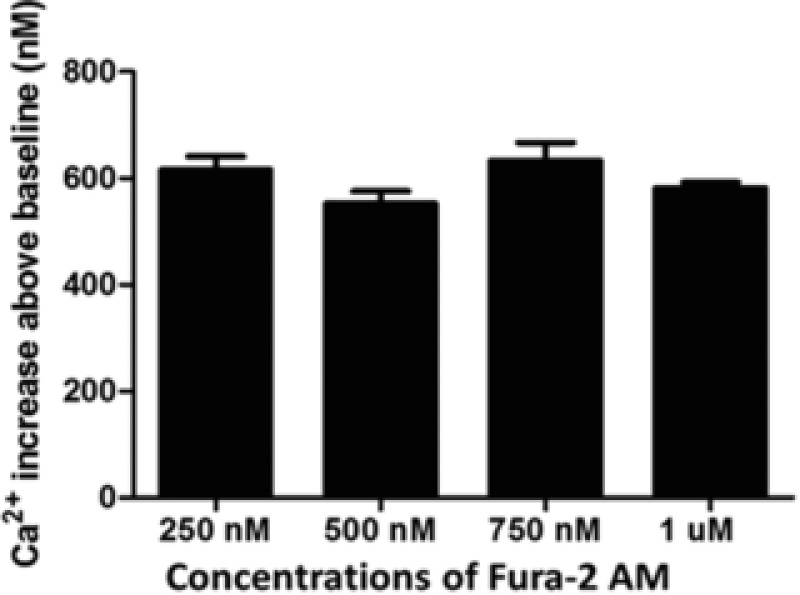
Comparison of Ca2+ increases obtained from the application of trypsin (100 nM) to tsA‐201 cells loaded with different concentrations of Fura‐2 AM.
Video rate ratiometric Ca2+ imaging using 1 M Fura‐2 AM
It has been previously shown, using widefield two‐photon microscopy at imaging speeds between 10 and 100 Hz that spontaneous Ca2+ events could be detected in hippocampal neurons loaded with Fluo‐4 AM though it was not possible to convert the fluorescence signals into a quantitative Ca2+ concentration (Amor et al., 2016). Here we utilised the 340/380 nm LED to image at 0.5 and 24.39 Hz (limited only by the frame rate available with the camera) spontaneous synaptically driven Ca2+ events in hippocampal neurons, induced by the application of magnesium (Mg2+)‐free HBS. At 0.5 Hz, a clear increase in intracellular Ca2+ levels was observed when Mg2+‐free HBS was applied but individual events were difficult to decipher (Fig. 7A). However, at an image acquisition rate of 24.39 Hz, individual increases in intracellular Ca2+ levels were observed that are similar to action potential firing seen when using patch clamping (Amor et al., 2016), with some synchronicity in firing between different neurons also being observed (Fig. 7B). Indeed, a peak‐to‐peak measurement of the baseline fluctuations at 24.39 Hz found an average fluctuation of 7.10 ± 0.04 % (n = 21) which equates to a fluctuation in the average resting Ca2+ (104.5 ± 4.1 nM) of 7.42 ± 0.04 nM (n = 21). When imaging at 0.5 Hz the hippocampal neurons had an average baseline fluctuation of 5.22 ± 0.06 % (n = 39), which is a fluctuation in the basal Ca2+ (87.9 ± 5.3 nM) of 4.59 ± 0.05 nM.
Figure 7.
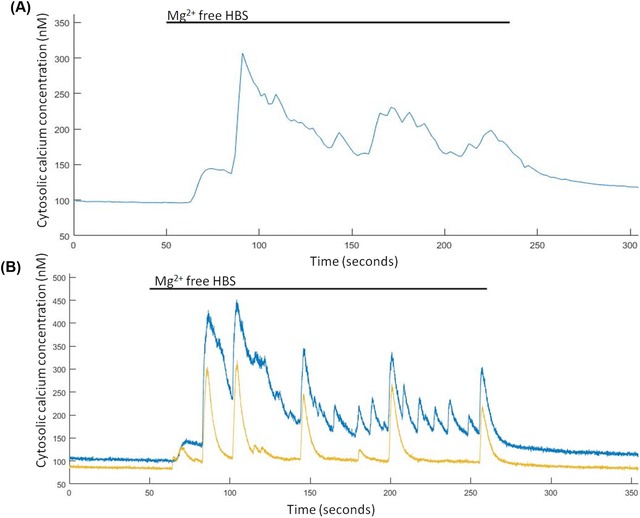
Spontaneous Ca2+ events are induced in Mg2+‐free HBS. (A) Representative trace from a single hippocampal neuron of Mg2+‐free induced Ca2+ events imaged at 0.5 Hz and (B) representative trace from two hippocampal neurons of Mg2+‐free induced Ca2+ events imaged at 24.39 Hz.
Discussion
We have demonstrated the first application of a fast wavelength‐switchable 340/380 nm LED illuminator for ratiometric Ca2+ imaging of live cells loaded with the fluorescent Ca2+ indicator Fura‐2 AM. The 340/380 nm LEDs more accurately match the peak excitation wavelength of bound and free Ca2+ ions, offering more efficient excitation and higher signal‐to‐noise ratios when compared with other illumination systems. The fluorescence fold increases and cytosolic Ca2+ changes measured in the live cell specimens are in agreement with previous studies in hippocampal neurons, tsA‐201 cells and HEK‐293 cells illuminated using an arc lamp system (Verderio et al., 1995; Aulestia et al., 2011; Poole et al. 2013; Wu et al., 2014; Jung et al., 2016). Analysis of the baseline Ca2+ peak‐to‐peak noise showed that the 340/380 nm LED illuminator enables the detection of cytosolic Ca2+ changes with a minimum precision of 3.9 ± 0.2 nM. The limit on the precision of the experiment comes not from the imaging apparatus but only the response of the dye to Ca2+ which has a theoretical precision of 5–10 nM (Petersen, 2013).
In addition, we have shown that using the new illumination system we were able to load cells with lower concentrations of Fura‐2 AM than recommended in loading protocols with no statistically significant difference between the Fura‐2 AM concentrations examined. It was possible to load our specimens with as low as 250 nM Fura‐2 AM and still accurately record pharmacologically mediated Ca2+ events at 0.5 Hz. The utility of lower dye concentrations presents not only an economical advantage by allowing more experiments from a single vial of dye but also may increase the viability of cells by reducing the concentrations of formaldehyde and acetic acid created through the hydrolysis of AM‐ester (Plieth & Hansen, 1996).
Finally, we have demonstrated the functionality of the new illuminator system by utilising the intrinsic LED advantages of rapid wavelength switching and amplitude stability to image and quantify synaptically driven Ca2+ events in hippocampal neurons at a video rate of 24.39 Hz. We compared the Ca2+ traces obtained when imaging at video rate to those recorded when imaging at 0.5 Hz (Fig. 7A). It can be seen from this comparison that due to the slow image capture rate of 0.5 Hz, many of the rapid synaptically driven Ca2+ events cannot be imaged. The appearance of these events in the presence of Mg2+ free HBS is due the relief of the voltage‐dependent blockade of N‐methyl‐D‐aspartate (NMDA) receptors by Mg2+ (Sombati & DeLorenzo, 1995; Mangan & Kapur, 2004). This is a well‐established phenomenon that is used extensively both in academia and in the pharmaceutical industry to induces synaptically driven Ca2+ events and epileptiform like activity (DeLorenzo et al., 2005; Xiang et al., 2015), but the clear discrimination between individual events has not previously been possible due to the limitations of arc lamp systems. It was also apparent that some synchronicity occurred between larger Ca2+ events in different neurons, this has been reported previously for neuronal networks under Mg2+ free conditions (Robinson, 1993; DeLorenzo et al., 2005). The increase in baseline fluctuation observed in these measurements compared to the slower imaging rates can be attributed to a decrease in the signal‐to‐noise ratio due to the lower exposure times used which reduces the number of photons collected for each image. Though there was an increased fluctuation it was not significantly larger from that obtained at 0.5 Hz imaging rates (P > 0.05). The ability to observe these spontaneous changes in Ca2+ using widefield microscopy allows for improved temporal resolution of imaging synaptically driven neuronal Ca2+ events while maintaining the high spatial resolution afforded by Ca2+ imagingleading to a higher throughput of more informative measurements than currently offered with existing Ca2+ imaging methods (Scanziani & Häusser, 2009).
Conclusions
We believe this to be the first demonstration of a truly 340/380 nm LED illuminator for ratiometric Fura‐2 Ca2+ imaging of live cells. By matching the wavelengths of the illuminator to the optimum excitation wavelengths of the free and Ca2+ bound states of Fura‐2, we have combined efficient ratiometric imaging with rapid switching and high intensity stability of LEDs. This represents a significant improvement over existing LED‐based illuminators and frees Fura‐2 ratiometric imaging from the known limitations of arc lamps.
Acknowledgements
The authors would like to thank John Dempster for his assistance in configuring the WinFluor software for our application. Peter W. Tinning is supported by a University of Strathclyde scholarship partially funded by CoolLED Ltd. This research was also part funded by a Medical Research Council grant – MR/K015583/1.
References
- Abdul Rahman, N.Z. , Greenwood, S.M , Brett R.R, Tossell, K. , Ungless, M.A. , Plevin, R. & Bushell, T.J. (2016) Mitogen‐activated protein kinase phosphatase‐2 deletion impairs synaptic plasticity and hippocampal‐dependent memory. J. Neurosci. 36, 2348–2354. [DOI] [PMC free article] [PubMed] [Google Scholar]
- Aulestia, F.J. , Redondo, P.C. , Rodríguez‐García, A. , Rosado, J.A. , Salido, G.M. , Alonso, M.T. & García‐Sancho, J. (2011) Two distinct calcium pools in the endoplasmic reticulum of HEK‐293T cells. Biochem J. 435, 227–235. [DOI] [PubMed] [Google Scholar]
- Amor, R. , McDonald, A. , Trägårdh, J. et al (2016) Widefield two‐photon excitation without scanning: live cell microscopy with high time resolution and low photo‐bleaching. PLoS ONE 11, 1–19. [DOI] [PMC free article] [PubMed] [Google Scholar]
- Barreto‐Chang, O.L. & Dolmetsch R.E. (2009) Calcium imaging of cortical neurons using fura‐2 AM. J. Vis. Exp. 23, 3–5. [DOI] [PMC free article] [PubMed] [Google Scholar]
- Berridge, M.J. , Lipp, P. & Bootman, M.D. (2000) The versatility and universality of calcium signalling. Nat. Rev. Mol. Cell Biol. 1, 11–21. [DOI] [PubMed] [Google Scholar]
- Birkner, A. , Tischbirek, C.H. & Konnerth, A. (2016) Improved deep two‐photon calcium imaging in vivo. Cell Calcium. 64, 29–35. [DOI] [PubMed] [Google Scholar]
- Bootman, M.D. (2012) Calcium signaling. Cold Spring Harb. Perspect. Biol. 4, a011171. [DOI] [PMC free article] [PubMed] [Google Scholar]
- Bootman, M.D , Rietdorf, K. , Collins, T. , Walker, S. & Sanderson, M. (2013a) Ca2+‐sensitive fluorescent dyes and intracellular Ca2+ imaging. Cold Spring Harb. Prot. https://doi.org/10.1101/pdb.top066050. [DOI] [PubMed] [Google Scholar]
- Bootman, M.D. , Rietdorf, K. , Collins, T. , Walker, S. & Sanderson, M. (2013b) Loading fluorescent Ca2+ indicators into living cells. Cold Spring Harb. Prot. https://doi.org/10.1101/pdb.prot072801. [DOI] [PubMed] [Google Scholar]
- DeLorenzo, R.J. , Sun, D.A. & Deshpande, L.S. (2005) Cellular mechanisms underlying acquired epilepsy: the calcium hypothesis of the induction and maintainance of epilepsy. Pharmacol. Ther. 105, 229–266. [DOI] [PMC free article] [PubMed] [Google Scholar]
- Dempster, J , Wokosin, D.L. , McCloskey, K.D. , Girkin, J.M.m & Gurney, A.M. (2002) WinFluor‐an integrated system for the simultaneous recording of cell fluorescence images and electrophysiological signals on a single computer system. Br. J. Pharmacol. 137, 146.12208770 [Google Scholar]
- Denk, W. , Strickler, J.H. & Webb, W.W. (1990) Two‐photon laser scanning fluorescence microscopy. Science 248, 73–76. [DOI] [PubMed] [Google Scholar]
- Dyachok, O & Gylfe, E . (2001) Store‐operated influx of Ca(2+) in pancreatic beta‐cells exhibits graded dependence on the filling of the endoplasmic reticulum. J. Cell Sci. 114, 2179–2186. [DOI] [PubMed] [Google Scholar]
- Flynn, D.C. , Bhagwat, A.R. , Brenner, M.H. , Núñez, M.F. , Mork, B.E. , Cai, D. , Swanson, J.A. & Ogilvie, J.P. (2015) Pulse‐shaping based two‐photon FRET stoichiometry. Opt. Express. 23, 3353–3372. [DOI] [PMC free article] [PubMed] [Google Scholar]
- Frenguellil, B.G. & Malinow, R. (1996) Fluctuations in intracellular calcium responses to action potentials in single en passage presynaptic boutons of layer V neurons in neocortical slices. Learn. Mem. 3, 150–159. [DOI] [PubMed] [Google Scholar]
- Gan, J. , Greenwood, S.M. , Cobb, S.R. & Bushell, T.J. (2011) Indirect modulation of neuronal excitability and synaptic transmission in the hippocampus by activation of proteinase‐activated receptor‐2. Br. J. Pharmacol. 163, 984–994. [DOI] [PMC free article] [PubMed] [Google Scholar]
- Gomes, P.A.P. , Bassani, R.A. & Bassani, J.W.M. (1998) Measuring [Ca2+] with fluorescent indicators: theoretical approach to the ratio method Cell Calcium 24, 17–26. [DOI] [PubMed] [Google Scholar]
- Grynkiewicz, G. , Poenie, M. & Tsien, R.Y. (1985) A new generation of Ca2+ indicators with greatly improved fluorescence properties. J. Biol. Chem. 260, 3440–3450. [PubMed] [Google Scholar]
- Hell, S.W. (2007) Far‐field optical nanoscopy. Science 316, 1153–1158. [DOI] [PubMed] [Google Scholar]
- Jung, S. , Seo, J.B. , Deng, Y. , Asbury, C.L. , Hille, B. & Koh, D. (2016) Contributions of protein kinases and β‐arrestin to termination of protease‐activated receptor 2 signaling. J. Gen. Physiol. 147, 255–271. [DOI] [PMC free article] [PubMed] [Google Scholar]
- Lavi, R. , Shainberg, A. , Friedmann, H. , Shneyvays, V. , Rickover, O. , Eichler, M. , Kaplan, D. & Lubart, R. (2003) Low energy visible light induces reactive oxygen species generation and stimulates an increase of intracellular calcium concentration in cardiac cells. J. Biol. Chem. 278, 40917–40922. [DOI] [PubMed] [Google Scholar]
- Mangan, P.S. & Kapur, J. (2004) Factors underlying bursting behavior in a network of cultured hippocampal neurons exposed to zero magnesium. J. Neurophysiol. 91, 946–957. [DOI] [PMC free article] [PubMed] [Google Scholar]
- Maravall, M. , Mainen, Z.F. , Sabatini, B.L. & Svoboda, K. (2000) Estimating intracellular calcium concentrations and buffering without wavelength ratioing. Biophys J. 78, 2655–2667. [DOI] [PMC free article] [PubMed] [Google Scholar]
- McDonald, A , Harris, J. , MacMillan, D. , Dempster, J. & McConnell, G. (2012) Light‐induced Ca^2+ transients observed in widefield epi‐fluorescence microscopy of excitable cells. Biomed. Opt. Express. 3, 1266–1273. [DOI] [PMC free article] [PubMed] [Google Scholar]
- Patterson, G.H. & Piston, D.W. (2000) Photobleaching in two‐photon excitation microscopy. Biophys. J. 78, 2159–2162. [DOI] [PMC free article] [PubMed] [Google Scholar]
- Paredes, R.M. , Etzler, J.C. , Watts, L.T. , Zheng, W. & Lechleiter, J.D. (2008) Chemical calcium indicators. Methods 46, 143–151. [DOI] [PMC free article] [PubMed] [Google Scholar]
- Petersen, O.H. (2013) Dyes and hardware required Measuring Calcium and Calmodulin Inside and Outside Cells (ed. by Toescu E. C. & Verkhrats A.), Springer‐Verlag, Berlin. [Google Scholar]
- Petty, H.R. (2007) Fluorescence microscopy: established and emerging methods, experimental strategies, and applications in immunology. Microsc. Res. Tech. 70, 687–709. [DOI] [PubMed] [Google Scholar]
- Plieth, C. & Hansen, U. (1996) Methodological aspects of pressure loading of fura‐2 into characean cells. J. Exp. Bot. 47, 1601–1612. [Google Scholar]
- Poole, D.P. , Amadesi, S. , Veldhuis, N.A. et al (2013) Protease‐activated receptor 2 (PAR2) protein and transient receptor potential vanilloid 4 (TRPV4) protein coupling is required for sustained inflammatory signaling. J.Biol. Chem. 288, 5790–5802. [DOI] [PMC free article] [PubMed] [Google Scholar]
- Ricken, S. , Leipziger, J. , Greger, R. & Nitschke, R. (1998) Simultaneous measurements of cytosolic and mitochondrial Ca2+ transients in HT29 cells. J. Biol. Chem. 273, 34961–34969. [DOI] [PubMed] [Google Scholar]
- Robinson, H.P.C. (1993) Periodic synchronized bursting and intracellular calcium transients elicited by low magnesium in cultured cortical neurons. J. Neurophysiol. 70, 1606–1616. [DOI] [PubMed] [Google Scholar]
- Rudolf, R. , Mongillo, M. , Rizzuto, R. & Pozzan, T. (2003) Looking forward to seeing calcium. Nat. Rev. Mol. Cell Biol. 4, 579–586. [DOI] [PubMed] [Google Scholar]
- Scanziani, M. & Häusser, M. (2009) Electrophysiology in the age of light. Nature 461, 930–939. [DOI] [PubMed] [Google Scholar]
- Sombati, S & DeLorenzo, R.J. (1995) Recurrent spontaneous seizure activity in hippocampal neuronal networks in culture. J. Neurophysiol. 73, 1706–1711. [DOI] [PubMed] [Google Scholar]
- Stutzmann, G.E. , LaFerla, F.M. & Parker, I. (2003) Ca2+ signaling in mouse cortical neurons studied by two‐photon imaging and photoreleased inositol triphosphate. J. Neurosci. 23, 758–765. [DOI] [PMC free article] [PubMed] [Google Scholar]
- Szent‐Györgyi, A G. (1975) Calcium regulation of muscle contraction. Biophys. J. 15, 707–723. [DOI] [PMC free article] [PubMed] [Google Scholar]
- Takahashi, A. , Camacho, P. , Lechleiter, J.D. & Herman, B. (1999) Measurement of intracellular calcium. Physiol. Rev. 79, 1089–1125. [DOI] [PubMed] [Google Scholar]
- Tsien, R.Y. (1999) Monitoring cell calcium Calcium as a Cellular Regulator (ed. by Carafoli E. & Klee C.B.), pp. 28–54. New York, Oxford University Press. [Google Scholar]
- Verderio, C. , Coco, S. , Fumagalli, G. & Matteoli, M. (1995) Calcium‐dependent glutamate release during neuronal development and synaptogenesis: different involvement of omega‐agatoxin IVA‐ and omega‐conotoxin GVIA‐sensitive channels. Proc. Nat. Acad. Sci. U.S.A. 92, 6449–6453. [DOI] [PMC free article] [PubMed] [Google Scholar]
- Wagenaar, D.A. (2012) An optically stabilized fast‐switching light emitting diode as a light source for functional neuroimaging. PLoS ONE 7(1), 1–7. [DOI] [PMC free article] [PubMed] [Google Scholar]
- Watson, B.O. , Nikolenko, V. & Yuste, R. (2009) Two‐photon imaging with diffractive optical elements. Front. Neural Circuits 3, 1–11 [DOI] [PMC free article] [PubMed] [Google Scholar]
- Wu, J. , Prole, D.L. , Shen, Y. et al (2014) Red fluorescent genetically encoded Ca2+ indicators for use in mitochondria and endoplasmic reticulum. Biochem. J. 464, 13–22. [DOI] [PMC free article] [PubMed] [Google Scholar]
- Xiang, L. , Ren, Y. , Cai, H. , Zhao, W. & Song, Y. (2015) MicroRNA‐132 aggravates epileptiform discharges via suppression of BDNF/TrkB signaling in cultured hippocampal neurons. Brain Res. 1622, 484–w495. [DOI] [PubMed] [Google Scholar]


