

Abstract
Multiple sclerosis (MS) is an immune mediated, inflammatory and demyelinating disease of the central nervous system (CNS). Substantial evidence points toward monocytes and macrophages playing prominent roles early in disease, mediating both pro‐ and anti‐inflammatory responses. Monocytes are subdivided into three subsets depending on the expression of CD14 and CD16, representing different stages of inflammatory activation. To investigate their involvement in MS, peripheral blood mononuclear cells from 40 patients with incipient or progressed MS and 20 healthy controls were characterized ex vivo. In MS samples, we demonstrate a highly significant increase in nonclassical monocytes (CD14+CD16++), with a concomitant significant reduction in classical monocytes (CD14++CD16−) compared with healthy controls. Also, a significant reduction in the surface expression of CD40, CD163, and CD192 was found, attributable to the upregulation of the nonclassical monocytes. In addition, significantly increased levels of human endogenous retrovirus (HERV) envelope (Env) epitopes, encoded by both HERV‐H/F and HERV‐W, were specifically found on nonclassical monocytes from patients with MS; emphasizing their involvement in MS disease. In parallel, serum and cerebrospinal fluid (CSF) samples were analyzed for soluble biomarkers of inflammation and neurodegeneration. For sCD163 versus CD163, no significant correlations were found, whereas highly significant correlations between levels of soluble neopterine and the intermediate monocyte (CD14++CD16+) population was found, as were correlations between levels of soluble osteopontin and the HERV Env expression on nonclassical monocytes. The results from this study emphasize the relevance of further focus on monocyte subsets, particularly the nonclassical monocytes in monitoring of inflammatory diseases.
Keywords: Biomarkers, ELISA, FLOW Cytometry, HERVs, monocyte subsets, monocytes, MS, multiple sclerosis
Introduction
The cause of the neuro‐inflammatory and demyelinating disease multiple sclerosis (MS) is generally assumed a complex interaction between environmental factors and genetic susceptibility. Despite extensive research, a pathognomonic biomarker for the disease has never been identified.1, 2, 3 Initially, the disease course for patients with MS is characteristically either relapsing‐remitting (RRMS) or primary progressive (PPMS). Patients who do not have spreading of neurological symptoms in both time and space are characterized as having clinically isolated syndrome (CIS), which often progresses to MS (approximately 85%).4 The diagnostic workup of MS comprise an anamnestic support for spreading of neurological symptoms, supported by magnetic resonance imaging (MRI) findings and levels of CSF/serum biomarkers such as an increased IgG index and the presence of oligoclonal bands (OCBs) in the CSF. To date, substantial efforts have been put into testing new candidate biomarker molecules in various body fluids from patients (e.g., serum/plasma, CSF, urine),5, 6 but given the complex nature of the disease, only a few candidate biomarkers have been considered as valid contributions to the diagnostic criteria of MS.7, 8 Consequently, a panel of biomarkers comprising multifactorial processes in inflammation and neuro‐degeneration may hold the best promise for earlier diagnosis and prognosis,7, 9 especially with the objective of initiating the optimal disease modifying therapy as early as possible.10
To this end, it is known that several key cell‐surface receptors involved in regulating immune function are shed from the surfaces of immune cells via the activity of metalloproteinases. This shedding is elicited by inflammatory stimuli,11, 12, 13 and the soluble forms of the receptors also exert functions.14 A combination of surface bound and secreted molecules may therefore have potential as diagnostic and prognostic markers of disease and progression.15, 16
Almost all types of immune cells have been suggested to play important roles in the pathogenesis of MS. In addition to the established focus on autoreactive T cells, substantial evidence now points towards monocytes and macrophages as prominent cell types early in disease, mediating both pro‐ and anti‐inflammatory responses.17, 18, 19 At least three distinct monocyte subsets exists in the blood, each exerting different functions by differential expression of surface and/or secreted antigens and cytokines.17 Surface expression of CD14 and CD16 are used to distinguish classical (CD14++CD16−), intermediate (CD14++CD16+), and nonclassical (CD14+CD16++) monocyte subsets,20 whereas partially overlapping subsets exists in other species, i.e., in mice based on expression of LY6Chigl/low.20 In patients with MS and in patients with a number of other chronic inflammatory diseases such as psoriasis,21 rheumatoid arthritis,22 or HIV encephalitis,23 monocytes in the peripheral blood (PB) show characteristics of being activated during periods of disease activity. The influence of the homeostasis between pro‐ and anti‐inflammatory monocyte populations on the replenishing macrophages at the site of action is not entirely clear. In the case of MS, this site is notably the CNS.24, 25
During inflammation, monocytes and macrophages perform highly important functions of antigen presentation and co‐stimulation vital to the immune‐orchestration, with key roles in T‐ and B‐cell activation and differentiation via the CD40‐CD154 interaction.26 In addition, expression of CD192 on monocytes and macrophages has been shown to be vital for migration into tissue.27
Previously we have demonstrated a significant association between levels of the sCD163 CSF/serum ratio and MS/CIS,28 as well as associations with other monocyte/macrophage related markers.9 Definite biomarkers for MS remain unidentified, and recommendations are that research in the field of MS diagnostics should be directed towards earlier and more accurate diagnosis.29 In accordance with this, we have established a panel of biomarkers illustrating essential components in MS pathogenesis focusing on known MS diagnostic properties, and association with monocyte/macrophage activity.9, 28, 30 The panel comprise well‐established MS markers of immune activation, inflammation, and neurodegeneration.31, 32, 33, 34
Additionally, expression of certain Human Endogenous Retroviruses (HERVs) is linked with neurological diseases, notably MS.35 HERVs are endogenized exogenous retroviruses, integrated in the human genome during primate evolution or earlier, thus representing a molecular link between the host genome and infectious virus. We have previously demonstrated that monocytes in PB from patients with active MS exhibit increased expression of specific HERV epitopes36, 37 accompanied by a HERV directed humoral immune response.38, 39, 40 The role of the specific subsets of monocytes in the orchestration of immune function in peripheral and CNS inflammation is, however, not fully understood.
We here present further analysis of the circulating monocytes and their subsets in newly diagnosed MS and during MS progression, with detailed analysis of HERV epitope expression as well as expression of selected soluble and surface expressed markers of activation, inflammation, and neurodegeneration.
Results
Patients included in this study represent a broad spectrum of MS disease, and both treated and nontreated patients were enrolled together with a group of healthy controls. This facilitates a pragmatic approach to the suitability of the biomarkers with the added advantage of avoiding exclusion of patients with active disease who do not respond to treatment. The study comprises twenty‐five patients with RRMS and five patients with PPMS as well as ten patients with CIS, compared to twenty healthy controls (Supplementary table 1 and Supplementary figure 1). The demographics of the cohort are presented in Supplementary table 2.
Isolated peripheral blood mononuclear cells were subjected to flow cytometric analysis, allowing characterization of the three distinct monocyte subsets as well as levels of other markers of cell signaling and activation. An example of the gating strategy used for the flow cytometric analyses is depicted in Figure 1. Examples of results from the flow cytometric analyses of monocyte subsets from representative patients with RRMS, PPMS, or CIS, and a healthy control (HC) are presented in Supplementary figure 2.
Figure 1.
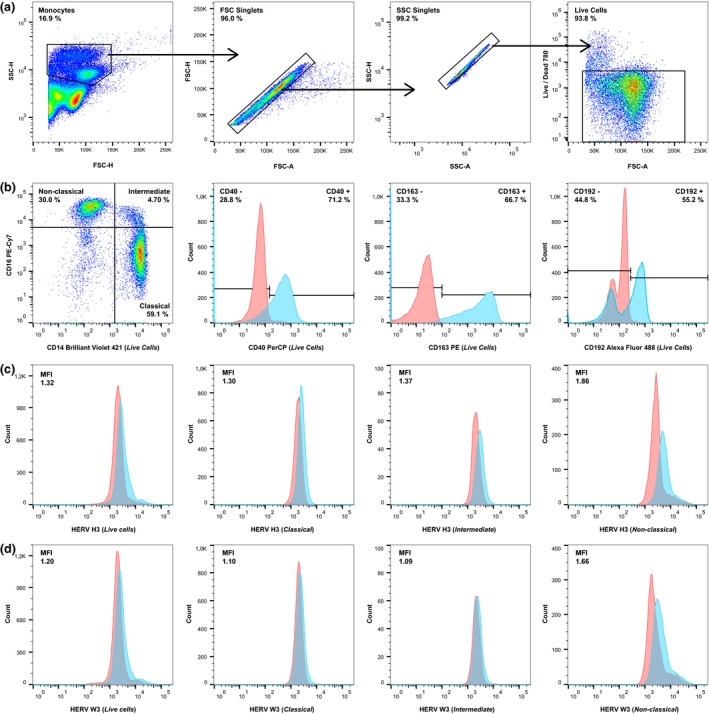
Gating strategy used in the flow cytometric analysis of patient and healthy control samples. A sample from a representative patient with RRMS was used for this figure. (a) From left to right: Total monocytes (> 20,000 events) were gated according to their size and granularity in forward scatter‐height (FSC‐H)/side scatter‐height (SSC‐H), aggregated cells were removed according to forward scatter‐area (FSC‐A)/FSC‐H and side scatter‐area (SSC‐A)/SSC‐H, and finally dead cells were removed according to staining with a LIVE/DEAD ® cell stain. (b) From left to right: The tree monocyte subsets (classical, intermediate, nonclassical) were gated on the “Live Cells” gate, as were the CD40+, CD163+, and CD192+ cells (blue). Appropriate isotype controls (red) were used to determine the unspecific antibody binding. (c, d) From left to right: Human endogenous retrovirus (HERV) expression was determined on the total monocyte population (Live cells) and the three monocyte subsets (classical, intermediate, nonclassical) by incubation with sera from rabbits immunized with HERV H3 Env (c) or HERV W3 Env (d) peptide antigens (blue) as described previously36 and with the appropriate control (pre‐immune sera) (red) to determine the median fluorescence index (MFI).
Table 1 presents median levels and range of the total number of monocytes; the CD40+, CD163+, CD192+ monocytes; the three monocyte subsets: classical, intermediate, and nonclassical; and the median fluorescence index (MFI) of HERV H3 and HERV W3 epitope expression on the three monocyte subsets.
Table 1.
Median levels and range of markers on the monocyte cell surface as determined by flow cytometric analyses for the three patient groups and the healthy control group
| Characteristics | RRMS | PPMS | CIS | HC | KW P‐value |
|---|---|---|---|---|---|
| No. of Subjects (total = 60) | n = 25 | n = 5 | n = 10 | n = 20 | (significance) |
| No. of monocytes (×1000) | 21.1 | 22.3 | 23.4 | 19.7 | 0.07 (ns) |
| (range) | (10.1–38.5) | (18.8–30.9) | (7.8–31.9) | (10.3–22.4) | ‐ |
| CD40+ % | 86.3 | 89.7 | 85.7* | 91.5* | 0.03 (*) |
| (range) | (71.2–96.8) | (82.8–94.9) | (70.5–94.4) | (86.8–97.6) | ‐ |
| CD163+ % | 84.4* | 85.1 | 87.4 | 90.9* | 0.03 (*) |
| (range) | (60.9–95.4) | (72.9–96.5) | (66.6–93.5) | (82.1–98.7) | ‐ |
| CD192+ % | 76.1* | 78.1 | 77.0 | 83.0* | 0.02 (*) |
| (range) | (49.8–89.0) | (62.4–89.0) | (40.8–86.0) | (77.9–88.7) | ‐ |
| Classical % | 74.8 | 77.4 | 72.9 | 81.6 | 0.05 (ns) |
| (range) | (54.6–89.5) | (59.4–88.4) | (44.9–87.7) | (74.1–100) | ‐ |
| Intermediate % | 4.5 | 4.5 | 3.9 | 5.2 | 0.69 (ns) |
| (range) | (1.8–22.2) | (2.4–8.6) | (2.2–17.8) | (2.1–9.1) | ‐ |
| Nonclassical % | 10.4* | 11.1 | 7.9 | 5.4* | 0.04 (*) |
| (range) | (2.0–31.7) | (2.6–23.7) | (2.3–33.7) | (2.1–10.2) | ‐ |
| HERV H3 (Classical) (MFI) | 0.92 | 1.14 | 1.11 | 1.12 | 0.68 (ns) |
| (range) | (0.56–1.41) | (0.81–1.23) | (0.70–1.32) | (0.68–1.25) | ‐ |
| HERV H3 (Intermediate) (MFI) | 0.69 | 0.89 | 0.94 | 0.96 | 0.48 (ns) |
| (range) | (0.41–1.37) | (0.60–1.06) | (0.62–1.24) | (0.50–1.22) | ‐ |
| HERV H3 (Nonclassical) (MFI) | 1.81* | 0.98 | 1.51* | 0.82* | < 0.01 (*) |
| (range) | (0.43–3.39) | (0.87–2.14) | (0.76–2.27) | (0.59–1.47) | ‐ |
| HERV W3 (Classical) (MFI) | 0.98 | 0.98 | 1.01 | 0.99 | 0.43 (ns) |
| (range) | (0.83–1.11) | (0.90–1.06) | (0.97–1.13) | (0.76–1.22) | ‐ |
| HERV W3 (Intermediate) (MFI) | 0.96 | 0.98 | 0.98 | 0.95 | 0.86 (ns) |
| (range) | (0.75–1.11) | (0.79–1.09) | (0.84–1.14) | (0.71–1.15) | ‐ |
| HERV W3 (Nonclassical) (MFI) | 1.54* | 1.16 | 1.16 | 0.92* | < 0.01 (*) |
| (range) | (0.65–1.88) | (0.84–1.69) | (0.92–1.88) | (0.72–1.67) | ‐ |
The median levels and range of the total number of monocytes, the CD40+, CD163+, CD192+ monocytes; the three monocyte subsets: classical, intermediate, and nonclassical; and of the fluorescence median index of HERV H3 Env and HERV W3 Env expression on the three monocyte subsets. Kruskal–Wallis with Dunn's multiple comparisons test (alpha = 0.05) was used to calculate significant differences, where (*) denotes significance in relation to the healthy control group. On average, fluorescent signals from more than 20.000 monocytes were collected for further analysis from each patient or healthy control (RRMS, n = 25; PPMS, n = 5; CIS, n = 10; HC, n = 20).
RRMS, relapsing‐remitting MS; PPMS, primary‐progressive MS; CIS, clinically isolated syndrome; HC, healthy controls; KW, Kruskal–Wallis; n, number of subjects; MFI, median fluorescence index, median fluorescence of immune sera/median fluorescence of appropriate control (pre‐immune sera).
As seen from Table 1, the expression of CD40 is significantly lower in the CIS group as compared to the HC group, and the expression of CD163 and CD192 is significantly lower in the RRMS group as compared to the HC group. The % nonclassical monocytes is significantly higher in the RRMS group as compared to the HC group, whereas the % of classical monocytes in all three patient groups is lower than in the HC group, the difference is not significant. Further, the expression of HERV H3 and W3 Envs is significantly higher on the nonclassical monocyte population for the RRMS patient group and notably also in the CIS group, but only for HERV H3. Kruskal–Wallis (KW) with Dunn's multiple comparisons test (α = 0.05) was used to calculate the significance of differences between groups.
Analyses of the cell surface expression of selected markers on PB monocytes were accompanied by measurements of a panel of soluble biomarkers in serum and CSF from the included patients, as presented in Table 2. The panel, which also includes the soluble form of CD163 (sCD163), comprises markers of inflammation and neurodegeneration as previously described.9
Table 2.
Median levels and range of biomarkers in serum and CSF samples as determined by ELISA for the three patient groups
| Characteristics | RRMS | PPMS | CIS | KW P‐value |
|---|---|---|---|---|
| No. of Subjects (total=60) | n = 25 | n = 5 | n = 10 | (significance) |
| sCD163 serum (mg L−1) | 1.57 | 1.35 | 1.37 | 0.49 (ns) |
| (range) | (1.07–4.29) | (1.06–3.37) | (0.68–3.03) | ‐ |
| sCD163 CSF (mg L−1) | 0.09 | 0.09 | 0.07 | 0.05 (ns) |
| (range) | (0.06–0.14) | (0.08–0.16) | (0.05–0.15) | ‐ |
| sCD163 ratio | 0.06 | 0.06 | 0.06 | 0.76 (ns) |
| (range) | (0.02–0.10) | (0.03–0.15) | (0.03–0.11) | ‐ |
| CXCL13 serum (ng L−1) | 60.6 | 42.3 | 84.6 | 0.09 (ns) |
| (range) | (27.2–250) | (38.2–148) | (42.4–292) | ‐ |
| CXCL13 CSF (ng L−1) | 12.9 | 2.46 | 2.65 | 0.30 (ns) |
| (range) | (0.00–81.1) | (0.00–31.7) | (0.00–29.3) | ‐ |
| CXCL13 ratio | 0.19 | 0.06 | 0.03 | 0.12 (ns) |
| (range) | (0.00–2.15) | (0.00–0.77) | (0.00–0.51) | ‐ |
| Neopterine serum (μg L−1) | 1.48 | 1.39 | 1.33 | 0.53 (ns) |
| (range) | (0.50–5.13) | (0.76–1.52) | (0.90–5.04) | ‐ |
| Neopterine CSF (μg L−1) | 1.11 | 1.12 | 0.75 | 0.17 (ns) |
| (range) | (0.41–2.89) | (0.58–1.18) | (0.41–1.81) | ‐ |
| Neopterine ratio | 0.71 | 0.74 | 0.55 | 0.15 (ns) |
| (range) | (0.36–1.46) | (0.41–1.47) | (0.20–0.99) | ‐ |
| Osteopontin serum (μg L−1) | 22.9* | 29.9* | 27.3 | 0.02 (*) |
| (range) | (15.0–30.4) | (19.0–82.2) | (19.1–38.1) | ‐ |
| Osteopontin CSF (μg L−1) | 81.4 | 98.6 | 64.1 | 0.31 (ns) |
| (range) | (30.3–493) | (43.3–281) | (32.4–251) | ‐ |
| Osteopontin ratio | 3.59 | 3.06 | 2.30 | 0.21 (ns) |
| (range) | (1.13–26.4) | (1.45–14.7) | (1.20–11.3) | ‐ |
| Neurofilament light CSF (μg L−1) | 0.51 | 0.56 | 0.34 | 0.14 (ns) |
| (range) | (0.10–7.59) | (0.36–1.04) | (0.19–0.99) | ‐ |
Kruskal–Wallis with Dunn's multiple comparisons test (alpha = 0.05) was used to calculate significant differences, where (*) denotes significance between the RRMS and PPMS patient groups. Samples were run in duplicates, accepting only coefficient of variation values ≤15% for each patient (RRMS, n = 25; PPMS, n = 5; CIS, n = 10).
RRMS, relapsing‐remitting MS; PPMS, primary‐progressive MS; CIS, clinically isolated syndrome; KW, Kruskal–Wallis, n, number of subjects; CSF, cerebrospinal fluid; sCD163, soluble CD163.
Table 2 shows that the median levels of sCD163 in serum and CSF tend to be higher for the RRMS patient group than for the CIS patient group, as is the sCD163 in CSF for the PPMS patient group. The median of the CXCL13 levels in CSF also tends to be higher for the RRMS patient group than for the CIS and PPMS patient group, as is the CXCL13 ratio, neopterine serum, and the osteopontin ratio, with significance for osteopontin serum only. Notably, median levels of the neurofilament light CSF also tend to be higher in the RRMS and PPMS patient group as compared to the CIS patient group. Kruskal–Wallis (KW) with Dunn's multiple comparisons test (α = 0.05) was used to calculate the significance of differences between groups. The results in Table 2 also illustrate the existing overlap in the biomarker levels for the three patient subgroups.
In Table 3, the results from the flow cytometric analysis of cell surface expressed markers were compared for the MS relevant groups: MS versus CIS, Patients versus HCs, gender (male versus female), and disease activity (yes vs. no) (estimated on the basis of the number of clinically defined attacks or a sustained increase of more than 0.5 on the expanded disability status scale (EDSS) within a follow‐up period of 11–33 months). Additionally, results were also compared for treated versus untreated patients. Mann–Whitney's U‐test were used for these categorical variables.
Table 3.
Variation in cell surface marker expression between MS relevant groups and correlations to clinical disease measures and soluble markers in serum and CSF
| Characteristics | CD40+ | CD163+ | CD192+ | Classical | Intermediate | Nonclassical | HERV H3 (Classical) | HERV H3 (Intermediate) | HERV H3 (Nonclassical) | HERV W3 (Classical) | HERV W3 (Intermediate) | HERV W3 (Nonclassical) |
|---|---|---|---|---|---|---|---|---|---|---|---|---|
| P values for Mann–Whitney's U‐test of differential expression of cell surface markers between MS relevant groups | ||||||||||||
| MS versus CIS (n = 40) | 0.57 | 0.92 | 0.99 | 0.92 | 0.94 | 0.79 | 0.32 | 0.21 | 0.87 | 0.09 | 0.47 | 0.68 |
| Level of significance | ‐ | ‐ | ‐ | ‐ | ‐ | ‐ | ‐ | ‐ | ‐ | ‐ | ‐ | ‐ |
| Patients versus HC (n = 60) | <0.01 | <0.01 | <0.01 | <0.01 | 0.26 | <0.01 | 0.64 | 0.43 | <0.01 | 0.88 | 0.58 | <0.01 |
| Level of significance | ** | ** | ** | ** | ‐ | ** | ‐ | ‐ | *** | ‐ | ‐ | *** |
| Gender (n = 60) | 0.18 | 0.56 | 0.51 | 0.59 | >0.99 | 0.24 | 0.43 | 0.64 | 0.13 | 0.45 | 0.29 | 0.05 |
| Level of significance | ‐ | ‐ | ‐ | ‐ | ‐ | ‐ | ‐ | ‐ | ‐ | ‐ | ‐ | ‐ |
| Disease activitya (n = 35) | 0.38 | 0.68 | 0.77 | 0.77 | 0.46 | 0.45 | 0.37 | 0.56 | 0.88 | 0.17 | 0.75 | 0.58 |
| Level of significance | ‐ | ‐ | ‐ | ‐ | ‐ | ‐ | ‐ | ‐ | ‐ | ‐ | ‐ | ‐ |
| Treated versus untreatedb (n = 40) | 0.44 | 0.59 | 0.86 | 0.70 | 0.03 | 0.65 | 0.44 | 0.71 | 0.53 | 0.44 | 0.53 | 0.63 |
| Level of significance | ‐ | ‐ | ‐ | ‐ | * | ‐ | ‐ | ‐ | ‐ | ‐ | ‐ | ‐ |
| Pearson's correlation coefficients, r, without and with the Bonferroni correction | ||||||||||||
| Disease durationb (n = 40) | 0.11 | −0.02 | 0.10 | 0.11 | −0.03 | −0.05 | −0.06 | −0.16 | −0.13 | −0.41 | −0.44 | −0.12 |
| Level of significance | ‐/‐ | ‐/‐ | ‐/‐ | ‐/‐ | ‐/‐ | ‐/‐ | ‐/‐ | ‐/‐ | ‐/‐ | **/‐ | **/‐ | ‐/‐ |
| sCD163 ratio (n = 40) | 0.22 | 0.17 | 0.17 | 0.14 | 0.02 | ‐0.20 | 0.12 | 0.01 | 0.06 | ‐0.11 | ‐0.33 | ‐0.14 |
| Level of significance | ‐/‐ | ‐/‐ | ‐/‐ | ‐/‐ | ‐/‐ | ‐/‐ | ‐/‐ | ‐/‐ | ‐/‐ | ‐/‐ | */‐ | ‐/‐ |
| CXCL13 serum (n = 40) | −0.33 | −0.15 | −0.25 | −0.23 | 0.03 | 0.20 | 0.15 | 0.21 | 0.12 | 0.11 | 0.06 | 0.01 |
| Level of significance | */‐ | ‐/‐ | ‐/‐ | ‐/‐ | ‐/‐ | ‐/‐ | ‐/‐ | ‐/‐ | ‐/‐ | ‐/‐ | ‐/‐ | ‐/‐ |
| CXCL13 ratio (n = 40) | 0.03 | ‐0.09 | 0.06 | 0.07 | ‐0.22 | 0.04 | ‐0.17 | ‐0.29 | ‐0.10 | ‐0.23 | ‐0.34 | ‐0.08 |
| Level of significance | ‐/‐ | ‐/‐ | ‐/‐ | ‐/‐ | ‐/‐ | ‐/‐ | ‐/‐ | ‐/‐ | ‐/‐ | ‐/‐ | */‐ | ‐/‐ |
| Neopterin serum (n = 40) | −0.38 | −0.28 | −0.66 | −0.49 | 0.74 | 0.34 | ‐0.05 | 0.12 | 0.23 | 0.03 | 0.11 | 0.21 |
| Level of significance | */‐ | ‐/‐ | ***/*** | **/‐ | ***/*** | */‐ | ‐/‐ | ‐/‐ | ‐/‐ | ‐/‐ | ‐/‐ | ‐/‐ |
| Neopterin CSF (n = 40) | −0.21 | −0.20 | −0.48 | −0.31 | 0.64 | 0.17 | −0.05 | 0.02 | 0.14 | −0.15 | −0.08 | 0.14 |
| Level of significance | ‐/‐ | ‐/‐ | **/‐ | ‐/‐ | ***/*** | ‐/‐ | ‐/‐ | ‐/‐ | ‐/‐ | ‐/‐ | ‐/‐ | ‐/‐ |
| Osteopontin CSF (n = 40) | ‐0.18 | −0.35 | ‐0.16 | ‐0.21 | −0.13 | 0.26 | −0.13 | −0.21 | 0.39 | 0.01 | 0.02 | 0.44 |
| Level of significance | ‐/‐ | */‐ | ‐/‐ | ‐/‐ | ‐/‐ | ‐/‐ | ‐/‐ | ‐/‐ | */‐ | ‐/‐ | ‐/‐ | **/‐ |
| Osteopontin ratio (n = 40) | −0.14 | −0.31 | −0.12 | −0.16 | −0.15 | 0.21 | −0.05 | −0.15 | 0.44 | 0.06 | 0.06 | 0.44 |
| Level of significance | ‐/‐ | ‐/‐ | ‐/‐ | ‐/‐ | ‐/‐ | ‐/‐ | ‐/‐ | ‐/‐ | **/‐ | ‐/‐ | ‐/‐ | **/‐ |
| Neurofilament light CSF (n = 40) | 0.03 | −0.08 | 0.05 | 0.07 | −0.19 | −0.01 | 0.20 | 0.07 | 0.34 | 0.08 | −0.11 | 0.16 |
| Level of significance | ‐/‐ | ‐/‐ | ‐/‐ | ‐/‐ | ‐/‐ | ‐/‐ | ‐/‐ | ‐/‐ | */‐ | ‐/‐ | ‐/‐ | ‐/‐ |
Calculations were made with Mann–Whitneys U‐tests and Pearson correlations. Each cell surface marker value was first compared for the five MS relevant groups: MS (n = 30) versus CIS (n = 10); Patients (n = 40) versus HC (n = 20); Gender, male (n = 11) versus female (n = 49); Disease activity, yes (n = 22) versus no (n = 13); and Treated (n = 13) versus untreated (n = 27). Then, each cell surface marker was correlated with levels of clinical disease measures, and soluble biomarkers in serum and CSF from the included patients (see Supplementary table 3 for all correlations). The P values of the Mann–Whitneys U‐test and the r values of the Pearson correlations are shown with levels of significance: *<0.05, **<0.01, and ***<0.001.
CD40+, CD163+, CD192+ positive monocytes, respectively; the three monocyte subsets: Classical, intermediate, and nonclassical, respectively; and HERV H3 Env and HERV W3 Env expression on each of the three monocyte subsets. RRMS, relapsing‐remitting MS; PPMS, primary‐progressive MS; CIS clinically isolated syndrome; HC, healthy controls, n, number of subjects. In the Pearson correlations, only markers with a statistically significant coefficient are shown.
Disease activity was estimated on the basis of the number of clinically defined attacks or a sustained increase of more than 0.5 in the EDSS scale within a follow‐up period of 11–33 months (median = 23).
Stratification for treatment: Individuals receiving immune‐modulating therapy in connection with the sampling were categorized as treated, otherwise untreated.
Disease duration (in months): the period of time from debut of first symptom(s) to sampling.
From Table 3 it is evident that regulation of expression of several of the surface markers differ significantly between patients in general (MS + CIS), and the healthy control group. There are, however, no apparently significant differences between the patients with MS and CIS or between males and females, or in disease activity. These results indicate that an activation of the peripheral immune system also occurs in most patients with CIS, and notably, the expression of the HERV epitopes (HERV H3 Env and W3 Env) is highly significantly upregulated on nonclassical monocytes in patients compared to HC.
Further, results from the flow cytometric analysis of cell surface expressed markers were correlated with levels of clinical disease measures and soluble biomarkers in serum and CSF from the included patients (Table 3; see Supplementary table 3 for all correlations). Pearson correlations were used for these continuous variables. A significantly high correlation between neopterin in serum and CSF and intermediate monocytes is evident, as is a significantly high correlation with the CD192 expression. Also, osteopontin levels correlate significantly to the expression of HERV epitopes on the nonclassical monocyte population.
These observations combined highlight the importance of quantifying the three monocyte populations in disease monitoring as up‐ and downregulation of these subtypes are indicators of active disease in all three patient groups (RRMS, PPMS, and CIS). No distinctive correlations were demonstrated for the other soluble biomarkers, or for the clinical measures of the number of attacks, the EDSS score, the time since last attack, the IgG index, or the total number of MRI white matter lesions (Supplementary table 3).
To increase the statistical power of the subsequent analyses presented below, we compiled all three patient groups, as the separate groups are relative small, and appear comparable in the previous analyses.
To further investigate the role of expressed cell surface markers, we directly compared the entire patient group to the HC group. Differences in median levels of the three selected cell surface markers CD40, CD163, and CD192 and median levels of the three monocyte subsets were highlighted as Fold Change by normalization to the median HC levels. In Figure 2 the fold change in the cell surface markers and monocyte subsets are presented with significance levels (Mann–Whitney U‐test).
Figure 2.
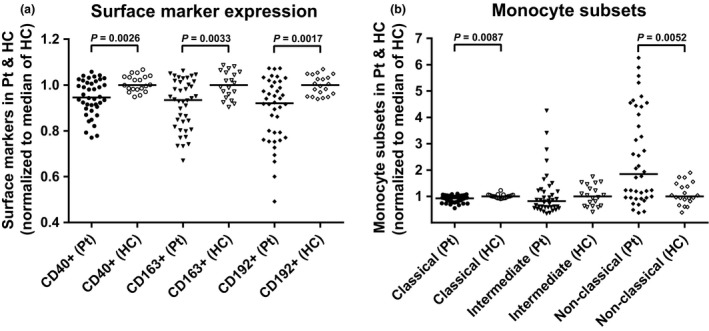
Differences in the expression of CD40, CD163, CD192, and of the three monocyte subsets in the patient group normalised to the median of the healthy controls. The differences in expression of CD40, CD163, and CD192 on the total monocyte population (Live cells, Figure 1) (a) and the three monocyte sub‐populations; classical, intermediate, and nonclassical (b) were determined as % positive cells of the monocytes, divided by the respective median levels of the healthy control samples to give the fold change. Bars represent the median of the populations and braces indicate a significant difference (Mann–Whitney U‐test) between the median of the patient group (n = 40) and the median of the healthy control group (n = 20). P‐values are listed. Pt, patients; HC, healthy controls.
The differences in median expression of CD40, CD163, and CD192 are highly significant for the patient group compared to the HC group. These differences manifests as downregulation of all three surface markers (Figure 2A). A similar pattern emerges for the classical monocytes, whereas the nonclassical monocytes are significantly upregulated in the patient group (Figure 2B). Detailed expression pattern analysis for each patient (not shown), clearly show that the increase in the nonclassical monocyte population is directly linked to the downregulation of the classical monocyte population, and also to the concomitant downregulation of CD40, CD163, and of CD192. To support this, the CD40, CD163, and CD192 expression were analyzed for the three monocyte subsets (Supplementary figure 3) confirming that the downregulation of the surface markers is primarily attributable to the increased number of nonclassical monocytes (Table 1). Expression of CD163 and CD192 is also significantly lower on the intermediate monocyte population, but the contribution to the overall expression is low due to the small population size. Notably, the expression of CD40 on the intermediate monocytes is actually significantly higher than on the classical and nonclassical monocytes, emphasizing their small contribution to the total monocyte expression. Thus, it appears that in the present patient cohort, the major players in the over‐all downregulation of CD40, CD163, and of CD192 are the nonclassical monocytes.
To further explore the nature of the increased HERV H3 Env and HERV W3 Env expression on monocytes, we also analyzed the potential differential expression of the two HERV Env epitopes on the three monocyte subsets. Figure 3 shows the median fluorescence indices of HERV expression on monocyte subsets from the entire patient group compared to the HC group. A highly significant upregulation of expression of both HERV H3 Env and HERV W3 Env on the nonclassical monocytes is evident. For individual patient samples a high degree of co‐expression of HERV H3 Env (median: 1.80, Figure 3) and HERV W3 Env (median: 1.36, Figure 3) is evident. Thus, in the patient group, the nonclassical monocytes with upregulated expression of HERV Envs are also the monocyte subset with downregulation of CD40, CD163, and CD192 expression.
Figure 3.
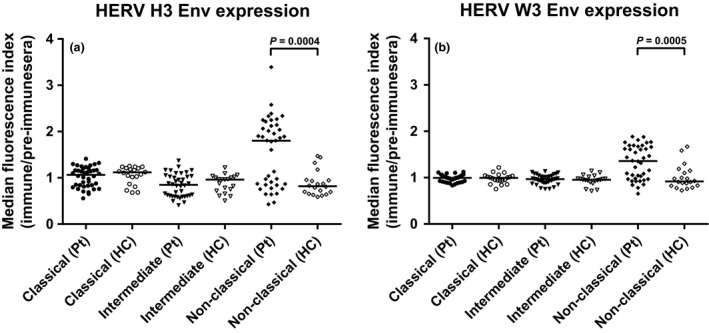
Differences in the expression of HERV H3 Env and HERV W3 Env on the three monocyte subsets in the patient group and the HC group. The differences in expression of HERV H3 Env (a) and HERV W3 Env (b) on the three monocyte subsets; classical, intermediate, and nonclassical were determined as the median fluorescence index by calculating the median fluorescence for each sample and dividing by the median fluorescence of the appropriate control (pre‐immune sera). Bars represent the median of the subsets and braces indicate a significant difference (Mann–Whitney U‐test) between the median of the patient group (n = 40) and the median of the HC group (n = 20). P‐values are listed. Pt, patients, HC, healthy controls.
To explore the biomarker potential of the cell surface markers investigated in the flow cytometric analysis, a logistic regression analysis with receiver operating characteristic (ROC) curve output for each contribution of the parameters was performed. Figure 4 shows the ROC curves with the area under the curve (AUC) as a measure of their respective discriminatory power. As seen from the graphs, the discriminatory power of the CD40+, CD163+, CD192+, classical, intermediate, nonclassical, HERV H3 (nonclassical), and HERV W3 (nonclassical) populations are higher than 70% and thus are fair markers of disease, as defined by Xia et al..10 When all contributions are combined the discriminatory power is 87% (95% CI: 0.78–0.95); 9% higher than any of the individual contributions. Notably, the contributions from both the HERV H3 Env, and HERV W3 Env (nonclassical), are higher than 75% and combined amounts to 79% (95% CI: 0.68–0.90).
Figure 4.
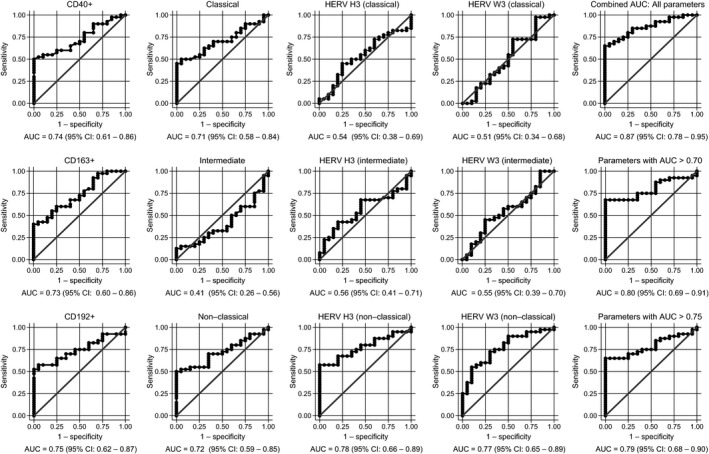
Logistic regression analyses with ROC curve output of patients with CIS or MS plotted against the HC group. AUC, with 95% CI, is given for each parameter. The surface expression of each parameter for patients with CIS or MS (n = 40) are combined as true positives and plotted against HC as true negatives (n = 20). The diagonal dividing the ROC space represents the random event. A logistic regression analysis with combined parameter results has been performed for “all parameters”, parameters with AUC > 0.70, and AUC > 0.75. ROC, receiver operating characteristic; AUC, Area under the curve; RRMS, relapsing‐remitting MS; PPMS, primary‐progressive MS; CIS, clinically isolated syndrome; HCs,healthy controls.
As the study cohort comprise patients with newly diagnosed and progressed CIS/MS, a similar analysis were performed for these groups as well, as presented in Supplementary figures 4 and 5, respectively. The discriminatory power of the cell surface markers in the group of newly diagnosed patients is generally higher than for the patient group with progressed CIS/MS, however, no distinctive differences were evident.
Also, as the patient group comprises treated and untreated patients, a similar analysis was performed for the treated and untreated patients, as presented in Supplementary figures 6 and 7, respectively. The discriminatory power of the cell surface markers in the group of treated patients generally resembles that for the patients group with untreated CIS or MS.
Discussion
Characterization of the monocyte subsets in MS facilitates important insight into disease mechanisms and potential therapeutic targets as the inflammatory macrophages and other activated immune cells harbored in the demyelinating lesions in the CNS are recruited from the PB.
The most recent successful therapeutic strategies involve highly specific depletion of PB cell populations such as B cells (rituximab41 and ocrelizumab42) or prevents activated T cells from entering into the CNS (natalizumab43). A similar strategy targeting monocytes or myeloid lineage cells may also have potential in MS therapy. A recent trial of patients with ulcerative colitis treated with adsorptive granulocyte/monocyte apheresis (GMA) showed a beneficial outcome for a subgroup of these patients.44
In this study, we have analyzed the composition of monocyte subsets and selected monocyte and inflammation related cell surface markers in incipient and progressed MS. The monocyte subsets differ in function and exhibit differential expression of surface and/or secreted antigens and cytokines.17 Here, we demonstrate a significant expansion of the CD16+ monocyte population in patients with MS compared to healthy controls, and according to established nomenclature,45 we present strong indications that this expansion is primarily attributable to the nonclassical monocyte population. This is accompanied by a proportionate reduction in the classical monocyte population and supports the notion that the nonclassical population is a differentiated form of the classical.20 Thus, depletion of nonclassical monocytes from PB may act as an alternative to T‐ and B‐cell depletion with the increased advantage of leaving the major classical monocyte population untouched and able to react toward new infection or perhaps reactivation of previous infections, which established regimens are troubled with. Alternatively, selective subset depletion of monocytes may act as a supplement to existing therapies to further increase the therapeutic efficacy.
Studies in other chronic inflammatory diseases have also demonstrated expansion of the CD16+ monocyte population21, 22, 46 further stressing the importance of the nonclassical monocyte population in MS inflammation.
For the inflammation‐related cell surface markers, we find a significant downregulation of CD40, CD163, and CD192 on the entire monocyte population in patients compared to healthy controls. This can be attributed to the upregulation of the nonclassical population as the nonclassical monocytes exhibit very low or no expression of CD40, CD163, and CD192 (Supplementary figure 3). Previous reports of surface marker expression on inflammatory monocyte populations have been mixed due to the relative recent distinction between intermediate and nonclassical monocytes,17 but levels of CD40 and CD192 expression have generally been reported as higher in MS compared to controls,47 notably in treated patients.48 Also, a recent study analyzed monocyte subsets in the peripheral blood and CSF in a cohort of newly diagnosed patients with MS or CIS24 and found functionally competent but reduced numbers of intermediate and nonclassical monocytes in treatment‐naïve patients, and increased numbers in treated patients compared to healthy controls. This apparent discrepancy is most likely due to the composition of the different patient cohorts, and reflects an important point of disease heterogeneity.
The expression of CD163 on monocytes and macrophages in inflammatory diseases has been shown to be high,49 whereas in MS a downregulation on the membrane CD163 in PB and an upregulation of the soluble CD163 in plasma has been reported.11
Accordingly, in our study the concomitant reduction in surface expressed CD40, CD163 and CD192 point toward a common mechanism of regulation. As previously reported11, 12, 13 CD163 and other surface receptors are shed from the surface of activated monocyte populations by the action of metalloproteinases, and levels of, e.g., sCD163 inversely correlates to levels of surface expressed CD163.11 We suggest that this indicates that a common shedding mechanism for surface expressed receptors such as CD40, CD163, and CD192 may exist, acting as a regulatory mechanism, limiting this otherwise highly proinflammatory monocyte population from migration and co‐activation. One likely candidate for this common shedding is the tumor necrosis factor‐α‐converting enzyme that have been shown to cleave CD4050 and CD163,13 but other metalloproteinases may contribute to this as well.12
In this study we also evaluated correlations of the cell surface markers to clinical measures of disease as well as selected markers of inflammation and neurodegeneration in serum and CSF.
A significantly high correlation between neopterin in serum and CSF and the intermediate monocytes is demonstrated, as is a significantly high correlation with the CD192+ expression. An explanation may be that, even though the intermediate monocyte population in general is very small, cytokines are highly expressed by this subset.20, 51 Also, as previously demonstrated,11 there was no correlation between mCD163 and sCD163 for the patient group, even though such correlation exists in a variety of patients.52 One explanation may be that in MS, sCD163 is produced in the CNS in high amounts shielding this otherwise direct relationship.
The CD163 ratio in this study was 0.06 for all patient groups, nicely in accordance with the result published in our previous study.28 Further, osteopontin levels correlate significantly to the expression of HERV epitopes on the nonclassical monocyte population, substantiating a specific role for this particular monocyte subset.
The specific upregulation of expression of HERVs in MS has recently been documented by several research teams (reviewed 35, 53, 54). Notably, members of two HERV families, HERV‐H/F and HERV‐W/MSRV, are specifically associated with MS and proposed to be involved in both the risk and the course of the disease. HERV contributes to the numerous genetic risk factors for MS as a specific HERV locus (HERV‐H/Fc1) on the X chromosome, with a confirmed significant odds ratio for carriers of the risk‐allele.55 Further, expression of HERV‐H/F and HERV‐W/MSRV is activated in MS, and levels of HERV RNA and HERV antigens are increased in the circulation. This expression is notably localized to monocytes and B cells in circulation,36, 40, 56 and also in MS brain.57, 58 Both the humoral and cell‐mediated immune responses to certain HERVs are elevated/increased in MS, particularly in active MS,59 and the target epitopes – HERV antigens – exhibit elevated expression levels on PBMCs from patients with MS in flow cytometric studies.36, 37, 56 It is presently not known whether the activated HERVs primarily contribute to driving the inflammation in MS or vice versa, however, it is established that monocyte activation/differentiation impacts retroviral activation.60 Numerous factors (notably concurrent activity of members of the herpesvirus family and cytokines) interacts with HERV expression,61 and it is also established that HERV Env antigens, as such, have pathogenic potential.62 Notably, at the level of epigenetic regulation, it has been shown that at least parts of the transcriptional reactivations inherent in MS pathogenesis may be explained by a deficiency in a specific mechanism involving heterochromatin protein HP1a for transcriptional repression.63 This has also been found to be responsible for the de‐repressing activity of promoters of both certain HERVs and proinflammatory cytokines such as TNF‐α.63
Our exploration of the upregulation of HERV expression on monocytes in MS confirmed previous findings overall and now also clearly define that this upregulation (for both HERV H3 and HERV W3) primarily occurs in the nonclassical monocytes. This further delineates a potential role for HERVs in the immune dysregulation of MS. In a retroviral context, a recent study of the exogenous retrovirus HIV demonstrated dynamic changes in monocyte subpopulations in acute and chronic HIV infection and showed perturbations in monocyte subpopulations with a significantly higher frequency of nonclassical monocytes in treatment‐naive chronically infected HIV patients compared with treated patients.51 A potential role for HERV‐H/F and HERV‐W/MSRV expression as biomarkers for MS prognostics and disease activity has recently been suggested,39 and this study further substantiates the potential of HERVs as biomarkers in MS diagnostics.
To explore the biomarker potential of the investigated cell surface markers, a logistic regression analysis with ROC curve output for each cell surface marker as well as the combined contribution of all the parameters was performed. The discriminatory powers of the CD40+, CD163+, CD192+, classical, nonclassical, HERV H3 (nonclassical), and HERV W3 (nonclassical) monocyte populations are higher than 70%, and when all contributions are combined the discriminatory power is 87%. Notably, the contributions from the HERV H3 Env (nonclassical), and HERV W3 Env (nonclassical) monocytes are higher than 75% and combined amounts to 79%. These markers could thus be classified as fair or good markers of disease with a performance comparable to the soluble biomarkers we have analyzed previously.9, 28
As the study cohort comprise patients with newly diagnosed and progressed MS, similar analyses were performed for these groups as well (Supplementary figures 4 and 5). The discriminatory power of the cell surface markers in the group of newly diagnosed patients is generally higher than for the patient group with progressed MS. Notably, the combined contribution of the individual markers amounts to 1.0 and could thus be categorized as excellent markers of disease (AUC = 0.9–1.0).10 However, an AUC of 1.0 likely reflects that the probability of finding a random association between a given biomarker and the outcome increases with the total number of comparisons,10 and that great care must be taken when multiple contributions are combined into a single parameter.
Finally, as the patient group comprise both treated and untreated patients, a similar analysis was performed for the treated and untreated patients (Supplementary figures 6 and 7). The discriminatory power of the cell surface markers in the group of treated patients resembles that for the patients group with untreated CIS and MS, and is likely due to the presence of patients that do not respond to treatment. One could speculate that the activation patterns of the immune system of these individual patients resemble that of newly diagnosed untreated individuals.
The biomarker panel investigated in this study thus performs comparably well in relation to previously studied panels in discriminating MS/CIS from HCs, with a notable contribution from the increased HERV expression on the nonclassical monocyte subset.
Taken together, the presented results of increased nonclassical monocyte populations, changes in expressed inflammation‐related cell surface markers, as well as the upregulation of specific HERV epitopes on these subsets are particularly interesting in MS as these activated monocytes may eventually be recruited to plaque formations in the CNS.25 This could potentially be one of the reasons for the recurrent or continued inflammatory activity, as the monocyte/macrophages may be carrying the inflammatory stimuli to the CNS themselves.
The diagnostic potential of the surface markers presented are in general fair, and combined has a good discriminating capability of patients versus healthy controls regardless of the patient group comprise both newly diagnosed and progressed MS as well as treated and untreated patients. Finally, the results also support that multifactorial diseases such as MS are only possible to describe by a combination of biomarkers, and that further investigations of biomarker panels should be performed.
Methods
Ethics statement
The study was conducted in accordance with the Ethical Declaration of Helsinki and all patients gave written, informed consent. The study and the material for informed consent were approved by The Central Denmark Region Committee on Biomedical Research Ethics (journal number: 20090210).
Patients and controls
Patients admitted to the MS clinic, Department of Neurology, Aarhus University Hospital were consecutively included from September 2012 to November 2013. In addition, patients previously included in a long‐term project were invited to participate with a follow‐up investigation. A full diagnostic work‐up included medical history, clinical examination, MRI of the entire neural axis, CSF analyses (cells, protein, immunoglobulin G (IgG) index), and evoked potentials as recommended.8 CSF and MRI examination were evaluated according to the revised MacDonald criteria8 and an EDSS (expanded disability status scale) score was assessed according to Kurtzke.64 Mean total number of MRI white matter lesions were registered by fluid‐attenuated inversion recovery (FLAIR) sequences on MRI.
Healthy Controls (HC), matched to patients with CIS and MS in 1:2 with age and gender, were recruited from the local area. The HCs had no medical history of inflammatory, neurodegenerative, or autoimmune disease. Demographics and paraclinical findings of patients with CIS and MS and HCs are summarized in Supplementary table 2. Disease activity was estimated on the basis of the number of clinically defined attacks or a sustained increase of more than 0.5 in the EDSS scale within a follow‐up period of 11–33 months (median = 23). Stratification for treatment: Individuals receiving immune‐modulating therapy in connection with the sampling were categorized as treated, otherwise untreated. In total 40 patients and 20 healthy controls agreed to participate in this study and in accordance with consensus guidelines65 serum and CSF were frozen at −70°C until use, as well as whole mononuclear cells, that were isolated from peripheral blood and frozen at −150°C until use. None of the patients in the cohort received steroids (methylprednisolone) at least 1 month prior sampling.
PBMC isolation
PBMCs were isolated from heparinized whole blood using Ficoll‐Paque Plus (Amersham Bioscience, SE, 17‐1440‐02) the same day it was drawn. Briefly, 25 mL heparinized whole blood was mixed with 25 mL phosphate‐buffered saline (PBS) (Sigma, UK, D8537) and layered on top of 20 mL Ficoll‐Paque. The gradient was centrifuged at 750g for 25 min at RT, and the PBMC were collected from the interface. Once isolated, PBMCs were washed three times with 20 mL PBS and centrifuged at 450g for 15 min, 280g for 10 min, and finally at 190g at 10 min, to remove the sugar gradient and impurities. PBMCs were frozen in RPMI 1640 (BioWhittaker, Verviers, BE, BE12‐702F) supplemented with 20% (heat inactivated and sterile filtrated) human serum, and 10% dimethyl sulfoxide (Sigma, FR, D4540). Before use, a portion of frozen PBMCs was quickly thawed (37°C), washed once in 10 mL RPMI‐1640 medium containing 10 mmol L−1 HEPES, 0.03% w/v glutamine, 0.2 mio i.u L−1 penicillin‐streptomycin, and 10% (heat inactivated and sterile filtrated) human serum, and resuspended to a concentration of 5 × 10⁶ cells mL−1.
FLOW analysis
Each sample was labeled with a study ID and assayed in a manner blinded to the clinical status of the patients. Samples were labeled by incubating with a mixture of different monoclonal antibodies for 30 min in the dark at 4°C, washed twice in PBS (pH 7.4), and finally resuspended in 100 μL PBS. The following monoclonal mouse antibodies were used to stain 0.5E + 06 PBMCs in 100 μL PBS: 5 μL Anti‐CD14 Brilliant Violet 421 (BD, USA, clone MϕP9, IgG2b, #563743), 10 μL anti‐CD16 PC7 (Beckman Coulter, Bree, USA, clone 3G8, IgG1, #6607118), 5 μL anti‐CD40 PerCP (eBioscience, San Diego, USA, clone 5C3, IgG1, #46‐0409), 1 μL anti‐CD163 PE (Trillium Diagnostics, USA, clone Mac2‐158, IgG1, #CD163‐158P,), and 5 μL anti‐CD192 FITC (BioLegend, San Diego, USA, clone K036C2, IgG2a, #357216) as well as the amine reactive reagent LIVE/DEAD® Fixable Near‐IR Dead Cell Stain (Life Technologies, Eugene, USA, #L10119).
For detection of HERV H3 and HERV W3 expression, the polyclonal antisera were raised as previously described.36 Briefly, polyclonal antibodies against a HERV‐H/F Env peptide epitope (HERV H3) and a HERV‐W/MSRV Env peptide epitope (HERV W3 were raised in New Zealand White rabbits. The peptide epitopes are localized at equivalent positions in ORFs at the respective HERV loci. Both peptides and antisera were by Sigma Genosys (UK). Pre‐immune sera (used as controls) were collected from all rabbits before immunization. Antibody binding to target cells was visualized using goat anti‐rabbit Alexa 488 (Life Techonologies, #A‐11034)
Flow cytometric analyses were performed using an LSRFortessa (BD, San Jose, USA) equipped with four lasers, a violet (405 nm), blue (488 nm), yellow (561 nm), and red (640 nm). FlowJo software version 10.0.7 (FlowJo LLC, Ashland, USA) was used for data analysis. More than 20.000 events were collected for further analysis. All of the flow data for each marker were collected in one run. Appropriate fluorescence minus one (FMO) controls were made to validate the compensation matrices (not shown).
Elisa
Levels of sCD163, CXCL13, neopterine, and osteopontine were analyzed in both serum and CSF and levels of neurofilament light were only analyzed in CSF. Enzyme‐linked immunosorbent assays (ELISA) were used and instructions given by the manufacturers were generally followed. The available kits for neurofilament light at the time of analysis were restricted for use with CSF only. Samples were run in duplicates, accepting only coefficient of variation values ≤15%. Intra assay variations were calculated from six measurements of a known standard on each plate and values ≤15% were accepted. Samples with values exceeding the highest point of the standard curve were diluted and reanalyzed. Each sample were labeled with a study ID and assayed in a manner blinded to the clinical status of the patients.
CXCL13 levels (R&D Systems, Minneapolis, USA, DCX130) were measured by adding 100 μL assay diluent and 50 μL of sample to each well, followed by 200 μL enzyme conjugate (mAb‐HPR), and 200 μL substrate solution (TMB). Finally, 50 μL of stop solution (H2SO4) were added and the absorbance was measured on an ELISA plate reader (Thermo Scientific, Multiscan FC, Shanghai, CN) at 450 and 540 nm. Concentrations were calculated by linear regression in Excel.
Neopterine levels (IBL Int. GMBH, Hamburg, DE, RE59321) were measured by adding 100 μL enzyme conjugate, 20 μL of sample, and 50 μL of neopterine antiserum (pAb‐HPR) to each well, followed by 150 μL of substrate solution (TMB). Finally, 150 μL of stop solution (H2SO4) were added, and the absorbance was measured on an ELISA plate reader (Thermo Scientific, Multiscan FC) at 450 and 620 nm. Concentrations were calculated by 4‐parametric statistical regression in GraphPad Prism.
Neurofilament light (NF‐light) (UmanDiagnostics, Umea, SE, UD51001) levels were measured by adding 50 μL sample dilution buffer and 50 μL of sample to each well, followed by 100 μL of tracer (mAb). Then, 100 μL enzyme conjugate (HRP) were added, followed by 100 μL substrate solution (TMB) and finally 50 μL of stop solution (H2SO4). The absorbance was measured on an ELISA plate reader (Thermo Scientific, Multiscan FC) at 450 and 540 nm. Concentrations were calculated by 4‐parametric statistical regression in GraphPad Prism.
Osteopontine levels (R&D Systems, Minneapolis, USA, DOST00) were measured by adding 100 μL assay diluent and 50 μL of sample (diluted 1:25) to each well, followed by 200 μL of conjugate (pAb‐HPR). Then, 200 μL substrate solution (TMB) were added and finally 50 μL of stop solution (H2SO4). Absorbance was measured on an ELISA plate reader (Thermo Scientific, Multiscan FC) at 450 and 540 nm, and concentrations were calculated by 4‐parametric statistical regression in GraphPad Prism. The manufacturer comments that osteopontine levels in serum are validated but may be reduced as a consequence of proteolytic cleavage during clotting.
All sCD163 measurements were performed at the Department of Clinical Biochemistry, Aarhus University Hospital in samples that had been frozen at −70°C.
The concentration of sCD163 was determined in duplicate by an in‐house sandwich ELISA using a BEP‐2000 ELISA‐analyzer (Dade Behring, Eschborn, Germany) essentially as previously described,66 accepting coefficient of variation values ≤15%. Control samples with specified acceptance criteria and serum standards with concentrations that ranged from 6.25 to 200 μg L−1 were included in each run.
Collection of data and statistical analysis
Data were stored and handled according to the Danish law on personal data. During collection of demographic and biochemical data we used the Electronic Patient Journal (EPJ). Descriptions of MRI data was conducted by a neuro‐radiologist and confirmed by a senior neurologist who viewed all scans in the IMPAX system at the Department of Neurology, AUH.
For data collection we used FlowJo and Excel (Microsoft, USA) and all statistical analysis was performed using STATA13 (StataCorp LLC, Texas, USA).
Conflict of Interest
The authors have nothing to disclose.
Supporting information
Acknowledgments
We thank laboratory technician Helle Ryom for excellent practical support. We thank everyone at the MS clinic at the Department of Neurology, Aarhus University Hospital.
We gratefully acknowledge the financial support from The Graduate School of Health, Aarhus University, The Danish Multiple Sclerosis Society, The Riisfort Foundation, Aase and Einar Danielsen's Foundation, The Jascha Foundation, and Dagmar Marshalls Fond.
We are indebted to the FACS core facility at the Department of Biomedicine, Aarhus University, for expert advice and support for the flow cytometric analyses.
References
- 1. Pan G, Simpson S Jr, van der Mei I, et al Role of genetic susceptibility variants in predicting clinical course in multiple sclerosis: a cohort study. J Neurol Neurosurg Psychiatry 2016; 87: 1204–1211. [DOI] [PubMed] [Google Scholar]
- 2. Dendrou CA, Fugger L, Friese MA. Immunopathology of multiple sclerosis. Nat Rev Immunol 2015; 15: 545–558. [DOI] [PubMed] [Google Scholar]
- 3. Compston A, Coles A. Multiple sclerosis. Lancet 2008; 372: 1502–1517. [DOI] [PubMed] [Google Scholar]
- 4. Miller D, Barkhof F, Montalban X, et al Clinically isolated syndromes suggestive of multiple sclerosis, part 1: natural history, pathogenesis, diagnosis, and prognosis. Lancet Neurol 2005; 4: 281–288. [DOI] [PubMed] [Google Scholar]
- 5. Harris VK, Sadiq SA. Disease biomarkers in multiple sclerosis potential for use in therapeutic decision making. Mol Diagn Ther 2009; 13: 225–244. [DOI] [PubMed] [Google Scholar]
- 6. Nielsen HH, Beck HC, Kristensen LP, et al The urine proteome profile is different in neuromyelitis optica compared to multiple sclerosis: a clinical proteome study. PLoS ONE 2015; 10: e0139659. [DOI] [PMC free article] [PubMed] [Google Scholar]
- 7. Housley WJ, Pitt D, Hafler DA. Biomarkers in multiple sclerosis. Clin Immunol 2015; 161: 51–58. [DOI] [PubMed] [Google Scholar]
- 8. Polman CH, Reingold SC, Banwell B, et al Diagnostic criteria for multiple sclerosis: 2010 revisions to the McDonald criteria. Ann Neurol 2011; 69: 292–302. [DOI] [PMC free article] [PubMed] [Google Scholar]
- 9. Stilund M, Gjelstrup MC, Petersen T, et al Biomarkers of inflammation and axonal degeneration/damage in patients with newly diagnosed multiple sclerosis: contributions of the soluble CD163 CSF/serum ratio to a biomarker panel. PLoS ONE 2015; 10: e0119681. [DOI] [PMC free article] [PubMed] [Google Scholar]
- 10. Xia J, Broadhurst DI, Wilson M, et al Translational biomarker discovery in clinical metabolomics: an introductory tutorial. Metabolomics 2013; 9: 280–299. [DOI] [PMC free article] [PubMed] [Google Scholar]
- 11. Fabriek BO, Moller HJ, Vloet RP, et al Proteolytic shedding of the macrophage scavenger receptor CD163 in multiple sclerosis. J Neuroimmunol 2007; 187: 179–186. [DOI] [PubMed] [Google Scholar]
- 12. Bar‐Or A, Nuttall RK, Duddy M, et al Analyses of all matrix metalloproteinase members in leukocytes emphasize monocytes as major inflammatory mediators in multiple sclerosis. Brain 2003; 126: 2738–2749. [DOI] [PubMed] [Google Scholar]
- 13. Etzerodt A, Rasmussen MR, Svendsen P, et al Structural basis for inflammation‐driven shedding of CD163 ectodomain and tumor necrosis factor‐alpha in macrophages. J Biol Chem 2014; 289: 778–788. [DOI] [PMC free article] [PubMed] [Google Scholar]
- 14. Moller HJ. Soluble CD163. Scand J Clin Lab Invest 2012; 72: 1–13. [DOI] [PubMed] [Google Scholar]
- 15. Kjaergaard AG, Rodgaard‐Hansen S, Dige A, et al Monocyte expression and soluble levels of the haemoglobin receptor (CD163/sCD163) and the mannose receptor (MR/sMR) in septic and critically ill non‐septic ICU patients. PLoS ONE 2014; 9: e92331. [DOI] [PMC free article] [PubMed] [Google Scholar]
- 16. Chitadze G, Lettau M, Bhat J, et al Shedding of endogenous MHC class I‐related chain molecules A and B from different human tumor entities: heterogeneous involvement of the “a disintegrin and metalloproteases” 10 and 17. Int J Cancer 2013; 133: 1557–1566. [DOI] [PubMed] [Google Scholar]
- 17. Wong KL, Yeap WH, Tai JJY, et al The three human monocyte subsets: implications for health and disease. Immunol Res 2012; 53: 41–57. [DOI] [PubMed] [Google Scholar]
- 18. Miron VE, Boyd A, Zhao JW, et al M2 microglia and macrophages drive oligodendrocyte differentiation during CNS remyelination. Nat Neurosci 2013; 16: U1211–U1275. [DOI] [PMC free article] [PubMed] [Google Scholar]
- 19. Vogel DY, Vereyken EJ, Glim JE, et al Macrophages in inflammatory multiple sclerosis lesions have an intermediate activation status. J Neuroinflammation 2013; 10: 35. [DOI] [PMC free article] [PubMed] [Google Scholar]
- 20. Ziegler‐Heitbrock L. Blood monocytes and their subsets: established features and open questions. Front Immunol 2015; 6: 423. [DOI] [PMC free article] [PubMed] [Google Scholar]
- 21. Kouris A, Pistiki A, Katoulis A, et al Proinflammatory cytokine responses in patients with psoriasis. Eur Cytokine Netw 2014; 25: 63–68. [DOI] [PubMed] [Google Scholar]
- 22. Kawanaka N, Yamamura M, Aita T, et al CD14+, CD16+ blood monocytes and joint inflammation in rheumatoid arthritis. Arthritis Rheum 2002; 46: 2578–2586. [DOI] [PubMed] [Google Scholar]
- 23. Burdo TH, Soulas C, Orzechowski K, et al Increased monocyte turnover from bone marrow correlates with severity of SIV encephalitis and CD163 levels in plasma. PLoS Pathog 2010; 6: e1000842. [DOI] [PMC free article] [PubMed] [Google Scholar]
- 24. Waschbisch A, Schroder S, Schraudner D, et al Pivotal role for CD16+ monocytes in immune surveillance of the central nervous system. J Immunol 2016; 196:1558–1567. [DOI] [PubMed] [Google Scholar]
- 25. Ashhurst TM, Vreden CV, Niewold P, et al The plasticity of inflammatory monocyte responses to the inflamed central nervous system. Cell Immunol 2014; 291: 49–57. [DOI] [PMC free article] [PubMed] [Google Scholar]
- 26. Chitnis T, Khoury SJ. Role of costimulatory pathways in the pathogenesis of multiple sclerosis and experimental autoimmune encephalomyelitis. J Allergy Clin Immunol 2003; 112: 837–849. [DOI] [PubMed] [Google Scholar]
- 27. Shi C, Pamer EG. Monocyte recruitment during infection and inflammation. Nat Rev Immunol 2011; 11: 762–774. [DOI] [PMC free article] [PubMed] [Google Scholar]
- 28. Stilund M, Reuschlein AK, Christensen T, et al Soluble CD163 as a marker of macrophage activity in newly diagnosed patients with multiple sclerosis. PLoS ONE 2014; 9: e98588. [DOI] [PMC free article] [PubMed] [Google Scholar]
- 29. Katsavos S, Anagnostouli M. Biomarkers in multiple sclerosis: an up‐to‐date overview. Mult Scler Int 2013; 2013: 340508. [DOI] [PMC free article] [PubMed] [Google Scholar]
- 30. Stilund M, Gjelstrup MC, Christensen T, et al A multi‐biomarker follow‐up study of patients with multiple sclerosis. Brain Behav 2016; 6: e00509. [DOI] [PMC free article] [PubMed] [Google Scholar]
- 31. Brettschneider J, Czerwoniak A, Senel M, et al The chemokine CXCL13 is a prognostic marker in clinically isolated syndrome (CIS). PLoS ONE 2010; 5: e11986. [DOI] [PMC free article] [PubMed] [Google Scholar]
- 32. Murr C, Widner B, Wirleitner B, et al Neopterin as a marker for immune system activation. Curr Drug Metab 2002; 3: 175–187. [DOI] [PubMed] [Google Scholar]
- 33. Teunissen CE, Khalil M. Neurofilaments as biomarkers in multiple sclerosis. Mult Scler 2012; 18: 552–556. [DOI] [PubMed] [Google Scholar]
- 34. Kivisakk P, Healy BC, Francois K, et al Evaluation of circulating osteopontin levels in an unselected cohort of patients with multiple sclerosis: relevance for biomarker development. Mult Scler 2014; 20: 438–444. [DOI] [PubMed] [Google Scholar]
- 35. Christensen T. HERVs in neuropathogenesis. J Neuroimmune Pharmacol 2010; 5: 326–335. [DOI] [PubMed] [Google Scholar]
- 36. Brudek T, Christensen T, Aagaard L, et al B cells and monocytes from patients with active multiple sclerosis exhibit increased surface expression of both HERV‐H Env and HERV‐W Env, accompanied by increased seroreactivity. Retrovirology 2009; 6: 104. [DOI] [PMC free article] [PubMed] [Google Scholar]
- 37. Laska MJ, Brudek T, Nissen KK, et al Expression of HERV‐Fc1, a human endogenous retrovirus, is increased in patients with active multiple sclerosis. J Virol 2012; 86: 3713–3722. [DOI] [PMC free article] [PubMed] [Google Scholar]
- 38. Christensen T, Petersen T, Thiel S, et al Gene‐environment interactions in multiple sclerosis: Innate and adaptive immune responses to human endogenous retrovirus and herpesvirus antigens and the lectin complement activation pathway. J Neuroimmunol 2007; 183: 175–188. [DOI] [PubMed] [Google Scholar]
- 39. Petersen T, Moller‐Larsen A, Ellermann‐Eriksen S, et al Effects of interferon‐beta therapy on elements in the antiviral immune response towards the human herpesviruses EBV, HSV, and VZV, and to the human endogenous retroviruses HERV‐H and HERV‐W in multiple sclerosis. J Neuroimmunol 2012; 249: 105–108. [DOI] [PubMed] [Google Scholar]
- 40. Christensen T, Sorensen PD, Hansen HJ, et al Antibodies against a human endogenous retrovirus and the preponderance of env splice variants in multiple sclerosis patients. Mult Scler 2003; 9: 6–15. [DOI] [PubMed] [Google Scholar]
- 41. Hauser SL, Waubant E, Arnold DL, et al B‐cell depletion with rituximab in relapsing‐remitting multiple sclerosis. N Engl J Med 2008; 358: 676–688. [DOI] [PubMed] [Google Scholar]
- 42. Kappos L, Li D, Calabresi PA, et al Ocrelizumab in relapsing‐remitting multiple sclerosis: a phase 2, randomised, placebo‐controlled, multicentre trial. Lancet 2011; 378: 1779–1787. [DOI] [PubMed] [Google Scholar]
- 43. Polman CH, O'Connor PW, Havrdova E, et al A randomized, placebo‐controlled trial of natalizumab for relapsing multiple sclerosis. N Engl J Med 2006; 354: 899–910. [DOI] [PubMed] [Google Scholar]
- 44. Yokoyama Y, Watanabe K, Ito H, et al Factors associated with treatment outcome, and long‐term prognosis of patients with ulcerative colitis undergoing selective depletion of myeloid lineage leucocytes: a prospective multicenter study. Cytotherapy 2015; 17: 680–688. [DOI] [PubMed] [Google Scholar]
- 45. Ziegler‐Heitbrock L, Ancuta P, Crowe S, et al Nomenclature of monocytes and dendritic cells in blood. Blood 2010; 116: e74–e80. [DOI] [PubMed] [Google Scholar]
- 46. Fischer‐Smith T, Croul S, Sverstiuk AE, et al CNS invasion by CD14+/CD16+ peripheral blood‐derived monocytes in HIV dementia: perivascular accumulation and reservoir of HIV infection. J Neurovirol 2001; 7: 528–541. [DOI] [PubMed] [Google Scholar]
- 47. Chuluundorj D, Harding SA, Abernethy D, et al Expansion and preferential activation of the CD14(+)CD16(+) monocyte subset during multiple sclerosis. Immunol Cell Biol 2014; 92: 509–517. [DOI] [PubMed] [Google Scholar]
- 48. Wiesemann E, Deb M, Trebst C, et al Effects of interferon‐beta on co‐signaling molecules: upregulation of CD40, CD86 and PD‐L2 on monocytes in relation to clinical response to interferon‐beta treatment in patients with multiple sclerosis. Mult Scler 2008; 14: 166–176. [DOI] [PubMed] [Google Scholar]
- 49. Moller HJ, Aerts H, Gronbaek H, et al Soluble CD163: a marker molecule for monocyte/macrophage activity in disease. Scand J Clin Lab Invest 2002; 62: 29–33. [DOI] [PubMed] [Google Scholar]
- 50. Contin C, Pitard V, Itai T, et al Membrane‐anchored CD40 is processed by the tumor necrosis factor‐alpha‐converting enzyme ‐ Implications for CD40 signaling. J Biol Chem 2003; 278: 32801–32809. [DOI] [PubMed] [Google Scholar]
- 51. Chen P, Su B, Zhang T, et al Perturbations of monocyte subsets and their association with T helper cell differentiation in acute and chronic hiV‐1‐infected patients. Front Immunol 2017; 8:272. [DOI] [PMC free article] [PubMed] [Google Scholar]
- 52. Davis BH, Zarev PV. Human monocyte CD163 expression inversely correlates with soluble CD163 plasma levels. Cytometry B Clin Cytom 2005; 63: 16–22. [DOI] [PubMed] [Google Scholar]
- 53. Christensen T. Human endogenous retroviruses in neurologic disease. Apmis. 2016; 124: 116–126. [DOI] [PubMed] [Google Scholar]
- 54. Antony JM, Deslauriers AM, Bhat RK, et al Human endogenous retroviruses and multiple sclerosis: innocent bystanders or disease determinants? Biochim Biophys Acta 2011; 1812:162–176. [DOI] [PMC free article] [PubMed] [Google Scholar]
- 55. Nexo BA, Christensen T, Frederiksen J, et al The etiology of multiple sclerosis: genetic evidence for the involvement of the human endogenous retrovirus HERV‐Fc1. PLoS ONE 2011; 6: e16652. [DOI] [PMC free article] [PubMed] [Google Scholar]
- 56. Mameli G, Poddighe L, Mei A, et al Expression and activation by epstein barr virus of human endogenous retroviruses‐Win blood cells and astrocytes: inference for multiple sclerosis. PLoS ONE 2012; 7: e44991. [DOI] [PMC free article] [PubMed] [Google Scholar]
- 57. Antony JM, Ellestad KK, Hammond R, et al The human endogenous retrovirus envelope glycoprotein, syncytin‐1, regulates neuroinflammation and its receptor expression in multiple sclerosis: a role for endoplasmic reticulum chaperones in astrocytes. J Immunol 2007; 179: 1210–1224. [DOI] [PubMed] [Google Scholar]
- 58. Perron H, Lazarini F, Ruprecht K, et al Human endogenous retrovirus (HERV)‐W ENV and GAG proteins: physiological expression in human brain and pathophysiological modulation in multiple sclerosis lesions. J Neurovirol 2005; 11: 23–33. [DOI] [PubMed] [Google Scholar]
- 59. Petersen T, Moller‐Larsen A, Thiel S, et al Effects of interferon‐beta therapy on innate and adaptive immune responses to the human endogenous retroviruses HERV‐H and HERV‐W, cytokine production, and the lectin complement activation pathway in multiple sclerosis. J Neuroimmunol 2009; 215: 108–116. [DOI] [PubMed] [Google Scholar]
- 60. Johnston JB, Silva C, Holden J, et al Monocyte activation and differentiation augment human endogenous retrovirus expression: implications for inflammatory brain diseases. Ann Neurol 2001; 50: 434–442. [DOI] [PubMed] [Google Scholar]
- 61. Christensen T. Association of human endogenous retroviruses with multiple sclerosis and possible interactions with herpes viruses. Rev Med Virol 2005; 15: 179–211. [DOI] [PubMed] [Google Scholar]
- 62. Hansen DT, Petersen T, Christensen T. Retroviral envelope proteins: Involvement in neuropathogenesis. J Neurol Sci 2017; 380: 151–163. [DOI] [PubMed] [Google Scholar]
- 63. Sharma P, Azebi S, England P, et al Citrullination of histone H3 Interferes with HP1‐mediated transcriptional repression. PLoS Genet 2012; 8: e1002934. [DOI] [PMC free article] [PubMed] [Google Scholar]
- 64. Kurtzke JF. Rating neurologic impairment in multiple sclerosis: an expanded disability status scale (EDSS). Neurology 1983; 33: 1444–1452. [DOI] [PubMed] [Google Scholar]
- 65. Teunissen CE, Petzold A, Bennett JL, et al A consensus protocol for the standardization of cerebrospinal fluid collection and biobanking. Neurology 2009; 73: 1914–1922. [DOI] [PMC free article] [PubMed] [Google Scholar]
- 66. Moller HJ, Hald K, Moestrup SK. Characterization of an enzyme‐linked immunosorbent assay for soluble CD163. Scand J Clin Lab Invest 2002; 62: 293–299. [DOI] [PubMed] [Google Scholar]
Associated Data
This section collects any data citations, data availability statements, or supplementary materials included in this article.
Supplementary Materials