

Abstract
Aims
To estimate the effects of needle and syringe programmes (NSP) and opioid substitution therapy (OST), alone or in combination, for preventing acquisition of hepatitis C virus (HCV) in people who inject drugs (PWID).
Methods
Systematic review and meta‐analysis. Bibliographic databases were searched for studies measuring concurrent exposure to current OST (within the last 6 months) and/or NSP and HCV incidence among PWID. High NSP coverage was defined as regular NSP attendance or ≥ 100% coverage (receiving sufficient or greater number of needles and syringes per reported injecting frequency). Studies were assessed using the Cochrane risk of bias in non‐randomized studies tool. Random‐effects models were used in meta‐analysis.
Results
We identified 28 studies (n = 6279) in North America (13), United Kingdom (five), Europe (four), Australia (five) and China (one). Studies were at moderate (two), serious (17) critical (seven) and non‐assessable risk of bias (two). Current OST is associated with 50% [risk ratio (RR) =0.50, 95% confidence interval (CI) = 0.40–0.63] reduction in HCV acquisition risk, consistent across region and with low heterogeneity (I 2 = 0, P = 0.889). Weaker evidence was found for high NSP coverage (RR = 0.79, 95% CI = 0.39–1.61) with high heterogeneity (I 2 = 77%, P = 0.002). After stratifying by region, high NSP coverage in Europe was associated with a 56% reduction in HCV acquisition risk (RR = 0.44, 95% CI = 0.24–0.80) with low heterogeneity (I 2 = 12.3%, P = 0.337), but not in North America (RR = 1.58, I 2 = 89.5%, P = < 0.001). Combined OST/NSP is associated with a 74% reduction in HCV acquisition risk (RR = 0.26, 95% CI = 0.07–0.89, I 2 = 80% P = 0.007). According to Grades of Recommendation Assessment, Development and Evaluation (GRADE) criteria, the evidence on OST and combined OST/NSP is low quality, while NSP is very low.
Conclusions
Opioid substitution therapy reduces risk of hepatitis C acquisition and is strengthened in combination with needle and syringe programmes (NSP). There is weaker evidence for the impact of needle syringe programmes alone, although stronger evidence that high coverage is associated with reduced risk in Europe.
Keywords: Cochrane, harm reduction, hepatitis C, incidence, meta‐analysis, needle and syringe programmes, opioid substitution therapy, review, substance use
Introduction
Hepatitis C virus (HCV) is a major global public health concern, with approximately 114.9 (91.9–148.7) million people having antibodies to HCV 1, 3–4 million people newly infected each year and 350 000 deaths occurring annually 2, 3. People who inject drugs (PWID) are the key at risk group in most high‐income countries, and in most countries more than half of PWID have been infected with HCV 4.
Evidence shows that injecting with needles and syringes used previously by someone else is the main risk factor for infection with HIV and HCV among PWID 5, 6. Additional risks for HCV acquisition in this population include sharing drug preparation containers, filters, rinse water and backloading (a method of sharing drugs by transferring them from the needle of one syringe into the barrel of another) 5, 6. The provision of sterile injecting equipment through needle and syringe programmes (NSP) and enrolment in opioid substitution treatment (OST) are among the primary interventions for reducing HCV and HIV transmission among PWID. NSPs provide sterile needles and syringes and other injecting equipment to PWID via fixed‐sites, outreach, peer networks, vending machines and pharmacies. By maximizing the amount of sterile injecting equipment (including syringes, cookers, cottons) in circulation, the time infected equipment remains in circulation decreases and the proportion of unsafe injections or the need to share equipment to prepare drugs reduces 7. OST is prescribed to dependent opioid users to diminish the use and effects of illicitly acquired opioids and reduce the frequency of injection and exposure to unsafe injecting practices 8. The most commonly prescribed forms of OST are opiate agonist treatments—methadone maintenance therapy and buprenorphine maintenance treatment. NSPs and OST are often the first point of service contact for PWID and so they provide referrals and support to other social and welfare services.
There is good evidence that NSP and OST in combination reduce injecting risk behaviours and some evidence of an impact on HIV incidence. However, evidence for their impact on HCV incidence among PWID is limited 9, 10, 11, 12, 13, 14, 15. Recent reviews have estimated a moderate effect of NSPs in reducing HIV transmission by 48% [95% confidence interval (CI) = 3–72%] and strong evidence for OST reducing HIV transmission by 54% (95% CI = 33–68%) 16, 17. Previous evidence syntheses for use of NSPs have focused primarily on HIV as the main outcome and, as a consequence, failed to include all the available evidence on HCV 8, 11, 13, 18. Another review that measured the effect of NSP use did not include a meta‐analysis due to heterogeneity in the measurement of NSP exposure, and focused on evidence from North America, limiting the generalizability of findings to other settings, including Europe 19. An analysis of pooled data examined the effect of NSP coverage on HCV incidence showed that high coverage of NSP (≥ 100% of injections with a sterile syringe) or receipt of OST either currently or within the past 6 months can each reduce HCV infection risk by 50% and in combination by 80%. The small number of incident HCV cases meant that the efficacy estimate for 100% NSP among those not on OST was weak 20.
Evidence of the effect of NSP with and without OST on HCV incidence is inconclusive 11. There is a need to strengthen this existing evidence base, including a more refined measure of coverage of NSP that accounts for frequency and the degree to which the NSP meets individuals’ requirement for needles and syringes in order to inform interventions to reduce the burden of HCV. We undertook a Cochrane Systematic Review and meta‐analysis of unpublished and published studies. Our primary objective was to assess the impact of NSPs with and without OST on the incidence of HCV infection among PWID. Our secondary objective involved estimating any differential effect of variables including duration of treatment, geographical setting, study setting (i.e. community, or treatment) and sample characteristics (such as age, sex, experience of prison, homelessness, use of stimulant injection). Full methods are reported in the Cochrane Review 21.
Methods
Search
We carried out two separate systematic search strategies. The first identified studies examined directly the impact of OST or NSP in relation to HCV incidence. The second focused on identifying cohort studies that reported HCV incidence among PWID. These studies were examined to identify whether they reported the impact of OST or NSP in relation to HCV transmission in secondary analyses. Where no measure was reported, authors of studies were contacted and asked if OST or NSP exposures were measured, and if so to provide unpublished data. The full search terms are reported in the Cochrane Review 21. Multiple databases were included up to March 2017 [Medline, PsycInfo, Embase, Cochrane Drug and Alcohol Group Specialized Register, the Cochrane Database of Systematic Reviews, the Database of Abstracts of Reviews of Effectiveness, Global Health, Cinahl (EBSCO Host), Web of Science], as well as conference abstracts of the International HIV/AIDS Society and the European Association for the Study of Liver conference and the International Symposium on Hepatitis Care in Substance Users. Grey literature was searched from European Monitoring Centre on Drugs and Drug Addiction and the European Centre for Disease Control.
Study selection
Two reviewers screened full text copies of relevant articles to determine whether they met eligibility criteria. There was no language restriction.
Data extraction and analysis
For the full data extraction form see the full Cochrane Review 21, which included study design and recruitment; sample characteristics; intervention; outcome measure and intervention effect. Data were double‐extracted.
Eligibility criteria
We included all observational (prospective and retrospective cohorts, cross‐sectional surveys and case–control studies) or experimental studies that: (a) measured exposure to either intervention against no intervention or a reduced exposure and reported HCV incidence as an outcome; and (b) reported a minimum of two seroconversions. We included studies that measured incidence of HCV in PWID via repeated testing, such as detection of HCV RNA‐positive among HCV‐negative participants. OST exposure was measured through self‐report, defined as the use of prescribed methadone or buprenorphine within the last 6 months. High NSP coverage was defined as obtaining 100% of needles and syringes from a safe source, reporting obtaining ≥ 100% of sterile needles and syringes per injecting frequency, regular attendance at least once per week at an NSP or obtaining most needles and syringes from an NSP during the last 6 months. We excluded studies measuring HCV incidence using self‐reported data and those conducted in prison settings.
Risk of bias
We assessed the quality of included studies through the Cochrane risk of bias assessment tool for non‐randomized studies of interventions 22. This assesses studies according to seven domains: confounding; selection bias; measurement of interventions; departures from intervention; missing data; measurement of outcomes; and selection of reported results, to give an overall risk of bias classified into four categories of low to critical. We decided that minimum adjustment for confounding should include time since first injection or age and injecting frequency at baseline. We assessed the overall quality of the evidence for the primary outcome using the Grades of Recommendation Assessment, Development and Evaluation (GRADE) system 23. We used funnel plots (plots of the effect estimate from each study against the sample size or effect standard error) to assess the potential for bias related to the size of the studies, which could indicate possible publication bias.
Summary measures and synthesis of results
We used a random‐effects meta‐analysis for the primary analyses, allowing for heterogeneity between and within studies. Effect estimates derived from studies adjusting for confounders as well as those that did not (unadjusted estimates) were pooled in separate meta‐analyses. We examined heterogeneity with the I 2 statistic and identified reasons for heterogeneity using univariable random‐effects meta‐regression to compare subgroups by geographical region of study; site of recruitment; proportion of female participants; main drug injected; type of NSP; frequency of injecting; and study design. We used sensitivity analyses to determine to what extent the overall intervention effect was changed by: the inclusion of studies at severe or unclear risk of bias; the inclusion of studies that did not adjust for confounders; exclusion of unpublished data sets; and excluding cross‐sectional studies that measured intervention effect at baseline only.
Results
The numbers of studies identified, reviewed and selected and the reasons for exclusion for both searches are shown in Fig. 1. We identified 21 published studies that directly included measures of the impact of exposure to either OST or NSP on HCV transmission 12, 24, 25, 26, 27, 28, 29, 30, 31, 32, 33, 34, 35, 36, 37, 38, 39, 40, 41, 42, 43. In addition, we identified 11 eligible prospective studies that measured HCV incidence and contacted the authors of these papers 44, 45, 46, 47, 48, 49, 50, 51, 52, 53, 54. Of these, unpublished data were obtained from cohort studies in Montreal (Canada) [Bruneau (unpublished)]; Baltimore (USA) [Mehta (unpublished)], San Francisco (USA) [Page (unpublished)], Sydney and Melbourne (Australia) 55 [Maher (unpublished)], London (UK) [Judd (unpublished)] and three cross‐sectional surveys in Bristol, Birmingham and Leeds (UK) [Hope (unpublished)]. In total we included 1736 HCV incident infections and 6513.04 person‐years of follow‐up. Overall HCV incidence ranged between 5.9 and 42 cases per 100 person‐years throughout the studies.
Figure 1.
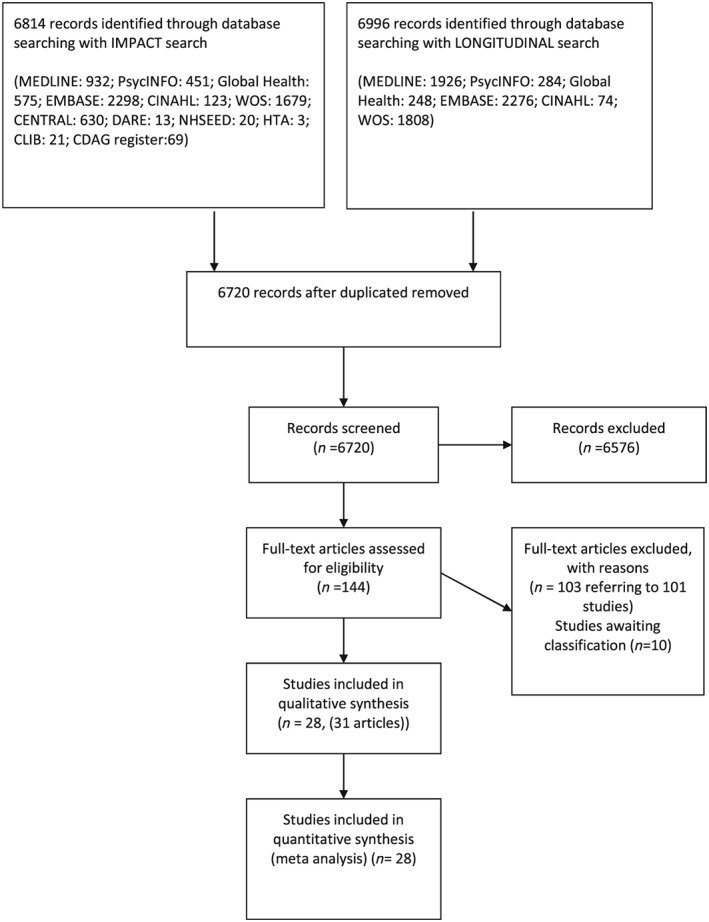
Flow‐chart of included studies
Description of studies
Table 1 summarizes the characteristics of the included studies undertaken in the United States (n = 8), UK (n = 5), Canada (n = 5), Australia (n = 5) and one study each in the Netherlands, France, Italy, Spain and China. Twenty‐one of the included studies reported the impact of OST 12, 24, 25, 30, 31, 34, 36, 37, 38, 40, 41, 42, 43, 55, 56 [Bruneau (unpublished), Mehta (unpublished), Page (unpublished), Maher (unpublished), Judd (unpublished), Hope (unpublished)]. Seventeen studies reported the impact of NSP 12, 26, 27, 28, 29, 32, 33, 35, 39, 41, 43 [Bruneau (unpublished), Mehta (unpublished), Page (unpublished)]. Four studies assessed the impact of combined NSP with OST 12, 29, 32 [Bruneau (unpublished)]. There were no experimental studies. Sample size varied from 46 to 2788, with participants recruited through street outreach, respondent‐driven sampling or service providers. Twenty‐five studies reported the sex of participants, of which 32% (range = 2.8–55.9%) was the mean proportion of women across the studies. Three were excluded from this analysis, as they published only unadjusted estimates of life‐time use of OST versus never using OST 36, 41, 42.
Table 1.
Characteristics and risk of bias of included studies.
| Author | Design | Sex | Age (years) | n | HCV/ 100 py | New HC/py | Interventions | Effect estimate | Confounders included in analysis | Risk of bias | |
|---|---|---|---|---|---|---|---|---|---|---|---|
| Aitken, 2015 55 Australia | Cohort | 31.7% | 29.4 (median) | 98 | 8.6 | 17/196 | OST current Use of OST in last month | HR | 0.8 (0.3–2.0) | – | C |
| Bruneau, 2015 [Bruneau unpublished] Canada | Cohort | NA | 37.4% < 30 | 285 | 17.3 | 102/589.35 | OST current use of OST in last 6 months 3 | HR | 0.74 (0.47–1.16) AOR = 0.74 (0.47–1.16) | Years injecting, numbers of injection in past month | S |
| NSP (high; high NSP (>100% coverage) | HR | 0.77 (0.5–1.19) AOR = 0.7 (0.45–1.09) | Years injecting, numbers of injection in past month | ||||||||
| Combined NSP/OST OST in last 6 months and high (> 100% coverage) | HR | 0.63 (0.37–1.07) AOR = 0.59 (0.35–1.01) | Years injecting, numbers of injection in past month | ||||||||
| OST othera (high dose ≥ 60 mg) | HR | 0.37 (0.17–0.8) AOR = 0.39 (0.18–0.86) | Years injecting, numbers of injection in past month | ||||||||
| OST othera (low dose < 60 mg) | HR | 1.15 (0.7–1.89) AOR = 1.06 (0.64–1.77) | Years injecting, numbers of injection in past month | ||||||||
| Craine, 2009 24 Wales | Cohort | 29.0% | 27.2 (mean) | 286 | 5.9 | 17/287.33 |
OST current In OST at interview |
IRR | 0.27 (0.095–0.77) AOR = 0.34 (0.12–0.99) | Region, homelessness, sharing equipment, sharing needles (all in last 12 months) | |
| Crofts, 1997 25 Australia | Cohort* | 41.9% | 29.2 (mean) | 73 | 22.2 | 13/85.4 | OST current Continuous OST during follow‐up | IRR | 1.8 (0.37–4.77) | – | S |
| OST othera (interrupted use) | IRR | 0.66 (0.55–0.79) | – | ||||||||
| Hagan, 1995 26 USA | Case–control | 45.0% | 24% < 25 | 46 | 20/NA |
NSP (low)a
Ever used NSP |
OR | 0.12 (0.026–0.55) AOR = 0.14 (0.03–0.62) | Sex, age, ethnicity, and duration of injection | S | |
| Hagan, 1999 27 USA | Cohort | 38.0% | 19% < 25 | 187 | 20.8 | 26/209 |
NSP (high) current regular NSP use |
RR | 1.42 (0.64–3.13) AOR = 1.31 (0.79–2.2) | Onset of injection < 1 year from baseline interview, sharing at baseline | S |
| NSP (low)a | 1.72 (0.71–4.19) AOR = 2.59 (0.79–8.5) | Onset of injection < 1 year from baseline interview, sharing at baseline | |||||||||
| Holtzman, 2009 28 USA | Cohort | 38.0% | 28% < 21 | 1288 | 139/NA |
NSP (low)a
NSP use in the last 6 months |
OR | 1.22 (0.86–1.74) AOR = 1.49 (0.96–2.29) | Duration of injection, shared needles/ paraphernalia; daily injecting; injecting with others | S | |
| Hope, 2011 29 UK | Cross‐sectional | 23.0% | 17% < 25 | 119 | 40 | 14/35 | NSP alone (high); high NSP (≥ 100% coverage | IRR | 0.11 (0.024–0.53) | – | S |
|
NSP/OST combined OST in last 6 months and high (> 100% coverage) |
IRR | 0.17 (0.12–1.54) | – | ||||||||
|
NSP/OST combined OST in last 6 months and low (< 100% coverage) |
IRR | 1.08 (0.31–3.82) | – | ||||||||
| Hope, 2015 [Hope (unpublished)] UK | Cross‐sectional | 25.0% | 919 | 9.9 | 30.3 | OST current | OR | – | S | ||
| Use of OST in last 4 weeks | |||||||||||
| Birmingham: | 1.55 (0.14–17.4) | ||||||||||
| Bristol: | 0.24 (0.05–1.16) | ||||||||||
| Leeds | 1.31 (0.08–21.5) | ||||||||||
| NSP high NSP coverage (≥ 100% coverage) (low NSP, no OST) | OR | – | |||||||||
| Bristol: | 0.99 (0.21–4.59) | ||||||||||
| Leeds: | 0.73 (0.04–11.98) | ||||||||||
| Birmingham: | 0.55 (0.05–6.26) | ||||||||||
| Judd, 2015 [Judd (unpublished)] UK | Cohort | 29.0% | 27.4 | 149 | 42 | 49/116.7 |
OST current Use of methadone in last 6 months |
RR |
0.47 (0.16–1.33) AOR = 0.49 (0.17–1.47) |
Duration and frequency of injecting | C |
| Lucidarme, 2004 30 France | Cohort | 17.6% | 26.9 (mean) | 165 | 11 | 16/178.4 |
OST current No definition |
RR |
0.34 (0.11–0.99) AOR = 0.41 (0.12–1.4) |
Sex, geographical region, condom use, daily injection of cocaine, duration of injecting, sharing paraphernalia (cotton, cup, water) | S |
| Maher, 2015 [Maher (unpublished)] Australia | Cohort | 38.0% | 24 (median) | 368 | 24.9 | 53/212.86 |
OST current OST in last 6 months |
HR | 0.43 (0.24–0.75) AOR = 0.46 (0.25–0.84) | Duration and frequency of injecting | S |
| NSP (low)a | HR | 1.86 (1.05–3.28) AOR = 0.15 (0.88–2.78) | Duration and frequency of injecting | ||||||||
| Mehta, 2015 [Mehta (unpublished)] USA | Cohort | 34 (median) | 324 | 17.8 | 27/166.5 |
OST current OST in last 6 months |
IRR | 0.6 (0.14–2.51) AOR = 0.82 (0.19–3.54) | Years injecting, daily injection, age (for whole cohort) | N/I | |
| NSP (low)a | IRR | 1.38 (0.17–11.5) AOR = 0.76 (0.1–5.67) | Years injecting, daily injection, age (for whole cohort) | ||||||||
| Nolan, 2014 31 Canada | Cohort | 30.4% | 23–34 | 1004 | 6.32 | 184/2108.4 |
OST current MMT in last 6 months |
OR | 0.67 (0.45–0.99) AOR = 0.47 (0.29–0.76) | Unstable housing, cocaine, heroin or methamphetamine injection, cohort and year of recruitment, follow‐up time | S |
| Page, 2015 [Page (unpublished)]USA | Cohort | 21.7% | 33.7 (mean) | 552 | 25.1 | 171/681.3 |
NSP (low)a
NSP use in the last 3 months |
HR | 2.82 (1.84–4.34) AOR = 2.62 (1.71–4.02) | Years injecting, age, sex, race, homeless, and recent jail | N/I |
| Palmateer, 2014 32 | Cross‐sectional | 27.5% | 34 (mean) | 2788 | 7.3 | 392/602.7 | OST current; OST at time of survey; low NSP (< 200%) | OR | 0.51 (0.29–0.9) AOR = 0.52 (0.23–1.18) | Survey year, homelessness or stimulant injection in last 6 months, time since onset of injecting | S |
| Scotland |
NSP (high) high NSP (> 200%) coverage and not on OST; |
OR | 0.26 (0.08–0.88) AOR = 0.18 (0.04–0.87) | Survey year, homelessness in last 6 months, stimulant injection in last 6 months, time since onset of injecting | |||||||
|
OST/NSP combined; high NSP (> 200%) coverage |
OR | 0.24 (0.1–0.6) AOR = 0.05 (0.01–0.18) | Survey year, homelessness in last 6 months, stimulant injection in last 6 months, time since onset of injecting | ||||||||
|
OST/NSP combined; low NSP (< 200%) coverage |
OR | 0.48(0.27–0.95) AOR = 0.59 (0.26–1.35) | Survey year, homelessness in last 6 months, stimulant injection in last 6 months, time since onset of injecting | ||||||||
| Patrick, 2001 33 Canada | Cohort | 30.3% | 34 (median) | 155 | 29.1 | 62/207.95 |
NSP (high) Attendance at least 1 per week at NSP in last 6 months |
HR | 3.69 (2.12–6.43) AOR = 2.56 (1.37–6.79) | Sex, injection of cocaine or speedballs, frequency of injection | S |
| Rezza, 1996 34 Italy | Case–control | 2.8% | 21% > 28 | 106 | 28.6 | 21/73.4 |
OST current OST in last 6 months |
OR | AOR = 0.34 (0.10–1.11) | Female gender, age, duration of drug use, injection of cocaine | C |
| Ruan, 2007 36 China | Cohort | 44% < 28 | 86 | 33.0 | 47/258 |
OST othera
Ever used OST |
RR | 0.5 (0.2–1.3) | – | C | |
| Roy, 2007 35 Canada | Cross‐sectional | 27.0% | 31.8 (mean) | 359 | 27.1 | 94/267 |
NSP (low)a
Use of NSP in last 6 months |
HR | 3.02 (95% CI NA) | Age, injection experience, injection with used needle, drug most often injected, sex work, district of recruitment | C |
| Spittal, 2012 37 Canada | Cohort | 53.4% | 23 (median) | 148 | 11.6 | 45/338.6 |
OST current In OST at time of survey (yes/no) |
HR | 2.11 (0.83–5.37) | – | S |
| Thiede, 2000 38 | Cohort | 48.9% | 5.4% < 25 | 80 | 8.75 | 7/80 |
OST current Continuous use during follow‐ up |
OR | 0.3 (0.01–3.6) AOR = 0.4 (0.0–4.2) | Injected at follow‐up, pooled money to buy drugs, injected with used needles, backloading | M |
| USA |
OST othera
Interrupted left treatment at least 1 during follow up |
OR | 0.8 (0.01–3.6) AOR = 1.2 (0.2–7.3) | Injected at follow‐up, pooled money to buy drugs, injected with used needles, backloading | |||||||
| Thorpe, 2002 39 USA | Cohort | 39.7% | 52% 18–22 years | 353 | 10 | 29/327.2 |
NSP (low)a
Use of NSP in last 6 months |
HR | 1.29 (0.6–2.79 | Receptively sharing syringes, sharing cookers, cotton filters, rinse water or backloading | S |
| Tsui, 2014 40 USA | Cohort | 31.9% | 16% 15–18 | 552 | 25.1 | 145/680 |
OST current and other Opiate agonist therapy maintenance treatment in last 3 months; |
HR | 0.31 (0.14–0.65) AOR = 0.39 (0.18–0.87) | Age, duration of injection drug use, sex, ethnicity, homelessness or incarceration in past 3 months | M |
| OST othera Opiate agonist detoxification in last 3 months | HR | 1.45 (0.8–2.69) | Age, duration of injection drug use, sex, ethnicity, homelessness or incarceration in past 3 months | ||||||||
| Vallejo, 2015 41 Spain | Cohort | 27.3% | 40% ≥ 25 | 137 | 39.8 | 42/105.4 |
OST othera
Life‐time use of OST |
IRR | 0.9 (0.5–1.6) | – | S |
| Van Den Berg, 2007 12 | Cohort | 33.0% | 31.4 (median) | 168 | 6.78 | 57/598.56 |
OST current; OST ≥ 60 mg methadone daily |
IRR | 0.67 (0.39–1.13) | – | S |
| Netherlands | NSP alone; High NSP (100% coverage) | IRR | 0.62 (0.3–1.3) | – | |||||||
| Combined OST/NSP high NSP | RR | 0.15 (0.05–6‐0.4) AOR = 0.36 (0.13–1.03) | Duration of injection, HIV status of steady partner | ||||||||
| Combined OST/NSP low NSP | RR | 1.04 (0.53–2.05) AOR = 1.17 (0.59–2.31) | Duration of injection, HIV status of steady partner | ||||||||
| OST othera (high dose) | RR | 0.68 (0.39–1.13) | |||||||||
| OST othera (low dose) | RR | 0.58 (0.3–1.15) | |||||||||
| Van Beek, 1998 42 Australia | Cohort* | 55.9% | 61.5% < 20 | 152 | 20.9 | 26/148.2 |
OST othera
Ever used OST (yes/no) |
OR | 1.08 (0.37–3.17) | C | |
| White, 2014 43 Australia | Cohort | 25.0% | 27 (median) | 127 | 7.9 | 20/215.2 | OST: OST last 6 months | HR |
Heroin users 0.65 (0.15–2.94) AOR = 0.56 (0.12–2.56) Amphetamine users 0.14 (0.04–0.51) AOR = 0.51(0.18–0.04) |
Sex, ethnic background, age, daily or more frequent injecting, receptive syringe sharing and not receiving OST while reporting heroin or other opioids as the main drug injected | S |
| White, 2014 43 Australia | NSP (low)a Accessed NSP in last 6 months; | HR | 1.0 (0.36–2.86) | – |
HR = hazard ratio; OR = odds ratio; AOR = adjusted odds ratio; RR = risk ratio; IRR = incident rate ratio; HCV = hepatitis C virus; OST = opioid substitution therapy; py = person‐years; NSP = needle and syringe programme; NA = not available.
Not reported in the primary analysis. Risk of bias: C = critical; S = serious; M = moderate; L = low; N/I = no information. HCV incidence for cross‐sectional surveys calculated as I = [(365/T)n]/[(N–n) + (365/T)n], where I = Incidence, T = estimated mean duration of the HCV antibody‐negative/RNA‐positive ‘window period’ = 75 days, n = number of HCV incident infections (HCV antibody‐negative and HCV RNA‐positive) and N = number of susceptibles (HCV antibody‐negative); NA = not available.
Signifies retrospective follow‐up.
Risk of bias
Risk of bias decisions are summarized in last column of Table 1 and in the Supporting information, Table S1. Only two studies were judged at moderate overall risk of bias 38, 40, 17 studies were judged as serious overall risk of bias 24, 26, 27, 28, 29, 30, 31, 32, 33, 37, 39, 41, 43 [Bruneau (unpublished), Maher (unpublished)] and seven were at critical risk 25, 34, 35, 36, 42, 55 [Judd (unpublished)]. For two studies [Mehta (unpublished), Page (unpublished)], we did not have enough information to make a judgement.
Current use of opioid substitution therapy
We pooled data from a total of 17 studies that measured current OST 12, 24, 25, 30, 31, 32, 34, 37, 38, 40, 41, 43, including five unpublished estimates 55 [Bruneau (unpublished), Maher (unpublished), Judd (unpublished), Hope (unpublished)]. Twelve studies (6361 participants) presented adjusted measures, on which the primary analyses were focused 24, 30, 31, 34, 38, 40, 43, 56 [Bruneau (unpublished), Mehta (unpublished), Maher (unpublished), Judd (unpublished)]. Random‐effect meta‐analysis of multivariable estimates showed that OST was associated with a 50% reduction in the risk of HCV infection [risk ratio (RR) = 0.50] with little heterogeneity between studies (I 2 = 0, P = 0.889).
This effect was maintained when the analysis was limited to exclude two studies judged to be at critical risk of bias 34 [Judd (unpublished)] and one study where there was insufficient information to give an overall risk of bias assessment [Mehta (unpublished)] (RR = 0.51, I 2 = 0%, P = 0.68). The intervention effect was unchanged when the analysis excluded two cross‐sectional studies 34, 56 that reported baseline measures of effect only (3367 participants, RR = 0.51, I 2 = 0.0%, P = 0.73). The intervention effect strengthened when estimates from four unpublished data sources [Bruneau (unpublished), Mehta (unpublished), Maher (unpublished), Judd (unpublished)] were excluded (RR = 0.42, I 2 = 0%, P = 0.96). The intervention effect weakened slightly, and heterogeneity increased if all unadjusted estimates were pooled from 16 studies (10 647 participants, RR = 0.57, I 2 = 32.4, P = 0.09 (Supporting information, Figs S1–S4).
We found no evidence that effectiveness varied by geographical region (Fig. 2) or study design. We did find evidence of differential impact in the proportion of female participants in the sample. With each 10% increase of female participants in sample, the effect of intervention exposure was reduced (ratio of RRs = 1.59) (Table 2).
Figure 2.
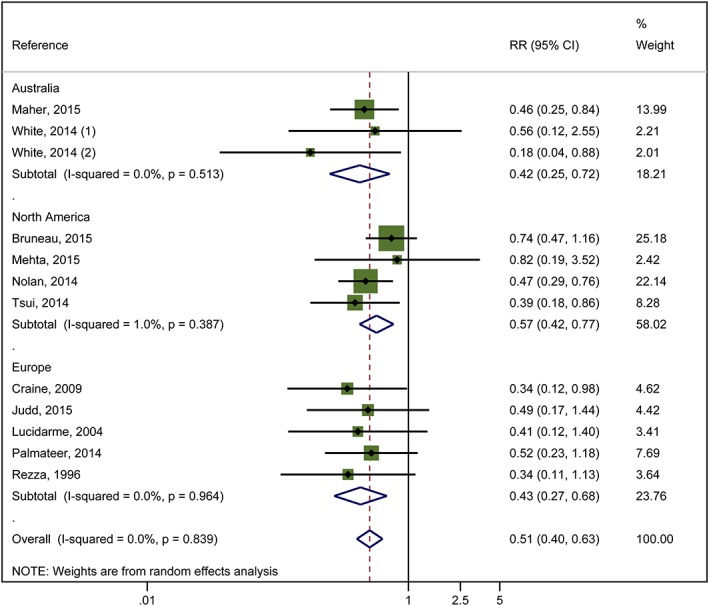
Impact of current use of opioid substitution therapy (OST) versus no OST on hepatitis C virus (HCV) incidence from studies adjusted for confounders and stratified by region. [Colour figure can be viewed at wileyonlinelibrary.com]
Table 2.
Univariable meta‐regression analysis for studies measuring impact of current use of opioid substitution therapy (OST) and high‐coverage needle and syringe programmes (NSP) on hepatitis C virus (HCV) incidence.
| Current use of OST | High coverage of NSP | |||||||||||
|---|---|---|---|---|---|---|---|---|---|---|---|---|
| Variable | Studies | Univariable rate ratio (95% CI) | Ratio of rate ratios 95% CI | P‐value | Tau‐squared | I 2 | Studies | Univariable rate ratio (95% CI) | Ratio of rate ratios (95% CI) | P‐value | Tau‐squared | I 2 |
| Geographical region | ||||||||||||
| Europe | 8 | 0.51 (0.37–0.70) | 1.0 (Ref) | 5 | 0.44 (0.24–0.80) | 1.0 (Ref) | ||||||
| Australia | 5 | 0.55 (0.28–1.11) | 1.12 (0.52–2.41) | |||||||||
| North America | 6 | 0.69 (0.44–1.08) | 1.42 (0.73–2.78) | 0.53 | 0.1032 | 33.7% | 3 | 1.58 (0.57–4.42) | 3.73 (0.95–14.7) | 0.057 | 0.41 | 71.7% |
| Site of recruitment | ||||||||||||
| Service attenders | 12 | 0.67 (0.49–0.92) | 1.0 (ref) | 3 | 0.67 (0.28–1.59) | 1.0 (Ref) | ||||||
| Community | 7 | 0.49 (0.33–0.73) | 0.73 (0.42–1.27) | 0.256 | 0.06 | 32.3% | 5 | 0.82 (0.29–2.32) | 0.76 (0.12–4.88) | 0.74 | 0.89 | 79.9% |
| Study design | ||||||||||||
| Cross‐sectional | 4 | 0.51 (0.31–0.85) | 1.0 | 3 | 0.34 (0.16–0.75) | 1.0 (Ref) | ||||||
| Prospective cohort | 15 | 0.58 (0.43–0.77) | 1.12 (0.48–2.61) | 0.784 | 0.1001 | 35.3% | 4 | 1.26 (0.55–2.93) | 3.53 (0.78–15.86) | 0.087 | 0.478 | 74.5% |
| Females | 17 | 1.59 (1.13–2.29) | 0.01 | 0.04 | 13.8% | 7 | 2.97 (0.38–23.1) | 0.24 | 0.87 | 81.3% | ||
| Prison | 11 | 1.057 (0.61–1.79) | 0.821 | 0.4303 | 56.3% | 3 | NA | |||||
| Homelessness | 12 | 1.08 (0.83–1.40) | 0.521 | 0.2327 | 39.8% | 6 | 1.01 (0.38–2.67) | 0.976 | 1.53 | 80.6% | ||
| Injection of stimulants | 12 | 0.89 (0.65–1.22) | 0.373 | 0.17 | 36.2% | 7 | 1.08 (0.47–2.51) | 0.827 | 1.15 | 80.4% | ||
| Daily injection | 7 | 0.88 (0.64–1.22) | 0.373 | 0.17 | 47.3% | 5 | 3.66 (0.22–61.3) | 0.239 | 1.15 | |||
CI = confidence interval; NA = not available.
High coverage of needle and syringe programmes
Five studies (3530 participants) reported adjusted measures of high NSP coverage compared to no or low NSP coverage and HCV incidence 27, 29, 33, 56, including one unpublished data set [Bruneau (unpublished)]. Random‐effect meta‐analysis showed weak evidence of an effect of high coverage of NSP on the reduction in the risk of HCV infection (RR = 0.79) and high heterogeneity between studies (I 2 = 77%, P = 0.002). Random‐effects meta‐analysis of seven studies (6455 participants) that presented unadjusted estimates show that the weak intervention effect was unchanged (RR = 0.77, I 2 = 79%, P = 0.000001) (Fig. 3). Evidence of any intervention effect became weaker after excluding the unpublished data set [Bruneau (unpublished)] (RR = 0.77, P < 0.001). No NSP studies were rated critical on the risk of bias tool (Supporting information, Fig. S5).
Figure 3.
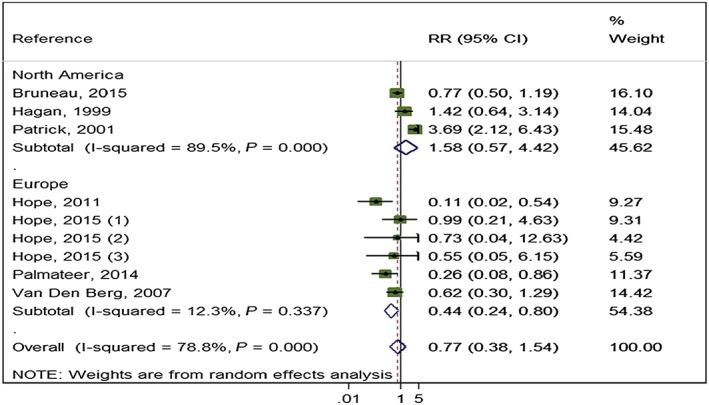
Impact of high‐coverage needle and syringe programmes (NSP) versus no/low coverage on hepatitis C virus (HCV) incidence from pooling unadjusted measures by region. [Colour figure can be viewed at wileyonlinelibrary.com]
High NSP coverage was associated with a 56% reduction in HCV acquisition risk (RR = 0.44) with low heterogeneity (I 2 = 12.3%, P = 0.337) when pooling unadjusted estimates from Europe, but no effect for North America and high heterogeneity (RR = 1.58, I 2 = 89.5%, P = 0 < 0.001) (Fig. 3). This pattern was maintained in the pooling of adjusted estimates, with a reduction in HCV acquisition associated with high NSP coverage in Europe (RR = 0.24) and low heterogeneity (I 2 = 0, P = 0.66), but not in North America (RR = 1.58), and high heterogeneity (I 2 = 89.5, P < 0.001) (Fig. 4). The meta‐regression analysis also showed evidence of differential impact by region comparing North America with Europe (ratio of RRs = 3.73, P = 0.06) (Table 2). Univariable meta regression analysis also suggested some association between high coverage of NSP and study design (ratio of RRs = 3.5, P‐value = 0.087 comparing cross‐sectional with longitudinal study design); this was reduced when adjusted for geographical region (ratio of RRs = 1.7, P‐value = 0.577). We found no evidence of differential impact by proportion of female participants in the sample, homelessness or experience of prison.
Figure 4.
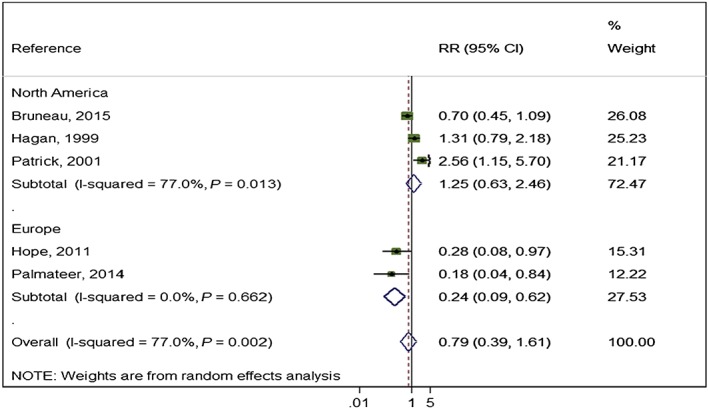
Impact of high‐coverage needle and syringe programmes (NSP) versus no/low coverage on hepatitis C virus (HCV) incidence from studies adjusted for confounders and by region. [Colour figure can be viewed at wileyonlinelibrary.com]
Combination interventions: OST and high/low NSP
Random‐effects meta‐analysis pooling adjusted measures from three studies 12, 56 [Bruneau (unpublished)] (3241 participants) showed that combined use of OST and high coverage of NSP was associated with a 74% risk reduction in HCV acquisition (RR = 0.26, I 2 = 80% P = 0.007). This effect was maintained when pooling unadjusted measures from four studies (3356 participants, RR = 0.29, I 2 = 64.4% P = 0.038) (Fig. 5).
Figure 5.
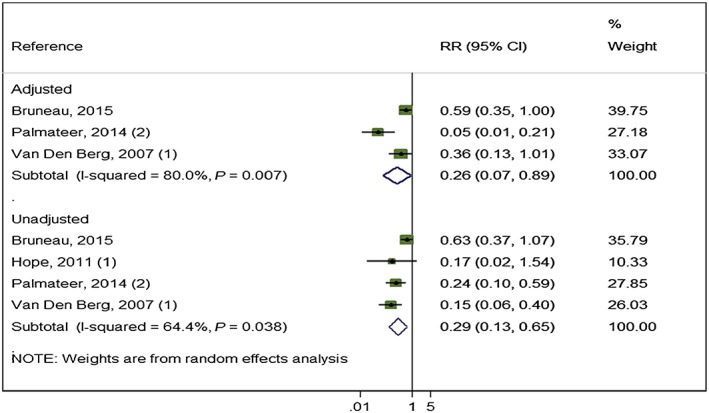
Impact of opioid substitution therapy (OST) combined with high‐coverage needle and syringe programmes (NSP) from studies adjusting for confounders and all pooled estimates. [Colour figure can be viewed at wileyonlinelibrary.com]
The effect of exposure to OST and low coverage of NSP from pooling adjusted measures from two studies (2956 participants) was weaker (RR = 0.87, I 2 = 36.0% P = 0.67). This effect remained unchanged when pooling unadjusted measures from three studies (3071 participants) (RR = 0.76, I 2 = 29.6% P = 0.24) (Fig. 6).
Figure 6.
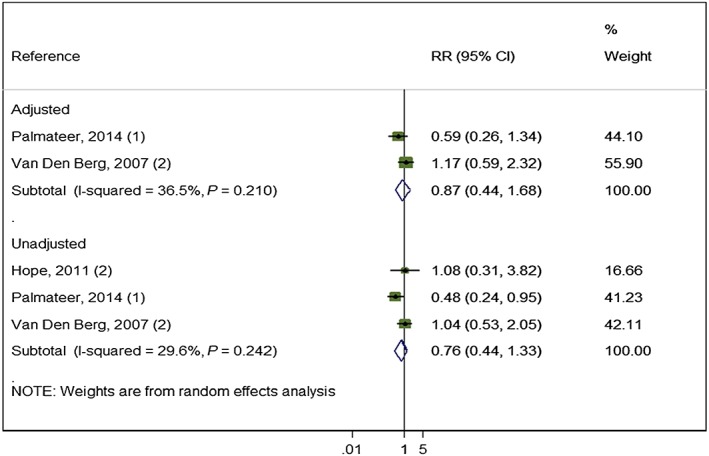
Impact of opioid substitution therapy (OST) combined with low‐coverage needle and syringe programmes (NSP) from studies adjusting for confounders and all pooled estimates. [Colour figure can be viewed at wileyonlinelibrary.com]
Publication bias
A funnel plot of 13 estimates (12 studies) and Egger's bias coefficient (−0.87, P = 0.106) suggested no evidence of publication bias in studies of current OST exposure. A funnel plot of five estimates (five studies) and Egger's bias coefficient (−1.65, P = 0.54) suggested little evidence of publication bias in studies of high NSP coverage, although this analysis included only five studies and may be under‐powered (Supporting information, Figs S6,S7).
Quality of evidence
Evidence for current use of OST is considered to be low quality because it was derived from observational studies with serious risk of bias. Evidence for combined use of OST and NSP was also considered to be low quality. Evidence for the effect of NSP was judged to be very low quality (because of the high heterogeneity and smaller effect size), according to the GRADE criteria 23. These are reported in detail in the Cochrane Review 21.
Discussion
Main findings
Opioid substitution treatment (OST) is associated consistently with an average 50% reduction in the risk of new HCV infections among PWID. The combined use of high‐coverage NSP with OST is associated with an average reduction in risk of HCV infection by 74%. There is weaker evidence that high coverage of NSP is associated with a reduction in risk of new HCV infections globally. There were no trials identified in the review. The majority of the observational studies were assessed to be at severe or critical risk of bias, and the strength of the evidence generated was low in the case of OST and very low for NSP 21.
Strengths and limitations
The two key limitations of the review are heterogeneity in measurement of exposure to NSPs and confounding. Consistent measures of NSP exposure through coverage of injections by clean needles and syringes were used throughout the European studies 12, 29, 32 [Hope (unpublished)], whereas the North American studies drew upon varied definitions of NSP use that focused on frequency of attendance at NSPs 27, 33 [Bruneau (unpublished)]. The measure of 100% NSP coverage corresponds to the situation where a person reports that they receive sufficient or a greater number of sterile syringes per reported injecting frequency, and is found in sites which allow PWID to collect a large number of syringes or attend very regularly, rather than in sites which adopt a more restricted form of exchange. It is also possible that the population exposed to 100% coverage are more compliant than the comparison group in terms of regular attendance and uptake of needles and syringes. However, we cannot assume that they necessarily use all needles and syringes obtained, as HCV transmission still occurs in this population. Inconsistencies in NSP measurement contributed to heterogeneity observed among studies (I 2 = 77%, P = 0.002), while differences in study design, exposure measurement and patterns of injecting may have contributed to the lack of effect of NSPs on HCV transmission observed in North America. The European definition of coverage may include needles and syringes obtained from pharmacies, secondary distribution via friends or via outreach, whereas the North American definition is specific to fixed‐site NSP use. In reality, PWID may obtain needles and syringes from multiple sources and, as a consequence, use NSPs less frequently for social support, HIV/HCV testing and counselling and other specialist advice. These additional services are essential to prevent the spread of blood‐borne viruses and reduce inequalities in health over time 57, but the immediate effect on HCV incidence may be difficult to assess where measurement of exposure does not capture uptake of sterile needles and syringes from other sources. Measurement of NSP use that focuses on needles and syringes without taking into account acquisition of other drug preparation equipment from NSPs may also have contributed to the lack of an association in some settings, particularly in the United States, where almost half of HCV seroconversions have been attributed to the shared use of cookers (spoons) and cottons 5. It is also hypothesized that less frequent use of NSPs and lack of federal funding for NSPs in the United States has resulted in lower coverage among PWID overall, which may mask an intervention effect, although in cities where the studies took place coverage is not as low as for the United States overall 58, 59. The higher proportion of stimulant injectors in US studies also may contribute to lower impact. Meta‐regression analysis suggested no differential impact between intervention effect and study design for current use of OST, but suggested that longitudinal studies of NSP found a lower effect than cross‐sectional studies which were associated with European settings.
The control of confounders was limited and inconsistent across the studies. However, synthesized effect estimates for OST and combined effect of OST and high‐coverage NSP were consistent throughout multiple studies and maintained between analyses that adjusted for confounders and those that did not, suggesting the variation did not affect the results. We cannot rule out the effect of residual confounding on NSP—especially for the lack of association between NSP use and HCV from studies in North America. For example, it has been shown that people who attend NSPs regularly in North America also report greater injecting risk behaviours and other social vulnerabilities (including sex work or homelessness), and that after adjustment for these factors any positive association between HCV or HIV transmission and NSP attendance is reduced 60, 61.
An additional limitation is that the GRADE criteria used by Cochrane assess automatically evidence from observational studies as low quality 23. The merits and limitations of using Cochrane Reviews and GRADE criteria in developing guidelines in the addictions field has been discussed recently 62, alongside a recognition for the need to separate out the quality of the evidence from the strength of the ensuing recommendation 63. We agree that this is an important distinction to make when examining the effect of interventions where there is no experimental evidence, and it is not ethical to conduct randomized controlled trials. Observational studies can give misleading results, and in some notable examples have been shown to be false when compared to evidence from randomized trials 64. Nonetheless, consideration of other criteria for assessing quality of evidence may be needed—such as size of effect, consistency across sensitivity analyses, supporting evidence, and use of instrumental variables to test for confounding 23.
Other evidence
This is the first global quantitative systematic review of the effectiveness of OST and NSP on reducing HCV, building upon an earlier narrative review that OST and NSP reduce injecting risk and global reviews on HIV 14, 16, 17. Our findings corroborate a pooled analysis, which suggested that receiving OST and high coverage of NSP can reduce HCV infection risk alone, but is greater in combination 20. Our findings suggested a stronger effect of high NSP coverage in Europe, but no effect in North America. This corroborates findings from another review that found increased risk of seroconversion associated with NSP attendance that relied predominantly upon evidence from North America 19. Meta‐regression analysis suggested evidence of a differential impact of OST by the proportion of female participants in the sample, with the effectiveness of the intervention reduced by 59% with every 10% increase in female participants. This corroborates other evidence that women are at increased risk of acquiring hepatitis C compared to men and may have poorer access to OST, possibly as a result of services not taking into account gender‐specific needs or being tailored towards men 65, 66, 67.
Implications
Given the low quality of evidence for NSP, there is an urgent need to improve transparency and consistency in reporting of observational studies in order to support future natural experiments and systematic reviews measuring the impact of the intensity of intervention coverage upon HCV and other outcomes. The development of improved and consistent measures of NSP coverage, along with more consistent reporting of the conduct of studies to measure exposure to NSPs and the assessment of confounders, are needed to strengthen the evidence on the impact of NSP.
It has been noted that the greatest benefits for people with mental health and addiction problems including PWID will be derived from providing better evidenced‐based care in relation to medication, substitution therapies and abstinence programmes, as well as addressing underlying social problems arising from homelessness and criminalization 68. This is particularly relevant in low‐ and middle‐income countries, where resources may be more restricted 62. There is a wealth of evidence from high‐income settings of the beneficial effects of OST in reducing injection‐related harms, including HIV and bacterial infections, and improving access to services 11, 17, 19, 20, 69, 70. However, global coverage of OST remains very low, prohibited in the Russian Federation and often restricted by age or duration of dependency prior to treatment entry 71. Our findings show the need to remove restrictions on the concurrent use of both NSP and OST to maximize reduction in HCV transmission. We had insufficient data to measure the impact of OST dosage on HCV acquisition risk, but two studies that stratified by dose showed that reduced risk was associated with high doses of methadone (≥ 60 mg), pointing to the importance of providing adequate dosages 12 [Bruneau (unpublished)]. Distribution of needles and syringes through NSPs needs to be maintained alongside provision of OST. NSP and OST services also need to develop gender‐sensitive policies and practices to encourage women to use services addressing gender‐specific injecting related risk and other health and social welfare needs. The potential role of the new era of highly curative short‐course direct‐acting antiviral therapies for HCV to reduce HCV transmission also needs to be considered 72, and within this the importance of ensuring equitable access of PWID to OST and NSPs that can facilitate HCV testing and treatment. In summary, our findings provide strong evidence that OST and in combination with high‐coverage NSP should be expanded to prevent the transmission of HCV and reduce associated morbidity and mortality.
Declarations of interest
J.B., L.D., Hickman, Hutchinson and Vickerman are members of the Editorial board of Addiction. S.H. reports personal fees from Abbvie and Gilead outside the submitted work. A.T. reports grants from NHS National Services Scotland during the conduct of the study. L.M. and L.D. are supported by an Australian National Health and Medical Research Council Research Fellowship. H.H. is supported by a grant from the US NIH. L.D. has received investigator‐initiated untied educational grants from Reckitt Benckiser, Indivior and Mundipharma. None of those funders had any role in the design, conduct, analysis, write‐up or decision to publish their findings.
Supporting information
Table S1 Risk of bias of included studies.
Figure S1 Impact of current use of opioid substitution therapy (OST) versus no OST on hepatitis C virus (HCV) incidence from studies adjusting for confounders but excluding those judged to be at critical risk of bias.
Figure S2 Impact of current use of opioid substitution therapy (OST) versus no OST on hepatitis C virus (HCV) incidence from studies adjusting for confounders but excluding cross‐sectional study designs.
Figure S3 Impact of current use of opioid substitution therapy (OST) versus no OST on hepatitis C virus (HCV) incidence from studies adjusting for confounders but excluding unpublished data sets.
Figure S4 Impact of current use of opioid substitution therapy (OST) versus no OST on hepatitis C virus (HCV) incidence from unadjusted studies.
Figure S5 Impact of high‐coverage needle and syringe programmes (NSP) versus no or low coverage on hepatitis C virus (HCV) incidence from studies adjusting for confounders but excluding unpublished data sets.
Figure S6 Funnel plot of 12 studies included in meta‐analysis of studies regarding the impact of opioid substitution therapy (OST) in relation to hepatitis C virus (HCV) incidence among people who inject drugs.
Figure S7 Funnel plot of 5 studies included in meta‐analysis of studies regarding the impact of high‐coverage needle and syringe programmes (NSP) in relation to hepatitis C virus (HCV) incidence among people who inject drugs.
Acknowledgements
We would like to acknowledge the help of Shruti Mehta, Thomas Kerr, Meghan Morris and Ali Judd for providing us access to unpublished data and measures of association between the interventions and HCV risk acquisition that were used in the analysis. We thank Zuzana Mitrova for her support with the searches. We thank Julian Higgins for his advice on the use of the ACROBAT ‘Risk of bias’ assessment tool and statistical advice on the options for pooling different observational study designs.
Platt, L. , Minozzi, S. , Reed, J. , Vickerman, P. , Hagan, H. , French, C. , Jordan, A. , Degenhardt, L. , Hope, V. , Hutchinson, S. , Maher, L. , Palmateer, N. , Taylor, A. , Bruneau, J. , and Hickman, M. (2018) Needle and syringe programmes and opioid substitution therapy for preventing HCV transmission among people who inject drugs: findings from a Cochrane Review and meta‐analysis. Addiction, 113: 545–563. doi: 10.1111/add.14012.
References
- 1. Gower E., Estes C., Blach S., Razavi‐Shearer K., Razavi H. Global epidemiology and genotype distribution of the hepatitis C virus infection. J Hepatol 2014; 61: S45–S57. [DOI] [PubMed] [Google Scholar]
- 2. Mohd Hanafiah K., Groeger J., Flaxman A. D., Wiersma S. T. Global epidemiology of hepatitis C virus infection: new estimates of age‐specific antibody to HCV seroprevalence. Hepatol (Balt) 2013; 57: 1333–1342. [DOI] [PubMed] [Google Scholar]
- 3. Perz J. F., Armstrong G. L., Farrington L. A., Hutin Y. J., Bell B. P. The contributions of hepatitis B virus and hepatitis C virus infections to cirrhosis and primary liver cancer worldwide. J Hepatol 2006; 45: 529–538. [DOI] [PubMed] [Google Scholar]
- 4. Degenhardt L., Charlson F., Stanaway J., Larney S., Alexander L. T., Hickman M. et al Estimating the burden of disease attributable to injecting drug use as a risk factor for HIV, hepatitis C, and hepatitis B: findings from the global burden of disease study. Lancet Infect Dis 2013; 16: 1385–1398. [DOI] [PubMed] [Google Scholar]
- 5. Pouget E. R., Hagan H., Des Jarlais D. C. Meta‐analysis of hepatitis C seroconversion in relation to shared syringes and drug preparation equipment. Addiction 2012; 107: 1057–1065. [DOI] [PMC free article] [PubMed] [Google Scholar]
- 6. Strathdee S. A., Hallett T. B., Bobrova N., Rhodes T., Booth R., Abdool R. et al HIV and risk environment for injecting drug users: the past, present, and future. Lancet 2010; 376: 268–284. [DOI] [PMC free article] [PubMed] [Google Scholar]
- 7. Kaplan E. H., Heimer R. A model‐based estimate of HIV infectivity via needle sharing. J Acquir Immune Defic Syndr 1992; 5: 1116–1118. [PubMed] [Google Scholar]
- 8. Tilson H., Aramrattana A., Bozzette S. A. Preventing HIV Infection Among Injecting Drug Users in High‐Risk Countries: an Assessment of the Evidence. Washington, DC: Institute of Medicine; 2007. [Google Scholar]
- 9. Gibson D. R., Flynn N. M., McCarthy J. J. Effectiveness of methadone treatment in reducing HIV risk behavior and HIV seroconversion among injecting drug users. AIDS 1999; 13: 1807–1818. [DOI] [PubMed] [Google Scholar]
- 10. Jones L., Pickering L., Sumnall H., McVeigh J., Bellis M. A. A Review of the Effectiveness and Cost‐Effectiveness of Needle and Syringe Programmes for Injecting Drug Users. Liverpool: Centre for Public Health, Liverpool John Moores University; 2008. [Google Scholar]
- 11. Palmateer N., Kimber J., Hickman M., Hutchinson S., Rhodes T., Goldberg D. Evidence for the effectiveness of sterile injecting equipment provision in preventing hepatitis C and human immunodeficiency virus transmission among injecting drug users: a review of reviews. Addiction 2010; 105: 844–859. [DOI] [PubMed] [Google Scholar]
- 12. Van Den Berg C., Smit C., Van Brussel G., Coutinho R., Prins M. Full participation in harm reduction programmes is associated with decreased risk for human immunodeficiency virus and hepatitis C virus: evidence from the Amsterdam cohort studies among drug users. Addiction 2007; 102: 1454–1462. [DOI] [PMC free article] [PubMed] [Google Scholar]
- 13. Gibson D. R., Flynn N. M., Perales D. Effectiveness of syringe exchange programs in reducing HIV risk behavior and HIV seroconversion among injecting drug users. AIDS 2001; 15: 1329–1341. [DOI] [PubMed] [Google Scholar]
- 14. Gowing L., Farrell M. F., Bornemann R., Sullivan L. E., Ali R. Oral substitution treatment of injecting opioid users for prevention of HIV infection. Cochrane Database Syst Rev 2011; Issue 8. Art. No.: CD004145. https://doi.org/10.1002/14651858.CD004145.pub4. [DOI] [PubMed] [Google Scholar]
- 15. MacArthur G. J., van Velzen E., Palmateer N., Kimber J., Pharris A., Hope V. et al Interventions to prevent HIV and hepatitis C in people who inject drugs: a review of reviews to assess evidence of effectiveness. Int J Drug Policy 2014; 25: 34–52. [DOI] [PubMed] [Google Scholar]
- 16. Aspinall E. J., Nambiar D., Goldberg D. J., Hickman M., Weir A., Van Velzen E. et al Are needle and syringe programmes associated with a reduction in HIV transmission among people who inject drugs: a systematic review and meta‐analysis. Int J Epidemiol 2014; 43: 235–248. [DOI] [PubMed] [Google Scholar]
- 17. MacArthur G. J., Minozzi S., Martin N., Vickerman P., Deren S., Bruneau J. et al Opiate substitution treatment and HIV transmission in people who inject drugs: systematic review and meta‐analysis. BMJ 2012; 345: e5945. [DOI] [PMC free article] [PubMed] [Google Scholar]
- 18. Wodak A., Cooney A. Effectiveness of Sterile Needle and Syringe Programming in Reducing HIV/AIDS Among Injecting Drug Users. Geneva: World Health Organization; 2004. [Google Scholar]
- 19. Hagan H., Pouget E. R., Des Jarlais D. C. A systematic review and meta‐analysis of interventions to prevent hepatitis C virus infection in people who inject drugs. J Infect Dis 2011; 204: 74–83. [DOI] [PMC free article] [PubMed] [Google Scholar]
- 20. Turner K. M., Hutchinson S., Vickerman P., Hope V., Craine N., Palmateer N. et al The impact of needle and syringe provision and opiate substitution therapy on the incidence of hepatitis C virus in injecting drug users: pooling of UK evidence. Addiction 2011; 106: 1978–1988. [DOI] [PubMed] [Google Scholar]
- 21. Platt L., Minozzi S., Reed J., Vickerman P., Hagan H., French C. et al Effectiveness of needle/syringe programmes and opiate substitution therapy in preventing HCV transmission among people who inject drugs. Cochrane Database Syst Rev 2016; https://doi.org.10.1002/14651858.CD012021. [DOI] [PMC free article] [PubMed] [Google Scholar]
- 22. Sterne J. A., Hernán M. A., Reeves B. C., Savović J., Berkman N. D., Viswanathan M. et al ROBINS‐I: a tool for assessing risk of bias in non‐randomised studies of interventions. BMJ 2016; 355: i4919. [DOI] [PMC free article] [PubMed] [Google Scholar]
- 23. Atkins D., Best D., Briss P. A., Eccles M., Falck‐Ytter Y., Florrorp S. et al Grading quality of evidence and strength of recommendations. BMJ 2004; 328: 1490. [DOI] [PMC free article] [PubMed] [Google Scholar]
- 24. Craine N., Hickman M., Parry J. V., Smith J., Walker A. M., Russell D. et al Incidence of hepatitis C in drug injectors: the role of homelessness, opiate substitution treatment, equipment sharing, and community size. Epidemiol Infect 2009; 137: 1255–1265. [DOI] [PubMed] [Google Scholar]
- 25. Crofts N., Nigro L., Oman K., Stevenson E., Sherman J. Methadone maintenance and hepatitis C virus infection among injecting drug users. Addiction 1997; 92: 999–1005. [PubMed] [Google Scholar]
- 26. Hagan H., Des Jarlais D. C., Friedman S. R., Purchase D., Alter M. J. Reduced risk of hepatitis B and hepatitis C among injection drug users in the Tacoma syringe exchange program. Am J Public Health 1995; 85: 1531–1537. [DOI] [PMC free article] [PubMed] [Google Scholar]
- 27. Hagan H., McGough J. P., Thiede H., Weiss N. S., Hopkins S., Alexander E. R. Syringe exchange and risk of infection with hepatitis B and C viruses. Am J Epidemiol 1999; 149: 203–213. [DOI] [PubMed] [Google Scholar]
- 28. Holtzman D., Barry V., Ouellet L. J., Des Jarlais D. C., Vlahov D., Golub E. T. et al The influence of needle exchange programs on injection risk behaviors and infection with hepatitis C virus among young injection drug users in select cities in the United States, 1994–2004. Prev Med 2009; 49: 68–73. [DOI] [PubMed] [Google Scholar]
- 29. Hope V. D., Hickman M., Ngui S. L., Jones S., Telfer M., Bizzarri M. et al Measuring the incidence, prevalence and genetic relatedness of hepatitis C infections among a community recruited sample of injecting drug users, using dried blood spots. J Viral Hepatitis 2011; 18: 262–270. [DOI] [PubMed] [Google Scholar]
- 30. Lucidarme D., Bruandet A., Ilef D., Harbonnier J., Jacob C., Decoster A. et al Incidence and risk factors of HCV and HIV infections in a cohort of intravenous drug users in the north and east of France. Epidemiol Infect 2004; 132: 699–708. [DOI] [PMC free article] [PubMed] [Google Scholar]
- 31. Nolan S., Dias Lima V., Fairbairn N., Kerr T., Montaner J., Grebely J. et al The impact of methadone maintenance therapy on hepatitis C incidence among illicit drug users. Addiction 2014; 109: 2053–2059. [DOI] [PMC free article] [PubMed] [Google Scholar]
- 32. Palmateer N. E., Taylor A., Goldberg D. J., Munro A., Aitken C., Shepherd S. J. et al Rapid decline in HCV incidence among people who inject drugs associated with national scale‐up in coverage of a combination of harm reduction interventions. PLOS ONE 2014; 9; e104515. [DOI] [PMC free article] [PubMed] [Google Scholar]
- 33. Patrick D. M., Tyndall M. W., Cornelisse P. G. A., Li K., Sherlock C. H., Rekart M. L. et al Incidence of hepatitis C virus infection among injection drug users during an outbreak of HIV infection. Can Med Assoc J 2001; 165: 889–895. [PMC free article] [PubMed] [Google Scholar]
- 34. Rezza G., Sagliocca L., Zaccarelli M., Nespoli M., Siconolfi M., Baldassarre C. Incidence rate and risk factors for HCV seroconversion among injecting drug users in an area with low HIV seroprevalence. Scand J Infect Dis 1996; 28: 27–29. [DOI] [PubMed] [Google Scholar]
- 35. Roy E., Alary M., Morissette C., Leclerc P., Boudreau J.‐F., Parent R. et al High hepatitis C virus prevalence and incidence among Canadian intravenous drug users. Int J STD AIDS 2007; 18: 23–27. [DOI] [PubMed] [Google Scholar]
- 36. Ruan Y., Qin G., Yin L., Chen K., Qian H.‐Z., Hao C. et al Incidence of HIV, hepatitis C and hepatitis B viruses among injection drug users in southwestern China: a 3‐year follow‐up study. AIDS 2007; 21: S39–S46. [DOI] [PubMed] [Google Scholar]
- 37. Spittal P. M., Pearce M. E., Chavoshi N., Christian W. M., Moniruzzaman A., Teegee M. et al The Cedar Project: high incidence of HCV infections in a longitudinal study of young aboriginal people who use drugs in two Canadian cities. BMC Public Health 2012; 12: 632. [DOI] [PMC free article] [PubMed] [Google Scholar]
- 38. Thiede H., Hagan H., Murrill C. S. Methadone treatment and HIV and hepatitis B and C risk reduction among injectors in the Seattle area. J Urban Health 2000; 77: 331–345. [DOI] [PMC free article] [PubMed] [Google Scholar]
- 39. Thorpe L. E., Ouellet L. J., Hershow R., Bailey S. L., Williams I. T., Williamson J. et al Risk of hepatitis C virus infection among young adult injection drug users who share injection equipment. Am J Epidemiol 2002; 155: 645–653. [DOI] [PubMed] [Google Scholar]
- 40. Tsui J. I., Evans J. L., Lum P. J., Hahn J. A., Page K. Association of opioid agonist therapy with lower incidence of hepatitis C virus infection in young adult injection drug users. JAMA Intern Med 2014; 174: 1974–1981. [DOI] [PMC free article] [PubMed] [Google Scholar]
- 41. Vallejo F., Barrio G., Brugal M. T., Pulido J., Toro C., Sordo L. et al High hepatitis C virus prevalence and incidence in a community cohort of young heroin injectors in a context of extensive harm reduction programmes. J Epidemiol Community Health 2015; 69: 599–603. [DOI] [PubMed] [Google Scholar]
- 42. van Beek I., Dwyer R., Dore G. J., Luo K., Kaldor J. M. Infection with HIV and hepatitis C virus among injecting drug users in a prevention setting: retrospective cohort study. BMJ 1998; 317: 433–437. [DOI] [PMC free article] [PubMed] [Google Scholar]
- 43. White B., Dore G. J., Lloyd A. R., Rawlinson W. D., Maher L. Opioid substitution therapy protects against hepatitis C virus acquisition in people who inject drugs: the HITS‐c study. Med J Aust 2014; 201: 326–329. [DOI] [PubMed] [Google Scholar]
- 44. Page K., Hahn J. A., Evans J., Shiboski S., Lum P., Delwart E. et al Acute hepatitis C virus infection in young adult injection drug users: a prospective study of incident infection, resolution, and reinfection. J Infect Dis 2009; 200: 1216–1226. [DOI] [PMC free article] [PubMed] [Google Scholar]
- 45. Roy E., Boudreau J.‐F., Boivin J.‐F. Hepatitis C virus incidence among young street‐involved IDUs in relation to injection experience. Drug Alcohol Depend 2009; 102: 158–161. [DOI] [PubMed] [Google Scholar]
- 46. Sendi P., Hoffmann M., Bucher H. C., Erb P., Haller P., Gyr N. et al Drug Alcohol Depend 2003; 69: 183–188. [DOI] [PubMed] [Google Scholar]
- 47. Shannon K., Kerr T., Marshall B., Li K., Zhang R., Strathdee S. A., et al Survival sex work involvement as a primary risk factor for hepatitis C virus acquisition in drug‐using youths in a Canadian setting. Arch Pediatr Adolesc Med 2010; 164: 61–65. [DOI] [PMC free article] [PubMed] [Google Scholar]
- 48. Solomon S. S., Celentano D. D., Srikrishnan A. K., Vasudevan C. K., Murugavel K. G., Iqbal S. H. et al Low incidences of human immunodeficiency virus and hepatitis C virus infection and declining risk behaviors in a cohort of injection drug users in Chennai, India. Am J Epidemiol 2010; 172: 1259–1267. [DOI] [PMC free article] [PubMed] [Google Scholar]
- 49. Stein M. D., Herman D. S., Anderson B. J. A trial to reduce hepatitis C seroincidence in drug users. J Addict Dis 2009; 28: 389–398. [DOI] [PMC free article] [PubMed] [Google Scholar]
- 50. Stephens B. P., Tait J., Evans M., Dillon J. F. The natural history of the acquisition of HCV in chaotic PWID. Hepatol (Balt) 2013; 58: 1103A. [Google Scholar]
- 51. Tsirogianni E., Kokkonis G., Tziokgas K., Tsekoura P., Stafilidou M., Sotiriadou K. et al Incidence of new HCV infection or reinfection after successful anti‐HCV therapy among people who inject drugs attending a substitution treatment programme in northern Greece. Suchtmed Forsch Prax 2013; 15: 260. [Google Scholar]
- 52. Villano S. A., Vlahov D., Nelson K. E., Lyles C. M., Cohn S., Thomas D. L. Incidence and risk factors for hepatitis C among injection drug users in Baltimore, Maryland. J Clin Microbiol 1997; 35: 3274–3277. [DOI] [PMC free article] [PubMed] [Google Scholar]
- 53. Widell A., Alanko M., Flamholc L., Jacobssen H., Molnegren V., Bjorkman P. Continued heavy transmission of HCV in a needle exchange program that is associated with minimal transmission of HIV. A nine year longitudinal cohort study. J Hepatol 2009; 50: S161. [Google Scholar]
- 54. Yang J., Oviedo‐Joekes E., Christian K. W. M., Li K., Louie M., Schechter M. et al The cedar project: methadone maintenance treatment among young aboriginal people who use opioids in two Canadian cities. Drug Alcohol Rev 2011; 30: 645–651. [DOI] [PubMed] [Google Scholar]
- 55. Aitken C., Agius P. A., Higgs P. G., Stoove M. A., Bowden D. S., Dietze P. M. The effects of needle‐sharing and opioid substitution therapy on incidence of hepatitis C virus infection and reinfection in people who inject drugs. Epidemiol Infect 2017; 145: 796–801. [DOI] [PMC free article] [PubMed] [Google Scholar]
- 56. Palmateer N., Hutchinson S., McAllister G., Munro A., Cameron S., Goldberg D. et al Risk of transmission associated with sharing drug injecting paraphernalia: analysis of recent hepatitis C virus (HCV) infection using cross‐sectional survey data. J Viral Hepatitis 2014; 21: 25–32. [DOI] [PubMed] [Google Scholar]
- 57. Strathdee S. A., Patrick D. M., Currie S. L., Cornelisse P. G., Rekart M. L., Montaner J. S. et al Needle exchange is not enough: lessons from the Vancouver injecting drug use study. AIDS 1997; 11: F59–F65. [DOI] [PubMed] [Google Scholar]
- 58. Wiessing L., Likatavicius G., Klempova D., Hedrich D., Nardone A., Griffiths P. Associations between availability and coverage of HIV‐prevention measures and subsequent incidence of diagnosed HIV infection among injection drug users. Am J Public Health 2009; 99: 1049–1052. [DOI] [PMC free article] [PubMed] [Google Scholar]
- 59. Des Jarlais D. C., Nugent A., Solberg A., Feelemyer J., Mermin J., Holtzman D. Syringe service programs for persons who inject drugs in urban, suburban, and rural areas—United States, 2013. Morb Mortal Wkly Rep 2015; 64: 1337–1341. [DOI] [PubMed] [Google Scholar]
- 60. Wood E., Lloyd‐Smith E., Li K., Strathdee S. A., Small W., Tyndall M. W. et al Frequent needle exchange use and HIV incidence in Vancouver, Canada. Am J Med 2007; 120: 172–179. [DOI] [PubMed] [Google Scholar]
- 61. Hagan H., McGough J. P., Thiede H., Hopkins S. G., Weiss N. S., Alexander E. R. Volunteer bias in nonrandomized evaluations of the efficacy of needle‐exchange programs. J Urban Health 2000; 77: 103–112. [DOI] [PMC free article] [PubMed] [Google Scholar]
- 62. Barbui C. Do Cochrane systematic reviews meet WHO needs? Addiction 2015; 110: 899–900. [DOI] [PubMed] [Google Scholar]
- 63. Davoli M., Amato L., Clark N., Farrell M., Hickman M., Hill S. et al The role of Cochrane reviews in informing international guidelines: a case study of using the grading of recommendations, assessment, development and evaluation system to develop World Health Organization guidelines for the psychosocially assisted pharmacological treatment of opioid dependence. Addiction 2015; 110: 891–898. [DOI] [PubMed] [Google Scholar]
- 64. Lawlor D. A., Davey Smith G., Ebrahim S. Commentary: The hormone replacement–coronary heart disease conundrum: is this the death of observational epidemiology? Int J Epidemiol 2004; 33: 464–467. [DOI] [PubMed] [Google Scholar]
- 65. Iversen J., Page K., Madden A., Maher L. HIV, HCV and health‐related harms among women who inject drugs: implications for prevention and treatment. J Acquir Immune Defic Syndr 2015; 69: S176–S181. [DOI] [PMC free article] [PubMed] [Google Scholar]
- 66. Miller C. L., Wood E., Spittal P. M., Li K., Frankish J. C., Braitstein P. et al The future face of coinfection: prevalence and incidence of HIV and hepatitis C virus coinfection among young injection drug users. J Acquir Immune Defic Syndr 2004; 36: 743–749. [DOI] [PubMed] [Google Scholar]
- 67. Tracy D., Hahn J. A., Fuller Lewis C., Evans J., Briceno A., Morris M. D. et al Higher risk of incident hepatitis C virus among young women who inject drugs compared with young men in association with sexual relationships: a prospective analysis from the UFO study cohort. BMJ Open 2014; 4; e004988. [DOI] [PMC free article] [PubMed] [Google Scholar]
- 68. Sederer L. I., Sharfstein S. S. Fixing the troubled mental health system. JAMA 2014; 312: 1195–1196. [DOI] [PubMed] [Google Scholar]
- 69. Vickerman P., Martin N., Turner K., Hickman M. Can needle and syringe programmes and opiate substitution therapy achieve substantial reductions in hepatitis C virus prevalence? Model projections for different epidemic settings. Addiction 2012; 107: 1984–1995. [DOI] [PubMed] [Google Scholar]
- 70. Vickerman P., Platt L., Jolley E., Rhodes T., Kazatchkine M. D., Latypov A. Controlling HIV among people who inject drugs in Eastern Europe and Central Asia: insights from modeling. Int J Drug Policy 2014; 25: 1163–1173. [DOI] [PubMed] [Google Scholar]
- 71. Mathers B. M., Degenhardt L., Ali H., Wiessing L., Hickman M., Mattick R. P. et al Reference Group to the UN on HIV and Injecting Drug Use. HIV prevention, treatment, and care services for people who inject drugs: a systematic review of global, regional, and national coverage. Lancet 2010; 375: 1014–1028. [DOI] [PubMed] [Google Scholar]
- 72. Martin N. K., Vickerman P., Foster G. R., Hutchinson S. J., Goldberg D. J., Hickman M. Can antiviral therapy for hepatitis C reduce the prevalence of HCV among injecting drug user populations? A modeling analysis of its prevention utility. J Hepatol 2011; 54: 1137–1144. [DOI] [PubMed] [Google Scholar]
Associated Data
This section collects any data citations, data availability statements, or supplementary materials included in this article.
Supplementary Materials
Table S1 Risk of bias of included studies.
Figure S1 Impact of current use of opioid substitution therapy (OST) versus no OST on hepatitis C virus (HCV) incidence from studies adjusting for confounders but excluding those judged to be at critical risk of bias.
Figure S2 Impact of current use of opioid substitution therapy (OST) versus no OST on hepatitis C virus (HCV) incidence from studies adjusting for confounders but excluding cross‐sectional study designs.
Figure S3 Impact of current use of opioid substitution therapy (OST) versus no OST on hepatitis C virus (HCV) incidence from studies adjusting for confounders but excluding unpublished data sets.
Figure S4 Impact of current use of opioid substitution therapy (OST) versus no OST on hepatitis C virus (HCV) incidence from unadjusted studies.
Figure S5 Impact of high‐coverage needle and syringe programmes (NSP) versus no or low coverage on hepatitis C virus (HCV) incidence from studies adjusting for confounders but excluding unpublished data sets.
Figure S6 Funnel plot of 12 studies included in meta‐analysis of studies regarding the impact of opioid substitution therapy (OST) in relation to hepatitis C virus (HCV) incidence among people who inject drugs.
Figure S7 Funnel plot of 5 studies included in meta‐analysis of studies regarding the impact of high‐coverage needle and syringe programmes (NSP) in relation to hepatitis C virus (HCV) incidence among people who inject drugs.