

Abstract
Aims
To investigate the efficacy and safety of insulin glargine 300 U/mL (Gla‐300) vs insulin glargine 100 U/mL (Gla‐100) over 12 months in a patient‐level meta‐analysis, using data from the EDITION studies in people with type 2 diabetes (T2DM).
Methods
EDITION 1, 2 and 3 were multicentre, randomized, open‐label, 2‐arm, parallel‐group, treat‐to‐target phase IIIa studies. Similar study designs and endpoints enabled a meta‐analysis to be conducted.
Results
Reductions in glycated haemoglobin (HbA1c) were better sustained over 12 months with Gla‐300 than with Gla‐100 (least squares [LS] mean difference in change from baseline: −0.10 % [95% confidence interval {CI} −0.18 to −0.02] or −1.09 mmol/mol [95% CI −2.01 to −0.20]; P = .0174). Risk of confirmed (≤3.9 mmol/L) or severe hypoglycaemia was 15% lower with Gla‐300 vs Gla‐100 at night (relative risk 0.85 [95% CI 0.77–0.92]) and 6% lower at any time of day (relative risk 0.94 [95% CI 0.90–0.98]). Rates of hypoglycaemia were 18% lower with Gla‐300 vs Gla‐100 at night (rate ratio 0.82 [95% CI 0.67–0.99]), but comparable at any time of day. HbA1c <7.0 % without nocturnal hypoglycaemia was achieved by 24% more participants with Gla‐300 than with Gla‐100 (relative risk 1.24 [95% CI 1.03–1.50]). Severe hypoglycaemia was rare; in both treatment groups the incidence of events at any time of day was ≤3.6%, while rates were ≤0.08 events per participant‐year.
Conclusions
In a broad population of people with T2DM over 12 months, use of Gla‐300 provided more sustained glycaemic control and significantly lower hypoglycaemia risk at night and at any time of day compared with Gla‐100.
Keywords: glycaemic control, hypoglycaemia, insulin analogues, meta‐analysis, phase III study, type 2 diabetes
1. INTRODUCTION
Insulin is recommended for the management of type 2 diabetes (T2DM) once glycaemic targets can no longer be achieved using other antihyperglycaemic agents.1 After the initiation of insulin therapy, factors such as hypoglycaemia may reduce adherence to insulin and compromise glycaemic control.2, 3 Currently, there is little evidence from studies in people with T2DM that lowering of hypoglycaemia risk with newer insulin analogues, such as insulin glargine 300 U/mL (Gla‐300), is accompanied by better glycaemic control when compared with insulin glargine 100 U/mL (Gla‐100).
Gla‐300 has been shown to have more stable pharmacokinetic (PK) and pharmacodynamic (PD) profiles than Gla‐100, with a longer duration of action and less variable 24‐hour glucose profiles.4, 5 The efficacy and safety of Gla‐300 have been compared with those of Gla‐100 in the phase III EDITION programme across a broad population of people with T2DM and type 1 diabetes (T1DM).6, 7, 8, 9, 10, 11 A meta‐analysis of patient‐level data in T2DM from EDITION 1, 2 and 3 showed that, owing to its favourable PK/PD and 24‐hour glucose profiles,4, 5 Gla‐300 met the primary endpoint of non‐inferiority vs Gla‐100 in terms of glycated haemoglobin (HbA1c) reduction over 6 months, and was consistently associated with less hypoglycaemia.12
After the initial 6‐month treatment period, the EDITION 1, 2 and 3 studies included a 6‐month extension period, during which participants continued to receive their previously assigned basal insulin (Gla‐300 or Gla‐100).13, 14, 15 Here we report the efficacy and safety results from a patient‐level meta‐analysis of EDITION 1, 2 and 3, comparing Gla‐300 with Gla‐100 over the full 12‐month treatment period.
2. RESEARCH DESIGN AND METHODS
2.1. Study design and participants
EDITION 1, 2 and 3 were multicentre, randomized, open‐label, 2‐arm, parallel‐group, treat‐to‐target phase IIIa studies (NCT01499082, NCT01499095, NCT01676220), the details of which have been previously described.6, 9, 11 In brief, the studies included a 6‐month treatment period and a 6‐month extension period. All participants were aged ≥18 years, with a diagnosis of T2DM (according to World Health Organization criteria).16 In EDITION 1, participants had established basal insulin therapy with ≥42 U/d of either Gla‐100 or NPH insulin, together with mealtime insulin with or without metformin, for at least 1 year.9 In EDITION 2, participants had at least 6 months on basal insulin treatment (of ≥42 U/d of either Gla‐100 or NPH insulin) in combination with antihyperglycaemic agents other than insulin (excluding sulphonylureas for 2 months prior to randomization).11 In EDITION 3, participants had used antihyperglycaemic agents other than insulin for at least 6 months prior to screening and were insulin‐naïve.6 Exclusion criteria included HbA1c <7.0 % for all 3 studies, HbA1c >10.0 % for EDITION 1 and 2, and >11.0 % for EDITION 3.6, 9, 11 The appropriate ethics committees approved the study protocols and the studies were conducted according to Good Clinical Practice and the Declaration of Helsinki. All participants provided written, informed consent.
Although the EDITION 1, 2 and 3 studies were conducted in different populations, the consistent study designs (as described above) and endpoints (see section 2.3) allowed the pooled analysis to be performed.
2.2. Treatment
Participants in all studies were randomized (1:1) to receive once‐daily subcutaneous injections of either Gla‐300 (Sanofi; using a modified SoloSTAR pen‐injector in EDITION 1 and 2, and a modified Tactipen pen‐injector in EDITION 3) or Gla‐100 (Lantus [Sanofi]; using a SoloSTAR pen‐injector) for a 12‐month period.6, 9, 11 Injections were to be administered between pre‐dinner and bedtime at the same time each evening for each participant.6, 9, 11 All participants titrated basal insulin doses to a fasting self‐monitored plasma glucose target of 4.4 to 5.6 mmol/L (80–100 mg/dL).6, 9, 11
2.3. Endpoints of patient‐level meta‐analysis
A post hoc patient‐level meta‐analysis of EDITION 1, 2 and 3 was carried out for the following efficacy endpoints: change in HbA1c from baseline to month 12; proportion of participants with HbA1c <7.0 % (<53 mmol/mol) at month 12; and change in insulin dose. This analysis also evaluated composite endpoints, defined as the percentage of participants achieving HbA1c targets (HbA1c <7.0 % or <7.5 %, or HbA1c reduction ≥0.5 %) without any confirmed (≤3.9 mmol/L [≤70 mg/dL] or <3.0 mmol/L [<54 mg/dL]) or severe hypoglycaemia, or documented symptomatic (≤3.9 mmol/L [≤70 mg/dL] or <3.0 mmol/L [<54 mg/dL]) hypoglycaemia, at night (12 am to 5:59 am) and at any time (24 hours) over 12 months of treatment. Safety and tolerability endpoints included the percentages of participants reporting ≥1 hypoglycaemic event and annualized rates (events per participant‐year) of hypoglycaemic events, based on American Diabetes Association definitions.17 The analysis also evaluated change in body weight and adverse events.
2.4. Data analysis and statistics
Change in HbA1c was analysed using a mixed model for repeated measures. Efficacy endpoints were analysed according to the treatment group assigned at randomization and using the modified intention‐to‐treat (mITT) population, defined as all randomized participants who received at least 1 dose of study drug and had both a baseline and ≥1 post‐baseline assessment. Composite endpoints were analysed based on a Cochran–Mantel–Haenszel method, stratified by screening HbA1c (randomization strata: <8.0 and ≥8.0 %).
Safety endpoints were analysed according to the treatment received and using the safety population, which included all participants randomized and exposed to ≥1 dose of study drug. Percentage of participants reporting ≥1 hypoglycaemic event was estimated using the Cochran–Mantel–Haenszel method. The annualized rate of hypoglycaemia (events per participant‐year) was analysed using an overdispersed Poisson regression model. Body weight was assessed using an analysis of covariance (ANCOVA) model, from baseline to last on‐treatment value. Adverse events were analysed descriptively.
3. RESULTS
3.1. Study population
The patient‐level meta‐analysis of the EDITION 1, 2 and 3 T2DM studies included 2496 participants, of whom 1247 were randomized to Gla‐300 and 1249 were randomized to Gla‐100 (Figure S1). The mITT population included 1239 and 1235 participants receiving Gla‐300 and Gla‐100, respectively. Overall, 1011 participants receiving Gla‐300 (81.1%) and 983 receiving Gla‐100 (78.7%) completed the 12‐month on‐treatment period. Baseline characteristics from the individual study populations and the pooled analysis population have been previously reported.6, 9, 11, 12
3.2. Glycaemic control
HbA1c was reduced from baseline in both the Gla‐300 and Gla‐100 groups. Least squares (LS) mean (standard error [s.e.]) change from baseline to month 12 was −0.91 (0.03) % (−9.95 [0.33] mmol/mol) with Gla‐300 and −0.80 (0.03) % (−8.74 [0.33] mmol/mol) with Gla‐100; the LS mean difference between groups was −0.10% (95% confidence interval [CI] −0.18 to 0.02) or −1.09 mmol/mol (95% CI −2.01 to −0.20); P = .0174 (Figure 1).
Figure 1.
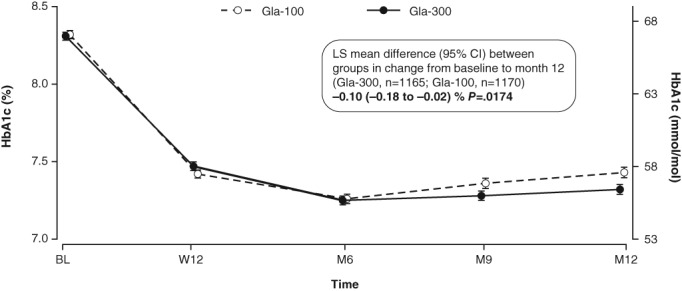
HbA1c (mean ± s.e.) over the 12‐month treatment period (mITT population). LS mean difference analysed using a mixed model for repeated measures. BL, baseline; M, month; W, week
3.3. Confirmed (≤3.9 mmol/L [≤70 mg/dL]) or severe hypoglycaemia
The percentage of participants experiencing ≥1 confirmed (≤3.9 mmol/L [≤70 mg/dL]) or severe hypoglycaemic event during the night (12 am to 5.59 am) and at any time of day (24 hours) was significantly lower with Gla‐300 than with Gla‐100 over the 12‐month period (Figure 2 and Table S1).
Figure 2.
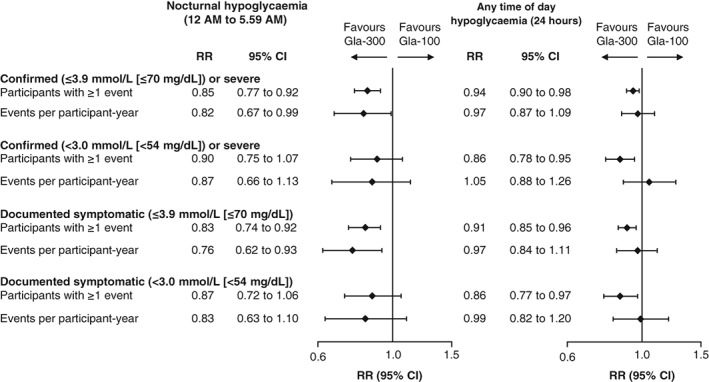
Percentage of participants with ≥1 hypoglycaemic event and annualized event rate (events per participant‐year) over the 12‐month treatment period (safety population). RR, relative risk for percentage of participants with ≥1 event, rate ratio for annualized event rates
The annualized rate (events per participant‐year) of nocturnal (12 am to 5.59 am) confirmed (≤3.9 mmol/L [≤70 mg/dL]) or severe hypoglycaemia was significantly lower with Gla‐300 than with Gla‐100 over the 12‐month treatment period (rate ratio 0.82 [95% CI 0.67 to 0.99]; Figure 2 and Table S1), whereas the annualized rate of confirmed (≤3.9 mmol/L [≤70 mg/dL]) or severe hypoglycaemia at any time of day (24 hours) was comparable in the 2 treatment groups over 12 months of treatment (rate ratio 0.97 [95% CI 0.87 to 1.09]; Figure 2 and Table S1).
When analysed by clock time, the percentage of participants with ≥1 confirmed (≤3.9 mmol/L [≤70 mg/dL]) or severe hypoglycaemic event, and rates of this category of hypoglycaemia, were numerically lower with Gla‐300 than with Gla‐100 during the night and early morning hours (Figure 3).
Figure 3.
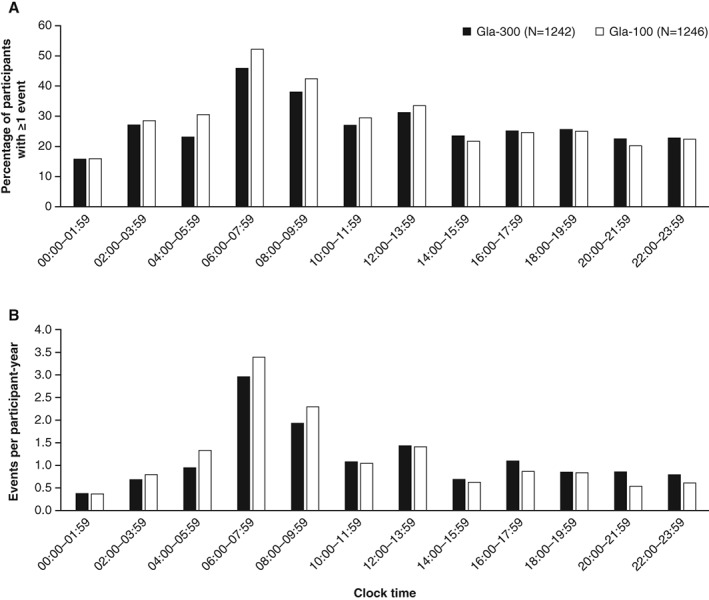
Confirmed (≤3.9 mmol/L [≤70 mg/dL]) or severe hypoglycaemia by time of day over the 12‐month treatment period. A, Percentage of participants with ≥1 event and B, annualized event rates (events per participant‐year; safety population)
3.4. Other categories of hypoglycaemia
During the 12‐month treatment period, a significantly lower percentage of participants reported ≥1 documented symptomatic (≤3.9 mmol/L [≤70 mg/dL]) hypoglycaemic event with Gla‐300 than with Gla‐100 during the night (12 am to 5.59 am) and at any time of day (24 hours; Figure 2 and Table S1). The annualized rate of documented symptomatic (≤3.9 mmol/L [≤70 mg/dL]) hypoglycaemic events over 12 months was significantly lower for Gla‐300 than for Gla‐100 during the night (12 am to 5.59 am) and was comparable in the 2 treatments at any time of day (24 hours; Figure 2 and Table S1).
When considering a more stringent hypoglycaemic threshold (<3.0 mmol/L [<54 mg/dL]), the percentage of participants experiencing ≥1 confirmed or severe hypoglycaemic event with Gla‐300 vs Gla‐100 was comparable during the night (12 am to 5.59 am) and significantly lower at any time of day (24 hours; Figure 2 and Table S1). The annualized rate of confirmed (<3.0 mmol/L [<54 mg/dL]) or severe hypoglycaemia for Gla‐300 and Gla‐100 was comparable during the night (12 am to 5.59 am) and at any time of day (24 hours) over the 12‐month period (Figure 2 and Table S1). A similar pattern was seen for documented symptomatic (<3.0 mmol/L [<54 mg/dL]) hypoglycaemia (Figure 2 and Table S1).
3.5. Severe hypoglycaemia
Severe hypoglycaemia was rare in both treatment groups. The number of participants with ≥1 severe hypoglycaemic event at any time of day (24 hours) over 12 months was 40 (3.2%) with Gla‐300 and 45 (3.6%) with Gla‐100 (Table S1). Annualized rates of severe hypoglycaemia were 0.08 events per participant‐year in the Gla‐300 group and 0.07 events per participant‐year in the Gla‐100 group.
3.6. Composite endpoints
Compared with Gla‐100‐treated participants, a greater percentage of participants in the Gla‐300 group achieved HbA1c targets (HbA1c <7.0 % or <7.5 % or HbA1c reduction ≥0.5 %) without experiencing confirmed (≤3.9 mmol/L [≤70 mg/dL]) or severe hypoglycaemia during the night (12 AM to 5.59 AM; Figure 4 and Table S2). For hypoglycaemic events at any time (24 hours) the difference in the percentage of participants achieving composite endpoints was statistically significant for HbA1c reduction ≥0.5 % without confirmed (≤3.9 mmol/L [≤70 mg/dL]) or severe hypoglycaemia.
Figure 4.
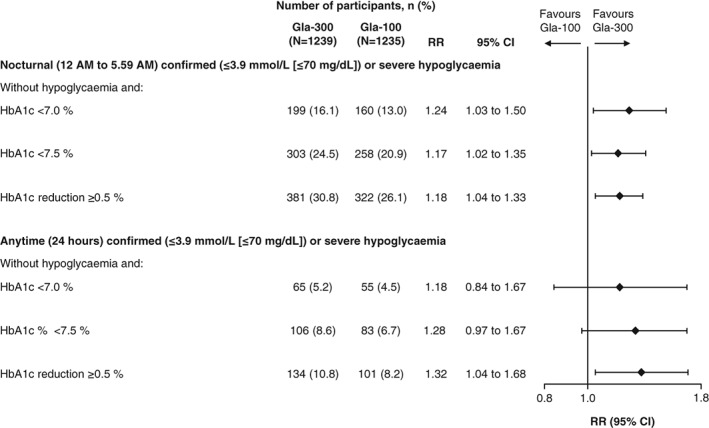
Percentage of participants achieving HbA1c targets (HbA1c <7.0 % or <7.5 % or HbA1c reduction ≥0.5 %) at month 12 without confirmed (≤3.9 mmol/L [≤70 mg/dL]) or severe hypoglycaemia over 12 months of treatment (mITT population). RR, relative risk
When considering other categories of hypoglycaemia, the percentage of participants achieving HbA1c targets (HbA1c <7.0 % or <7.5 % or HbA1c reduction ≥0.5 %) without experiencing a hypoglycaemic event, both at night and at any time, was either higher or comparable in the Gla‐300 compared with the Gla‐100 group (Table S2).
3.7. Insulin dose
During the 12‐month treatment period, the daily basal insulin dose increased in both treatment groups, but to a greater extent with Gla‐300 than Gla‐100 (Figure 5). The mean (s.e.) basal insulin dose at 12 months was 14% higher with Gla‐300 than Gla‐100 (P < .0001) and averaged 0.89 (0.01) U/kg/d for Gla‐300 and 0.78 (0.01) U/kg/d for Gla‐100. The mean (standard deviation [s.d.]) change in daily basal insulin dose from baseline to month 12 was 0.39 (0.01) U/kg with Gla‐300 and 0.27 (0.01) U/kg with Gla‐100, and the majority of the increase in insulin dose (76% for Gla‐300 and 81% for Gla‐100) occurred during the first 12 weeks (Figure 5).
Figure 5.
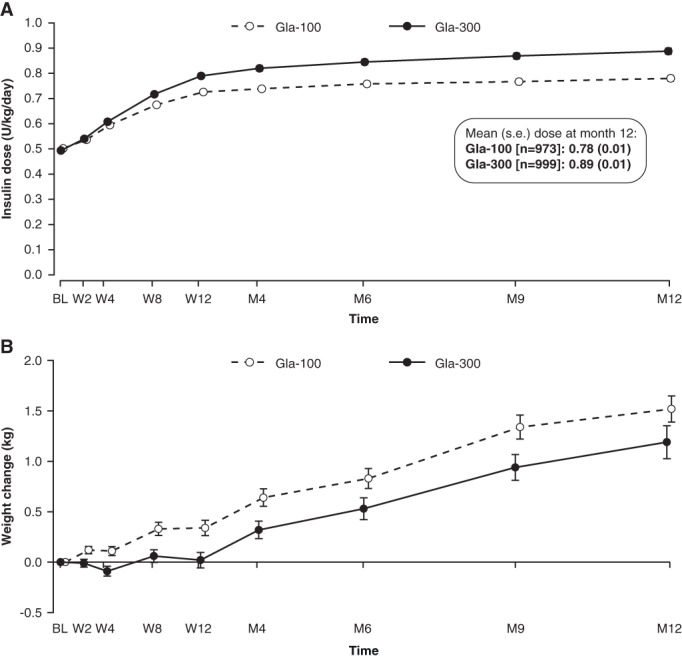
A, Mean (± s.e.) daily basal insulin dose over 12 months of treatment (mITT population) and B, mean (± s.e.) change in body weight from baseline to month 12 (safety population). BL, baseline; M, month; W, week
3.8. Body weight
Significantly less weight gain was observed for participants treated with Gla‐300 compared with those treated with Gla‐100 during the 12‐month period (Figure 5; LS mean [s.e.] change 0.85 [0.11] kg and 1.25 [0.11] kg, respectively; LS mean difference between groups −0.40 kg [95% CI −0.71 to −0.09]; P = .01). The majority of the between‐treatment difference in weight gain occurred during the first 12 weeks (Figure 5).
3.9. Adverse events
The incidence of adverse events was similar in the 2 treatment groups (Table S3). Treatment‐emergent adverse events (TEAEs) were reported by 67.7% of participants in the Gla‐300 group and 64.0% in the Gla‐100 group. Injection site reactions were reported by 3.0% of participants in the Gla‐300 group and 3.5% of participants in the Gla‐100 group. Treatment‐emergent serious adverse events were reported by 9.5% and 10.5% of participants in the Gla‐300 and Gla‐100 groups, respectively. Overall, 29 participants in each group discontinued treatment owing to a TEAE. Seven participants in the Gla‐300 group and 6 in the Gla‐100 group had a TEAE leading to death; for 1 of these participants (EDITION 2, Gla‐300 group) a relationship between the TEAE (acute myocardial infarction) and the study medication could not be excluded.
4. DISCUSSION
Newer basal insulins, such as Gla‐300, have been developed to overcome the limitations of older insulin preparations in terms of stability of PK/PD profiles and duration of action. In this 1‐year patient‐level meta‐analysis of EDITION 1, 2 and 3, including a broad population of people with T2DM, use of Gla‐300 resulted in a HbA1c reduction that was better sustained over 12 months than that achieved with use of Gla‐100, and was accompanied by a lower risk of confirmed (≤3.9 mmol/L [≤70 mg/dL]) or severe hypoglycaemia during the night (12 am to 5.59 am) and at any time of day (24 hours). Weight gain was significantly less with Gla‐300 than with Gla‐100. The present meta‐analysis also showed that the percentage of patients reaching HbA1c < 7.0 % without confirmed (≤3.9 mmol/L [≤70 mg/dL]) or severe hypoglycaemia at night was higher with Gla‐300 vs Gla‐100. Consistent with the well‐established safety profile of Gla‐100, and the comparable metabolic profile of Gla‐300 and Gla‐100,18 no new safety signals were identified in this 12‐month meta‐analysis, and adverse event profiles were comparable in the 2 treatment groups.
As reported for 6‐month data,12 the results from this 1‐year patient‐level meta‐analysis of EDITION 1, 2 and 3 showed that HbA1c was reduced with both Gla‐300 and Gla‐100. When assessed over a longer follow‐up period in the present analysis, however, Gla‐300 was associated with more sustained HbA1c reduction compared with Gla‐100. It remains unknown from the present data whether this result is partially attributable to the slightly higher Gla‐300 insulin dose, or whether other mechanisms are also involved. It is interesting that while the differences in HbA1c levels between Gla‐300 and Gla‐100 at 12 months were small in the individual EDITION studies (EDITION 1, −0.17 %; EDITION 2, −0.06 %; EDITION 3, −0.08 %),14, 15 they were greatest for EDITION 1, in which participants combined Gla‐300 or Gla‐100 with mealtime insulin. In EDITION 1, the improved hypoglycaemia profile of Gla‐300 vs Gla‐100 may have enabled the participants to make more appropriate decisions regarding the adjustment of their basal and mealtime insulin doses as duration of treatment increased.14
As observed in the meta‐analysis of 6‐month data,12 the percentage of participants with ≥1 hypoglycaemic event that was confirmed (≤3.9 mmol/L [≤70 mg/dL]) or severe, or documented symptomatic (≤3.9 mmol/L [≤70 mg/dL]), was significantly lower with Gla‐300 than with Gla‐100 over 12 months of treatment, both at night (12 am to 5.59 am) and at any time (24 hours). The annualized rates using these definitions of nocturnal hypoglycaemia were also significantly lower with Gla‐300 vs Gla‐100 over the 12‐month treatment period; however, unlike the 6‐month results, the between‐group difference in annualized rate of anytime events was no longer significant over 12 months. One explanation may be that the anytime hypoglycaemia benefit of Gla‐300 vs Gla‐100 may be more difficult to demonstrate when rates of hypoglycaemia are reduced, after the initial dose‐titration period has passed and the daily insulin dose has stabilized. This was previously observed in people treated with glargine compared with people treated with NPH insulin added to metformin, with an initial HbA1c of ~9.5 % (80 mmol/mol).19 Another explanation may be related to the evening injection time of basal insulin in the majority of patients in the EDITION programme. The more stable PK/PD characteristics of Gla‐300 vs Gla‐100 explain the lower rates of subsequent nocturnal hypoglycaemia; however, the longer duration of action of Gla‐300, while overcoming any lack of control experienced by people on Gla‐100 in the late afternoon or early evening prior to the next basal insulin injection, may also result in slightly more hypoglycaemia at this time (this is supported by the data presented in Figure 3, although it should be noted that participants in EDITION 1 were also taking mealtime insulin). During the 6‐month extension period of the EDITION trials, with less overall glycaemic exposure compared with the first 6‐month period as evidenced by the HbA1c levels shown in Figure 1, this effect may be more prominent and selectively influence rates of anytime but not nocturnal hypoglycaemia.
The management of T2DM aims to achieve an optimal balance between glycaemic control and hypoglycaemia. In this regard, it is interesting to evaluate endpoints that encapsulate both of these aspects. This patient‐level meta‐analysis of EDITION 1, 2 and 3 showed that, over 12 months of treatment, a consistently higher percentage of participants achieved HbA1c targets (HbA1c <7.0 %, HbA1c <7.5 % and HbA1c reduction ≥0.5 %) without experiencing confirmed (≤3.9 mmol/L [≤70 mg/dL]) or severe hypoglycaemia in the Gla‐300 group than in the Gla‐100 group, although the between‐treatment differences were relatively small. As fear of hypoglycaemia can be a barrier to optimal insulin therapy,20, 21 and can impede glycaemic management,2 this finding indicates that Gla‐300 has the potential to confer greater clinical benefits than Gla‐100 when used in clinical practice. However, when interpreting the results of this composite endpoint analysis it is worth noting that while HbA1c represents glycaemic control in the ~3 months prior to the 12‐month time point, hypoglycaemia data were collected over the full 12‐month period.
Consistent with findings over 6 months,12 the reduced risk and rates of nocturnal hypoglycaemia with Gla‐300 vs Gla‐100 also continued to extend beyond the protocol‐defined nocturnal period (12 am to 5.59 am) and into the daytime. Although hypoglycaemic events occurring after waking may not inspire the level of fear of hypoglycaemia while asleep, such events are still clinically relevant.
Basal insulin dose increased in both treatment groups over 12 months of treatment, with the majority of the increase occurring during the first 12 weeks and very little change apparent thereafter. The increase in dose was seen to a greater extent with Gla‐300 than Gla‐100. As previously discussed,12 this difference between groups may be the result of increased residence time of Gla‐300 in the subcutaneous depot, thereby leading to longer exposure to tissue peptidases. Consequently, after subcutaneous injection the bioavailability of Gla‐300 from the injection site is slightly lower compared with Gla‐100. Regardless, the higher basal insulin dose with Gla‐300 did not adversely impact either hypoglycaemia or body weight; in fact, both hypoglycaemia risk and body weight gain were lower in the Gla‐300 group than in the Gla‐100 group.
A limitation of the present meta‐analysis is the open‐label nature of the individual studies, and that the meta‐analysis of the 12‐month data from the 3 studies was not pre‐planned. Another limitation is pooling data from studies including people with different disease stages and treatments, as this may obscure differences attributable to effects of therapy in particular subgroups of people.
In conclusion, in a large and broad population of people with T2DM, Gla‐300 was associated with more sustained glycaemic control, and with a lower risk of hypoglycaemia at night and at any time of day over 12 months of treatment, compared with Gla‐100. The ongoing large‐scale real‐life, randomized, pragmatic studies of Gla‐300 vs Gla‐10022, 23, 24 may provide more evidence about the benefits of Gla‐300 in clinical practice.
Supporting information
Figure S1. Participant flow diagram for the pooled population of EDITION 1, 2 and 3 over 12 months.
Table S1. Hypoglycaemia over 12 months (safety population).
Table S2. Percentage of participants achieving HbA1c targets (HbA1c <7.0% or <7.5% or HbA1c reduction ≥0.5%) at month 12 without hypoglycaemia over 12 months of treatment (mITT population).
Table S3. Adverse events over the 12‐month treatment period (safety population).
ACKNOWLEDGMENTS
This study was sponsored by Sanofi. The authors thank the study participants, trial staff, and investigators for their participation, and Monika Ziemen (Sanofi) for critical review of the manuscript. Editorial and writing assistance was provided by Simon Rees, PhD, and Kerry Knight, PhD, of Fishawack Communications and was funded by Sanofi. Soazig Chevalier of Sanofi contributed to the design and treatment considerations for the trial and was involved in the analysis and interpretation of the data.
Conflict of interest
R. Ritzel has served as a consultant for AstraZeneca, Merck (MSD), Novo Nordisk, Servier and Sanofi and on the speakers bureau for AstraZeneca, Bristol‐Myers Squibb, Eli Lilly, Merck (MSD), Novartis, Novo Nordisk and Sanofi. R. Roussel has served on advisory panels for AstraZeneca, Eli Lilly and Physiogenex, as a board member for Janssen, Merck (MSD), Novo Nordisk, Sanofi, and as a consultant for Eli Lilly, and has received research support from Amgen and Sanofi. A. G. has served as a consultant for AstraZeneca, Boehringer Ingelheim, Eli Lilly, Sanofi and Takeda, has received research support from AstraZeneca and Merck (MSD), and has served on the speakers bureau for AstraZeneca. J. V. has received research support and served on the advisory panel and speakers bureau for Abbott, AstraZeneca, Boehringer Ingelheim, Bristol‐Myers Squibb, Eli Lilly, GlaxoSmithKline, Merck (MSD), Novartis, Novo Nordisk, Roche, Sanofi and Takeda. C. B.‐W. is an employee of Sanofi. H. Y.‐J. has served on the advisory panel for Eli Lilly, Merck (MSD) and Sanofi, and as a consultant for Eli Lilly and Sanofi.
Author contributions
R. Ritzel and C. B.‐W. contributed towards the study design, data interpretation, drafting and critical revision of the manuscript. R. Roussel, A. G., J. V. and H. Y.‐J. contributed towards data interpretation, drafting and critical revision of the manuscript.
Ritzel R, Roussel R, Giaccari A, Vora J, Brulle‐Wohlhueter C, Yki‐Järvinen H. Better glycaemic control and less hypoglycaemia with insulin glargine 300 U/mL vs glargine 100 U/mL: 1‐year patient‐level meta‐analysis of the EDITION clinical studies in people with type 2 diabetes. Diabetes Obes Metab. 2018;20:541–548. https://doi.org/10.1111/dom.13105
Funding information
This study was sponsored by Sanofi.
REFERENCES
- 1. Inzucchi SE, Bergenstal RM, Buse JB, et al. Management of hyperglycemia in type 2 diabetes, 2015: a patient‐centered approach: update to a position statement of the American Diabetes Association and the European Association for the Study of Diabetes. Diabetes Care. 2015;38(1):140–149. [DOI] [PubMed] [Google Scholar]
- 2. Donnelly LA, Morris AD, Evans JM. Adherence to insulin and its association with glycaemic control in patients with type 2 diabetes. QJM. 2007;100(6):345–350. [DOI] [PubMed] [Google Scholar]
- 3. Peyrot M, Barnett AH, Meneghini LF, Schumm‐Draeger PM. Insulin adherence behaviours and barriers in the multinational Global Attitudes of Patients and Physicians in Insulin Therapy study. Diabet Med. 2012;29(5):682–689. [DOI] [PMC free article] [PubMed] [Google Scholar]
- 4. Becker RH, Dahmen R, Bergmann K, Lehmann A, Jax T, Heise T. New insulin glargine 300 Units·mL−1 provides a more even activity profile and prolonged glycemic control at steady state compared with insulin glargine 100 Units·mL−1. Diabetes Care. 2015;38(4):637–643. [DOI] [PubMed] [Google Scholar]
- 5. Bergenstal RM, Bailey TS, Rodbard D, et al. Comparison of insulin glargine 300 U/mL and 100 U/mL in adults with type 1 diabetes: continuous glucose monitoring profiles and variability using morning or evening injections. Diabetes Care. 2017;40(4):554–560. [DOI] [PubMed] [Google Scholar]
- 6. Bolli GB, Riddle MC, Bergenstal RM, et al. New insulin glargine 300 U/ml compared with glargine 100 U/ml in insulin‐naive people with type 2 diabetes on oral glucose‐lowering drugs: a randomized controlled trial (EDITION 3). Diabetes Obes Metab. 2015;17(4):386–394. [DOI] [PMC free article] [PubMed] [Google Scholar]
- 7. Home PD, Bergenstal RM, Bolli GB, et al. New insulin glargine 300 Units/mL versus glargine 100 Units/mL in people with type 1 diabetes: a randomized, phase 3a, open‐label clinical trial (EDITION 4). Diabetes Care. 2015;38(12):2217–2225. [DOI] [PubMed] [Google Scholar]
- 8. Matsuhisa M, Koyama M, Cheng X, et al. New insulin glargine 300 U/ml versus glargine 100 U/ml in Japanese adults with type 1 diabetes using basal and mealtime insulin: glucose control and hypoglycaemia in a randomized controlled trial (EDITION JP 1). Diabetes Obes Metab. 2016;18(4):375–383. [DOI] [PMC free article] [PubMed] [Google Scholar]
- 9. Riddle MC, Bolli GB, Ziemen M, et al. New insulin glargine 300 Units/mL versus glargine 100 Units/mL in people with type 2 diabetes using basal and mealtime insulin: glucose control and hypoglycemia in a 6‐month randomized controlled trial (EDITION 1). Diabetes Care. 2014;37(10):2755–2762. [DOI] [PubMed] [Google Scholar]
- 10. Terauchi Y, Koyama M, Cheng X, et al. New insulin glargine 300 U/ml versus glargine 100 U/ml in Japanese people with type 2 diabetes using basal insulin and oral antihyperglycaemic drugs: glucose control and hypoglycaemia in a randomized controlled trial (EDITION JP 2). Diabetes Obes Metab. 2016;18(4):366–374. [DOI] [PMC free article] [PubMed] [Google Scholar]
- 11. Yki‐Järvinen H, Bergenstal R, Ziemen M, et al. New insulin glargine 300 Units/mL versus glargine 100 Units/mL in people with type 2 diabetes using oral agents and basal insulin: glucose control and hypoglycemia in a 6‐month randomized controlled trial (EDITION 2). Diabetes Care. 2014;37(12):3235–3243. [DOI] [PubMed] [Google Scholar]
- 12. Ritzel R, Roussel R, Bolli GB, et al. Patient‐level meta‐analysis of the EDITION 1, 2 and 3 studies: glycaemic control and hypoglycaemia with new insulin glargine 300 U/ml versus glargine 100 U/ml in people with type 2 diabetes. Diabetes Obes Metab. 2015;17(9):859–867. [DOI] [PMC free article] [PubMed] [Google Scholar]
- 13. ClinicalTrials.gov . Comparison of a new formulation of insulin glargine with lantus in patients with type 2 diabetes on non‐insulin antidiabetic therapy (EDITION III). 2015 https://clinicaltrials.gov/ct2/show/NCT01676220. Accessed April 18, 2016.
- 14. Riddle MC, Yki‐Järvinen H, Bolli GB, et al. One‐year sustained glycaemic control and less hypoglycaemia with new insulin glargine 300 U/ml compared with 100 U/ml in people with type 2 diabetes using basal plus meal‐time insulin: the EDITION 1 12‐month randomized trial, including 6‐month extension. Diabetes Obes Metab. 2015;17(9):835–842. [DOI] [PMC free article] [PubMed] [Google Scholar]
- 15. Yki‐Järvinen H, Bergenstal RM, Bolli GB, et al. Glycaemic control and hypoglycaemia with new insulin glargine 300 U/ml versus insulin glargine 100 U/ml in people with type 2 diabetes using basal insulin and oral antihyperglycaemic drugs: the EDITION 2 randomized 12‐month trial including 6‐month extension. Diabetes Obes Metab. 2015;17:1142–1149. [DOI] [PMC free article] [PubMed] [Google Scholar]
- 16. WHO . Definition, Diagnosis and Classification of Diabetes Mellitus and its Complications: Report of a WHO Consultation. Part 1: Diagnosis and Classification of Diabetes Mellitus. Geneva, Switzerland: WHO; 1999. http://whqlibdoc.who.int/hq/1999/who_ncd_ncs_99.2.pdf. Accessed November 6, 2013. [Google Scholar]
- 17. American Diabetes Association . Defining and reporting hypoglycemia in diabetes: a report from the American Diabetes Association Workgroup on Hypoglycemia. Diabetes Care. 2005;28(5):1245–1249. [DOI] [PubMed] [Google Scholar]
- 18. Steinstraesser A, Schmidt R, Bergmann K, Dahmen R, Becker RH. Investigational new insulin glargine 300 U/ml has the same metabolism as insulin glargine 100 U/ml. Diabetes Obes Metab. 2014;16(9):873–876. [DOI] [PMC free article] [PubMed] [Google Scholar]
- 19. Yki‐Järvinen H, Kauppinen‐Mäkelin R, Tiikkainen M, et al. Insulin glargine or NPH combined with metformin in type 2 diabetes: the LANMET study. Diabetologia. 2006;49:442–451. [DOI] [PubMed] [Google Scholar]
- 20. Nam S, Chesla C, Stotts NA, Kroon L, Janson SL. Factors associated with psychological insulin resistance in individuals with type 2 diabetes. Diabetes Care. 2010;33:1747–1749. [DOI] [PMC free article] [PubMed] [Google Scholar]
- 21. Polonsky WH, Fisher L, Guzman S, Villa‐Caballero L, Edelman SV. Psychological insulin resistance in patients with type 2 diabetes: the scope of the problem. Diabetes Care. 2005;28:2543–2545. [DOI] [PubMed] [Google Scholar]
- 22. Oster G, Sullivan SD, Dalal MR, et al. Achieve control: a pragmatic clinical trial of insulin glargine 300 U/mL versus other basal insulins in insulin‐naive patients with type 2 diabetes. Postgrad Med. 2016;128:731–739. [DOI] [PubMed] [Google Scholar]
- 23. ClinicalTrials.gov . A “Real World” trial to determine efficacy and health outcomes of toujeo compared to “Standard of Care” basal insulins in insulin naïve patients initiating insulin (Reach‐Control). 2016. https://clinicaltrials.gov/ct2/show/NCT02967224. Accessed 15 May 2017.
- 24. ClinicalTrials.gov . A “Real World” trial to determine efficacy and health outcomes of toujeo compared to “Standard of Care” basal insulin in patients already using basal insulin (REGAIN CONTROL). 2016. https://clinicaltrials.gov/ct2/show/NCT02967211. Accessed 15 May 2017.
Associated Data
This section collects any data citations, data availability statements, or supplementary materials included in this article.
Supplementary Materials
Figure S1. Participant flow diagram for the pooled population of EDITION 1, 2 and 3 over 12 months.
Table S1. Hypoglycaemia over 12 months (safety population).
Table S2. Percentage of participants achieving HbA1c targets (HbA1c <7.0% or <7.5% or HbA1c reduction ≥0.5%) at month 12 without hypoglycaemia over 12 months of treatment (mITT population).
Table S3. Adverse events over the 12‐month treatment period (safety population).