Summary
Huntingtin (Htt) is a large (348 kDa) protein, essential for embryonic development and involved in diverse cellular activities such as vesicular transport, endocytosis, autophagy and transcription regulation1,2. While an integrative understanding of Htt's biological functions is lacking, the large number of identified interactors suggests that Htt serves as a protein-protein interaction hub1,3,4. Furthermore, Huntington’s disease is caused by a mutation in the Htt gene, resulting in a pathogenic expansion of a polyglutamine (polyQ) repeat at the N-terminus of Htt5,6. However, only limited structural information on Htt is currently available. Here we employed cryo-electron microscopy (cryo-EM) to determine the structure of full-length human Htt in a complex with HAP40/F8A7 to 4 Å resolution. Htt is largely α-helical and consists of three major domains. The N- and C-terminal domains contain multiple HEAT repeats arranged in a solenoid fashion. These domains are connected by a smaller bridge domain containing different types of tandem repeats. HAP40 is also largely α-helical and has a tetratricopeptide repeat (TPR)-like organization. HAP40 binds in a cleft contacting the three Htt domains by hydrophobic and electrostatic interactions, thereby stabilizing Htt conformation. These data rationalize previous biochemical results and pave the way for an improved understanding of Htt’s diverse cellular functions.
Computational and biochemical studies on Htt have predicted a variable number of HEAT repeats interspersed by unstructured regions8–12. However, attempts to determine the structure of Htt at high resolution have been hindered by its flexibility13–15. Most structural studies have focused on an N-terminal fragment corresponding to the first exon of the Htt gene, while the majority of the protein (>97 % of its amino acid length) remains largely uncharted14. To overcome this hurdle we searched for interaction partners that could stabilize the structure of Htt. A first screen using polyQ-expanded full-length human Htt (46QHtt) expressed at low levels in HEK293 cells identified abundant binding with HAP40/F8A (Fig. 1a), previously characterized as a Htt interactor7 that recruits Htt to early endosomes16. Although a complex of Htt and HAP40 could not be reconstituted from the individual proteins in vitro, the complex was purified at high yield from human cells co-expressing both full-length human 17QHtt and HAP40 (Fig. 1b). Whereas Htt alone formed oligomers and tended to aggregate17, the Htt-HAP40 complex eluted as a symmetric narrow peak upon size-exclusion chromatography (Fig. 1c). Consistently, ultracentrifugation analysis indicated that the Htt-HAP40 complex was more conformationally homogeneous than Htt alone (Extended Data Fig. 1). The Htt-HAP40 complex - but not its isolated components - showed a sharp, strong unfolding transition in differential scanning fluorimetry assays (Fig. 1d), confirming that the Htt-HAP40 complex was stable and could be amenable to structural studies18.
Fig. 1. Purification of the Htt-HAP40 complex.
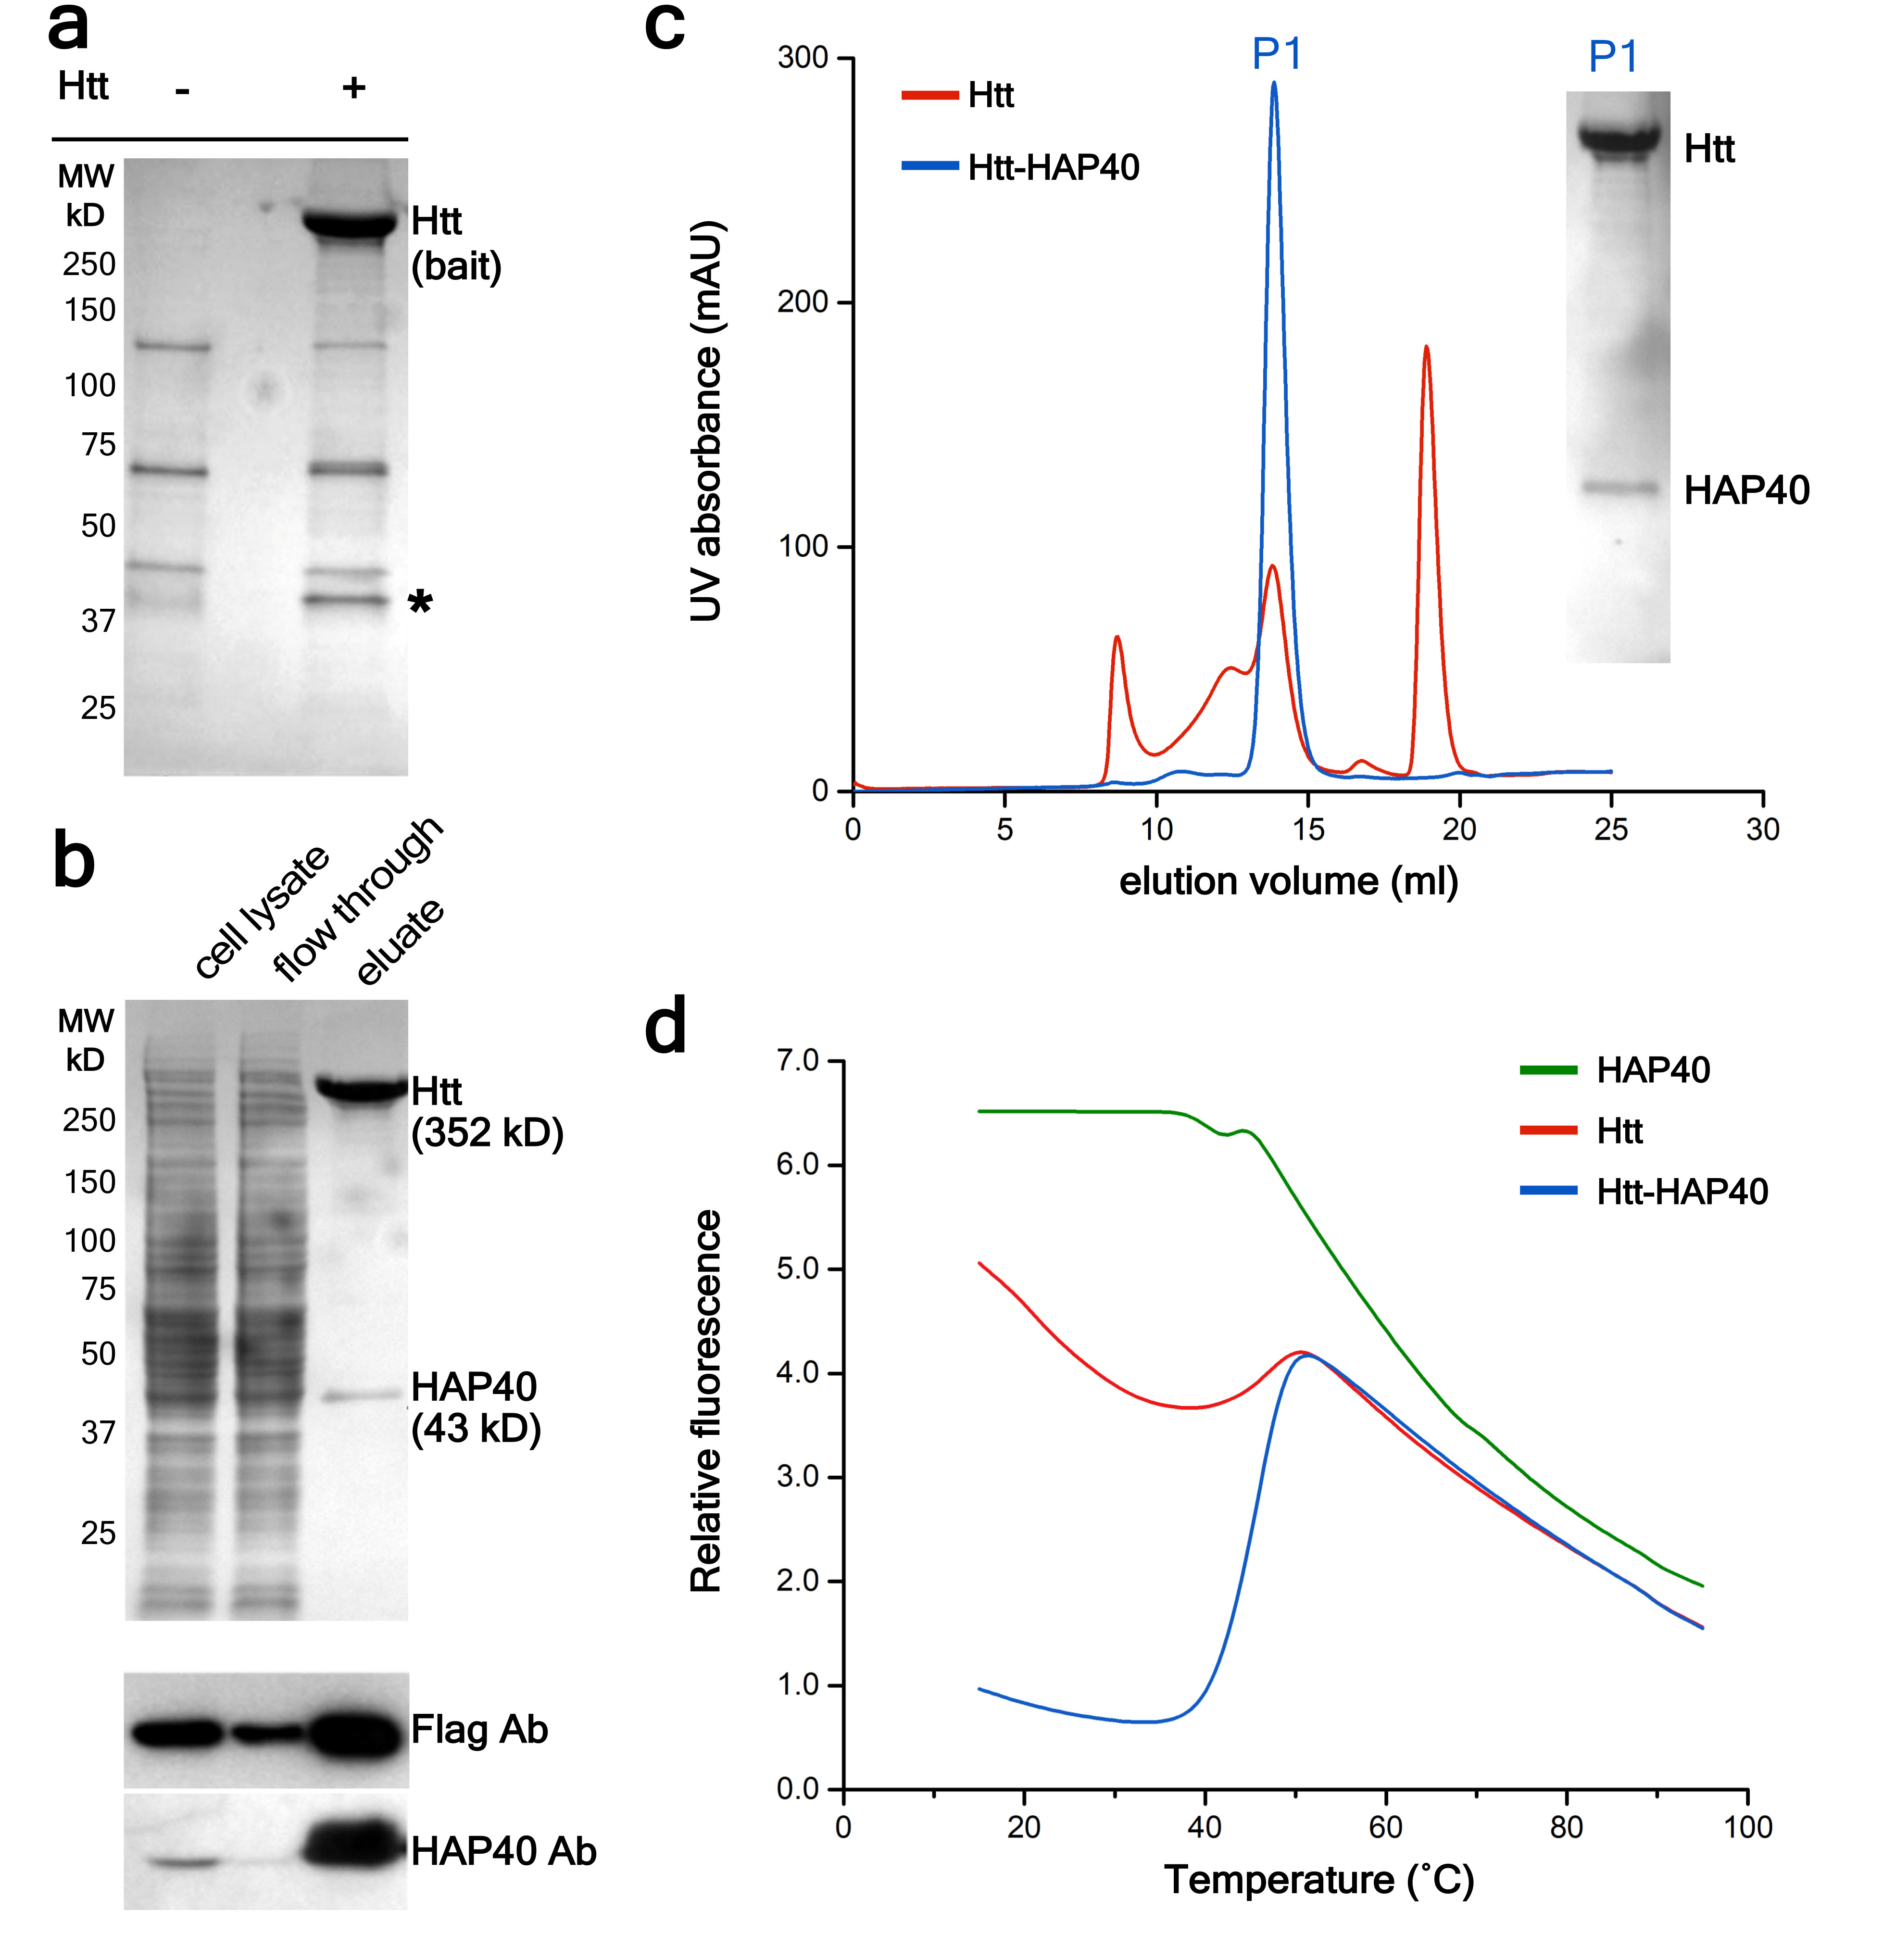
a, Identification of HAP40 as a major Htt interactor in HEK293 cells expressing low levels of FLAG-tagged 46QHtt17 (+) or not expressing FLAG-tagged Htt (-). Coomassie-stained gel after PAGE following FLAG-affinity purification. The band indicated by * was identified as HAP40 by mass spectrometry and Western blot. b, Purification of the Htt-HAP40 complex from HEK293-based cells expressing FLAG-tagged 17QHtt and Strep-tagged HAP40. Cleared lysates were incubated with Strep-Tactin beads and washed with desthiobiotin to elute bound proteins. Top, Coomassie-staining. Bottom, Western blot. c, elution profile of Htt alone (red) versus the Htt-HAP40 complex (blue). Inset, Coomassie-staining of the P1 peak of the elution profile of the Htt-HAP40 complex. d, Thermal unfolding and complex stabilization. Melting curves of Htt, HAP40 and the Htt-HAP40 complex obtained by differential scanning fluorimetry. Independent experiments with similar results (n): a: n=2; b: n=3; c: n=3; d: n=2. For source data, see Supplementary Figure 1.
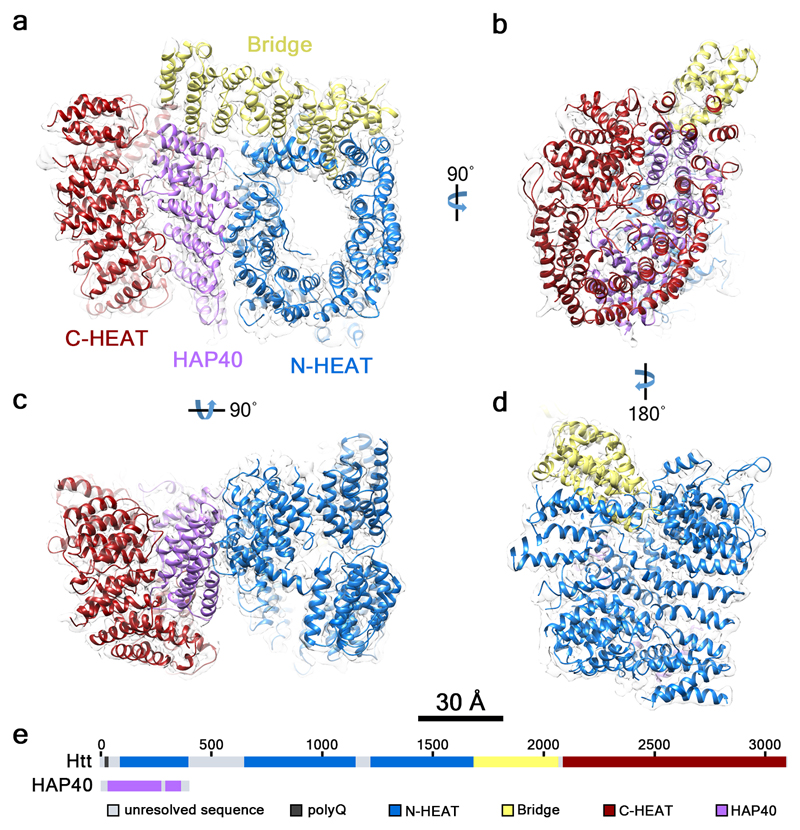
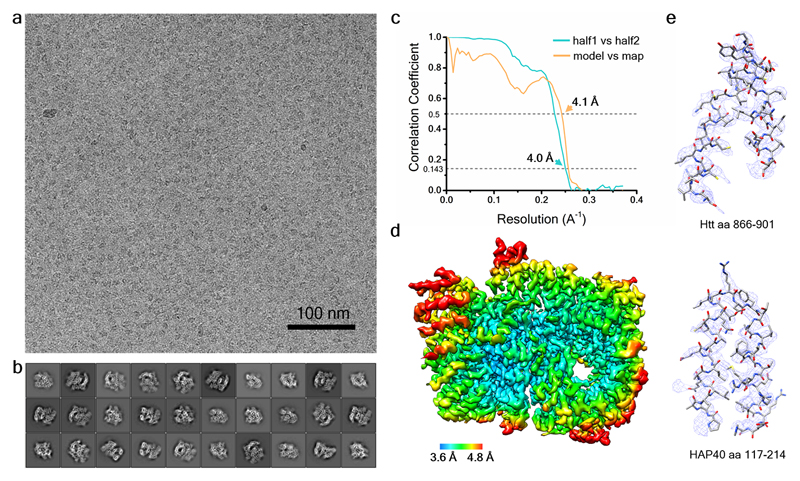
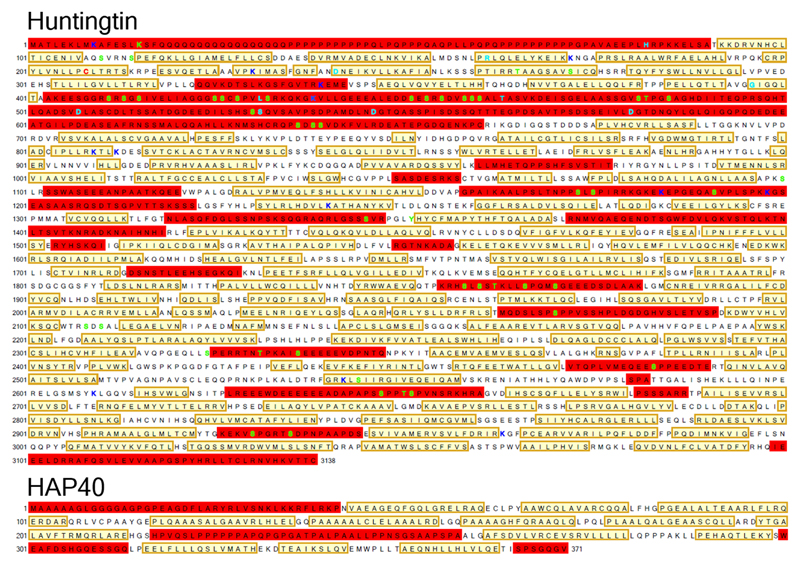
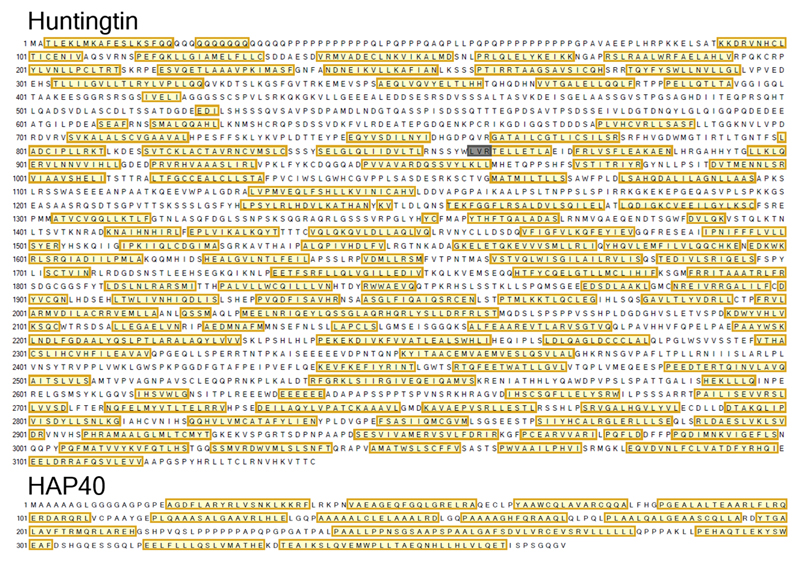
The conformational heterogeneity of Htt alone prevented high-resolution cryo-EM analysis. In contrast, the Htt-HAP40 complex was well defined and yielded a globular structure measuring ~120 x 80 x 100 Å (Fig. 2, Extended Data Fig. 2a, b), to some extent reminiscent of a recently published negative stain structure of Htt alone9. The global resolution of the map was 4 Å (Extended Data Fig. 2c, d), sufficient to build a de novo atomic model by energy minimization using well-resolved large side chains as landmarks (Fig. 2, Extended Data Fig. 2e, Extended Data Fig. 3, Extended Data Table 1). For both Htt and HAP40, all secondary structure elements resolved in the model corresponded to α-helices (Extended Data Fig. 4), in agreement with computational predictions using PSIPRED19 (Extended Data Fig. 5). For Htt, 72 % of the helices were arranged in HEAT or other tandem repeats. On the other hand, most of the regions not resolved in the map were predicted to be unstructured. Notably, no density was observed for the Htt exon 1 fragment (aa 1-90; 17QHtt is used for aa numbering throughout the text) even at very low thresholds, indicating that this region of the protein is extremely flexible. Thus, polyQ length may have limited influence on the overall architecture of the Htt-HAP40 complex.
Fig. 2. Architecture of the Htt-HAP40 complex.
The reconstructed density map filtered according to local resolution is shown as a translucent surface. The atomic model is superimposed in ribbon representation, with domains color-coded as follows: Htt N-HEAT domain, blue; Htt bridge domain, yellow; Htt C-HEAT domain, maroon; HAP40, purple. a, b, c, d show different views of the complex as indicated. e, Schematic domain organization of Htt and HAP40.
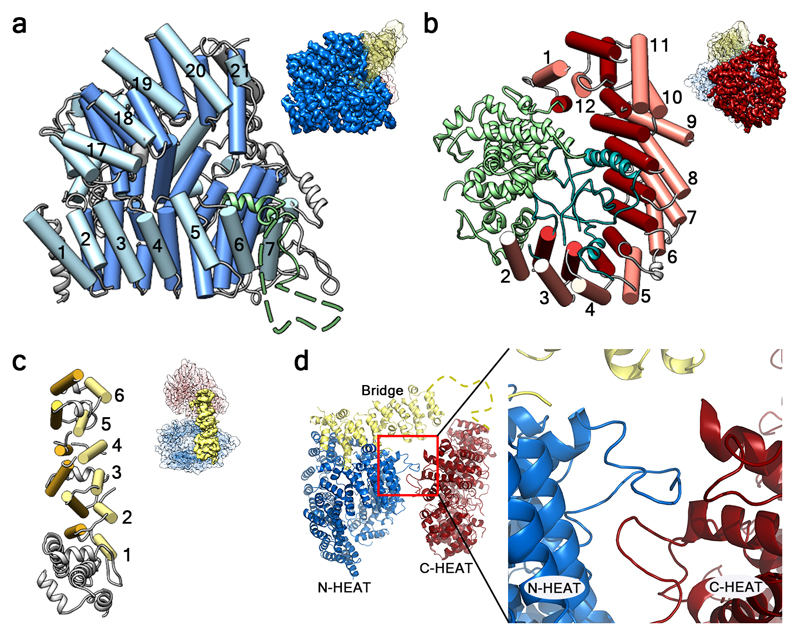
The domain organization of Htt has been controversial1,8–12. Our data show that Htt consists of three domains: N- and C-terminal domains containing multiple HEAT repeats (hereafter “N-HEAT” and “C-HEAT”) linked by a smaller bridge domain (Fig. 2). N-HEAT (aa 91-1684) forms a typical α-solenoid, comprising 21 HEAT repeats arranged as a one and a half turn right-handed superhelix, whose concave face defines an arch of ~80 Å in diameter (Fig. 3a). Two putative membrane-binding regions have been identified in Htt, both within N-HEAT: an exon 1 fragment, especially aa 1-17, which may form an amphipathic helix20, and a larger region at aa 168-366, which contains a functionally important palmitoylation site at C20821,22. While the N-terminus corresponding to exon 1 is not visible in our structure, N-HEAT repeats 2-4 (aa 160-275) form a positively charged region at the second putative membrane-binding region in the N-HEAT convex surface (Fig. 4a). However, a previously reported putative amphipathic helix (aa 223-240)22 faces the inner concave side of N-HEAT, with limited accessibility to membrane interactions.
Fig. 3. Structure of Htt domains.
a, N-HEAT domain. The insertion between N-HEAT repeat 6 and 7 is shown in green, with the unresolved sequence as a dashed line. b, C-HEAT domain, with the insertions between HEAT repeats shown in green (between C-HEAT repeats 1 and 2) and teal (between C-HEAT repeats 2 and 3). c, Bridge domain. In a-c helices forming part of tandem repeats are shown as rods in similar colors, and other helices as ribbons. At the top right of a-c, the part of Htt shown in each panel is highlighted in the Htt-HAP40 map using the color code of Fig. 2. d, Back view of Htt highlighting the interaction region (inset) between loops of N- and C-HEAT. The unresolved sequence at the C-terminus of the bridge domain is shown as a yellow dashed line.
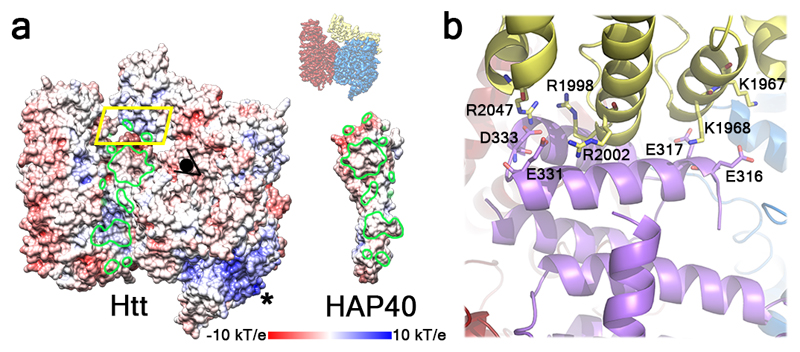
Fig. 4. Structural basis of the Htt-HAP40 interaction.
a, “Open book” view of the complex in surface representation displaying electrostatic potential. Htt-HAP40 contact areas are circled in green. * marks the positively charged surface formed by N-HEAT repeats 2-4. At the top right, the orientation of the Htt-HAP40 complex in this panel with respect to Fig. 2 is indicated. b, Detailed view of the region boxed in yellow using the color code of Fig. 2. Residues involved in electrostatic interactions are displayed as sticks.
Consistent with our computational predictions (Extended Data Fig. 5) and previous studies1,14, N-HEAT accommodates a large disordered insertion (aa 400-674) between N-HEAT repeats 6 and 7 (Fig. 3a). The insertion projects outwards without interrupting the interactions between HEAT repeats and making this region accessible to protease action. Indeed, multiple proteolytic cleavage sites have been mapped to this region1,14,23. However, the continuous packing of HEAT repeats 6 and 7 makes it unlikely that such cleavage events would result in an easy release of N-terminal fragments, in agreement with previous reports15,24. This insertion also harbors multiple phosphorylation sites that may modulate protein-protein interactions and proteolytic accessibility1,25–27, perhaps by regulating the interaction of this insertion with the positively charged region of N-HEAT. Most other reported posttranslational modifications of Htt are located in presumably unstructured regions not resolved in our map (Extended Data Fig. 4), including protease cleavage sites that release N-terminal Htt fragments1,23,28.
C-HEAT (aa 2092-3098) comprises 12 HEAT repeats forming an elliptical ring of ~80 x 30 Å (Fig. 3b). C-HEAT repeats 1 and 12 interact closing the ring. Contrary to canonical HEAT repeats, where the first helix is exposed to the convex surface of the domain, the first helix of C-HEAT repeat 12 faces the concave surface of C-HEAT. The repeats are interrupted by two insertions. Insertion 1 (aa 2121-2456) consists of 12 helical segments that separate C-HEAT repeats 1 and 2. On the other hand, insertion 2 (aa 2510-2663) is mostly unstructured and does not interfere with the interaction between C-HEAT repeats 2 and 3. Both insertions are harbored in the concave surface of C-HEAT, potentially shielding this region from protein-protein interactions. In contrast, both the convex and concave surfaces of N-HEAT are accessible in the structure (Fig. 3a) and could thus act as cargo binding sites. This may explain why most of the known binding sites of Htt interactors have been mapped to its N-terminus1,3,29.
N-HEAT and C-HEAT are stacked approximately vertically and connected by the bridge domain (aa 1685-2091, Fig. 3c). This domain contains 6 tandem α-helical repeats, of which repeats 3, 4 and 6 are Armadillo-like. The repeat region is flanked by 5 non-repeat helices and a flexible C-terminus (aa 2062-2092), which is unresolved. Besides this flexible linkage, N-HEAT and C-HEAT are only weakly connected via loop interactions (Fig. 3d), explaining the highly dynamic structure of Htt in the absence of interaction partners such as HAP40.
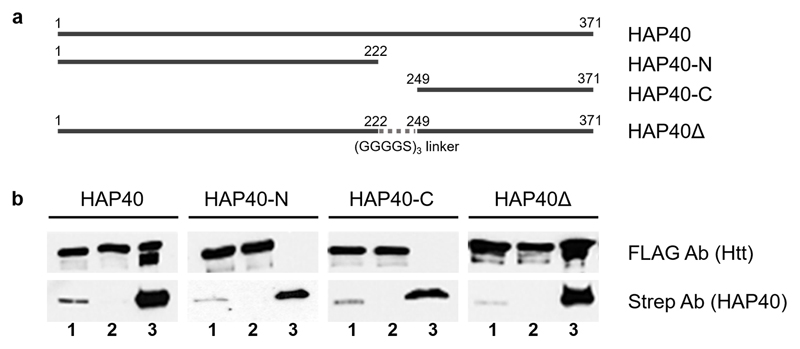
HAP40 binds within the cleft defined by the two HEAT domains and the bridge domain, thereby stabilizing the observed Htt conformation. HAP40 consists of 14 α-helices arranged in TPR-like tandem repeats (Fig. 2). Within the complex, Htt and HAP40 share large interfaces with mainly hydrophobic interactions (Fig. 4a), in agreement with our differential scanning fluorimetry data suggesting considerably reduced exposure of hydrophobic areas in the Htt-HAP40 complex (Fig. 1d). The C-terminus of HAP40 contains four negatively charged residues that interact with a positively charged patch on the bridge domain of Htt (Fig. 4b). In contrast, the N-terminus of HAP40 is mostly solvent exposed, and consequently helix 1 is not well resolved in our map. Similarly, a central region of HAP40 (aa 217-258) was not visible, consistent with biochemical experiments showing that this region was not required for Htt binding (Extended Data Fig. 6).
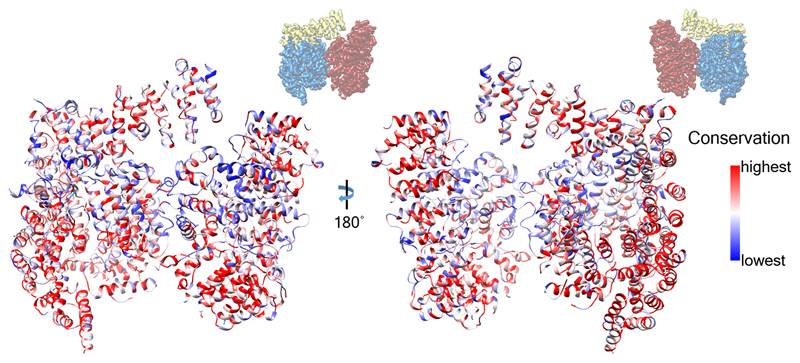
Although Htt is highly conserved from sea urchins to humans12 (Extended Data Fig. 7), the Htt ortholog in D. melanogaster bears only little resemblance to human Htt. Interestingly, no HAP40 homolog appears to be present in this organism, suggesting that these two proteins may have co-evolved. While many Htt interactors bind Htt’s N-terminus, HAP40 binding to Htt requires the coordination of all Htt domains (Fig. 2, Fig. 4). This explains why HAP40 has been identified as a Htt interactor by previous studies using full-length Htt as bait4,7, but not by others using only Htt fragments3. Also, it is possible that other proteins bind to Htt at a similar location. Altogether, our data resolves long-standing speculations on Htt's architecture, strongly supports the concept that Htt serves as a multivalent interaction hub1 and invites future structure-guided studies on the mechanisms by which Htt coordinates its diverse activities.
Methods
Antibodies
The following antibodies were used: anti-Flag M2 (Sigma), anti-HAP40 SC-69489 (Santa Cruz), anti-Strep (IBA) and anti-Htt MAB2166 (Millipore).
Identification of Htt-interacting proteins
2x10⁸ HEK293-based C2.6 cells17 expressing FLAG-tagged full-length polyQ-expanded 46QHtt at low levels were harvested and lysed within 25 mM Tris, 150 mM NaCl, 0.5 % Tween 20, 1x protease inhibitor (Roche), pH 7.4, followed by centrifugation (14.000 rpm, 1 h). The supernatant was incubated with FLAG beads at 4 °C for 2 h, followed by three times washing with 25 mM Tris, 150 mM NaCl, 0.02 % Tween 20, pH 7.4. Proteins bound to the FLAG beads were eluted with 100 mM Glycine, 150 mM NaCl, 0.02 % Tween, pH 3.5 and immediately neutralized with 1 M Tris (pH 8.0). The eluted proteins were concentrated and analysed by SDS-PAGE and Coomassie staining. To identify potential interactors of Htt the lanes were excised, proteins were in-gel digested using trypsin, and then analyzed by nano liquid chromatography (C18, 500 x 0.075 mm, 2 µm column, Thermo Fisher Scientific) and tandem mass spectrometry (QExactive, Thermo Fisher Scientific) in data-dependent acquisition mode (Top12). Proteins were identified using Proteome Discoverer 1.4 (Thermo Fisher Scientific) with a peptide FDR ≤ 0.01, and enrichment analysis was performed with Perseus 1.4.1.3 using MS1 peak area for quantification.
The identity of FLAG affinity-purified proteins was confirmed by Western blot analysis following SDS-PAGE with anti-Htt and anti-HAP antibodies.
Generation of a stable human cell lines co-expressing 17QHtt and HAP40
B1.21 cells17 are based on HEK293 cells and express full-length wild type 17QHtt upon induction with doxycycline (Dox). An expression plasmid pBSK/2-CMV-HAP40-TS was constructed to express the human HAP40 (F8A) protein (NCBI Ref Seq NP_036283.2) with a C-terminal Twin-Strep-tag under the control of the hCMV promoter. B1.21 cells were co-transfected with this plasmid together with a puromycin resistance gene. The resulting stable cell line (B1.21-HAP40TS) expressing HAP40 at high constitutive levels and Htt upon induction with Dox, was used for the purification of Htt-HAP40 complex. Generated cell lines have been tested negative for mycoplasma by PCR. Cell lines have been authenticated by inducibility of Htt expression with doxycycline and Western blot analysis.
Purification of Htt, HAP40 and the Htt-HAP40 complex
The purification of Htt alone has been described17. For purification of the Htt-HAP40 complex, 2x10⁸ B1.21-HAP40TS cells were harvested 72 h after induction with Dox by centrifugation at 400 g for 10 min. Cells were lysed with 25 mM HEPES, 300 mM NaCl, 0.5 % Tween 20, protease inhibitor, pH 8.0 by rotation at 4 °C for 30 min followed by centrifugation of the cell lysate at 30,000 g and clearance by filtration through a 0.2 μm filter. The filtrate was incubated with Strep-Tactin beads (Qiagen) for 2-3 h at 4 °C. After washing three times with 25 mM HEPES, 300 mM NaCl, 0.02 % Tween 20, pH 8.0 bound proteins were eluted with 25 mM HEPES, 300 mM NaCl, 0.02 % Tween 20, 2.5 mM Desthiobiotin, pH 8.0. The eluate was concentrated using Amicon filters.
The Htt-HAP40 complex was further purified by size exclusion chromatography using a Superose 6 10/300 increase column (GE Healthcare) in running buffer 25 mM HEPES, 300 mM NaCl, 0.1 % CHAPS and 1 mM DTT, pH 8.0. Htt-HAP40 eluted in one narrow-based peak and was concentrated with Amicon ultra 100 kDa filters (Millipore).
HAP40 was purified from the Htt-HAP40 complex as follows. Htt-HAP40 bound to Strep beads was eluted with 25 mM HEPES, 300 mM NaCl, 0.05 % N-Dodecyl beta-D-maltoside (DDM) and 2.5 mM Desthiobiotin, pH 8.0. The eluate was concentrated using Amicon filters. To disrupt the Htt-HAP40 complex, DDM was added to a final concentration of 0.25 %. After overnight incubation at 4 °C, the Strep eluate was further purified by size exclusion chromatography using a Superose 6 10/300 increase column in running buffer 25 mM, 300 mM NaCl, 0.1 % CHAPS and 1 mM DTT, pH 8.0 to separate Htt and HAP40. HAP40 eluted in one narrow-based peak and was concentrated with Amicon ultra 30 kDa filters.
Rate-zonal ultracentrifugation
5-20 % sucrose gradients in 25 mM HEPES, 300 mM NaCl, 0.1 % CHAPS, pH 8.0 were generated by an automatic gradient maker (Gradient master, Biocomp instrument). A volume of 120 μl of FLAG-tag-purified Htt or Strep-tag-purified Htt-HAP40 complex was laid on top of the gradient and centrifuged at 39,000 rpm for 16 h using a SW41 rotor in a Beckman ultracentrifuge. Fractions of the sucrose gradient were collected from the bottom of the tubes in fractions of 0.5 ml to be analyzed by SDS-PAGE and Coomassie Blue staining and Western blotting.
Differential scanning fluorimetry
Protein thermostability was assessed by differential scanning fluorimetry30. Protein unfolding was monitored by the increase in the fluorescence of SYPRO Orange (Invitrogen). Prior to use, a 100 mM stock of the dye (stored at -20°C) was diluted 1:20 in DMSO and directly added to the sample to a final concentration of 125 µM. The tested proteins were diluted in sample buffer (25 mM HEPES, 300 mM NaCl, 0.1 % CHAPS, 1 mM DTT and 10 % glycerol) to concentrations of 1.6 µM (Htt, Htt-HAP40 complex) and 2 µM (HAP40). The samples were heated up with a ramp rate of 1 °C/min over a temperature range of 15-95 °C using the qPCR System MX 3005 P (Stratagene). Measurements were performed in duplicate.
Transient expression of HAP40 and HAP40 fragments and interaction studies with Htt
Plasmids were generated expressing, under hCMV promoter control, either full-length HAP40, a N-terminal HAP40 fragment (HAP40-N, encoding aa 1-222), a C-terminal HAP40 fragment (HAP40-C, encoding aa 249-371) or a HAP40 fragment, in which the central proline-rich region had been replaced by a flexible linker (HAP40∆, encoding aa 1-222 linked by a (GGGGS)3 linker to aa 249-371). All HAP40 variants carried a C-terminal Twin-Strep-tag.
B1.21 cells induced with Dox to express 17QHtt were transiently transfected with the plasmids using PEI transfection. At 48 hours after transfection, the cells were harvested by centrifugation and lysed in 25 mM HEPES, 300 mM NaCl, 0.5 % Tween 20, 1x protease inhibitor, pH 8.0, followed by centrifugation (14.000 rpm, 1 h). The supernatant was incubated with Magstrep beads (IBA) at 4 °C for 2 hours, followed by three times washing with 25 mM HEPES, 300 mM NaCl, 0.02 % Tween 20, pH 8.0. Thereafter, bound proteins were eluted using Desthiobiotin in SDS loading buffer, followed by SDS-PAGE and Western blot analysis using anti-FLAG and anti-Strep antibodies for detection.
Cryo-EM sample preparation and data acquisition
Purified Htt-HAP40 complex was diluted to 0.5 mg/ml with 25mM HEPES, 300 mM NaCl, 0.025 % CHAPS, 1 mM DTT. 4 μl of sample was applied to a Quantifoil gold grid suspended with monolayer graphene (Graphenea) and vitrified by plunge-freezing into a liquid ethane/propane mixture using Vitrobot Mark IV (FEI) with blotting time of 5 s. Data collection was performed on a Titan Krios microscope (FEI) operated at 300 kV and equipped with a field emission gun, a Gatan GIF Quantum energy filter and a Gatan K2 Summit direct electron camera. The calibrated magnification was 105,000 in EFTEM mode, corresponding to a pixel size of 1.35 Å. Images were collected at a dose rate of 4 electrons/Å2/s, each exposure (8 s exposures time) comprising 16 sub-frames amounting to a total dose of 32 electrons/Å2/s. Data was recorded using SerialEM31 software and custom macros with defocus values ranging from -1.4 to -3 μm.
Image processing
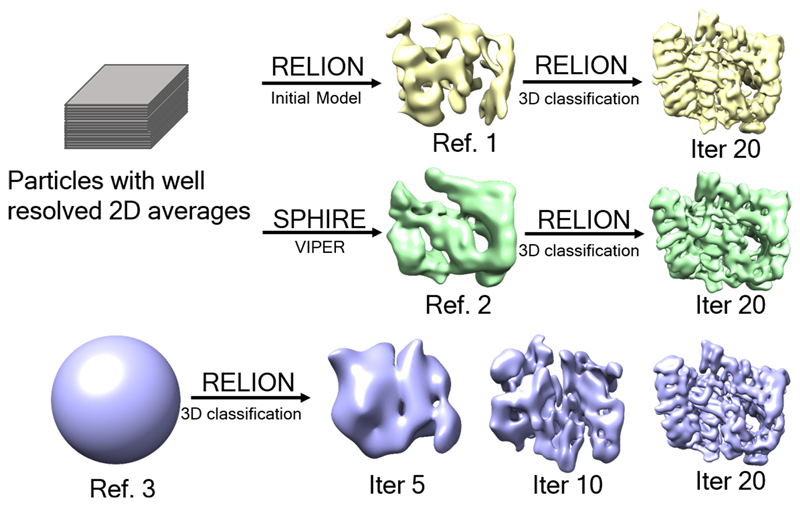
Micrograph movie frame stacks were subjected to beam-induced motion correction by MotionCor232. Most further processing was performed using RELION33. The contrast transfer function parameters for each micrograph were determined with CTFFIND434, and all micrographs with a resolution limit worse than 4 Å were discarded. Particles were initially picked with Gautomatch (http://www.mrc-lmb.cam.ac.uk/kzhang/Gautomatch/Gautomatch_Brief_Manual.pdf) using a sphere as template, and extracted with a 160-pixel by 160-pixel box. Reference-free 2D class averaging was performed reiteratively, keeping only particles with well-resolved 2D average for initial model generation. To validate the ab initio model, 3D classification was performed using initial models generated by RELION, VIPER35 or a simple sphere as reference. Identical 3D maps with detailed features were generated regardless of the reference used (Extended Data Fig. 8). 2D projections of this model were subsequently used as a reference to re-pick the particles. The resulting particles were subjected to reiterative reference-free 2D class averaging. Strict selection of classes showing distinct structural features resulted in a particle subset used for further three-dimensional classification. The classes with identical detailed features were merged for further auto-refinement, applying a soft mask with 6 pixel fall-off around the entire molecule, to produce the final density map with an overall resolution of 4 Å (Extended Data 2c). The resolution was estimated based on the gold-standard Fourier shell correlation (FSC) method using the 0.143 criterion36. The chirality of the final map was validated by model building of side chains within α helixes. All density maps were sharpened by applying temperature factor that was estimated using post-processing in RELION. For visualization, the density maps were filtered based on the local resolution determined using half-reconstructions as input maps. Chimera37 and PyMOL38 were used for graphic visualization.
Model building
Ab initio modeling of the entire Htt-HAP40 complex was performed in COOT39, using secondary structure predictions calculated by PSIPRED19 and the densities of bulky side chains to determine registers of the residues. Regions (1-90, 323-342, 403-660, 960-977, 1049-1057, 1103-1120, 1158-1222, 1319-1347, 1372-1418, 1504-1510, 1549-1556, 1714-1728, 1855-1881, 2063-2091, 2325-2347, 2472-2490, 2580-2582, 2627-2660, 2681-2687, 2926-2944 and 3099-3138) of Htt and regions (1-41, 217-257, 300-313 and 365-371) of HAP40 were not built in the final model, as no well-resolved densities were present in the map. Map refinement was carried out using Phenix.real_space_refine40 against the overall map at resolution 4 Å, with secondary structure and Ramachandran restrains. The final model was validated using MolProbity41 (Extended Data Table 1).
Data availability
The data supporting the findings of this study are available within this paper, including source data for figures. The cryo-EM map of the 17QHtt-HAP40 complex has been deposited at the Electron Microscopy Data Bank under accession code EMD-3984. The modeled structure of the 17QHtt-HAP40 complex has been deposited at the Protein Data Bank under accession code 6EZ8.
Extended Data
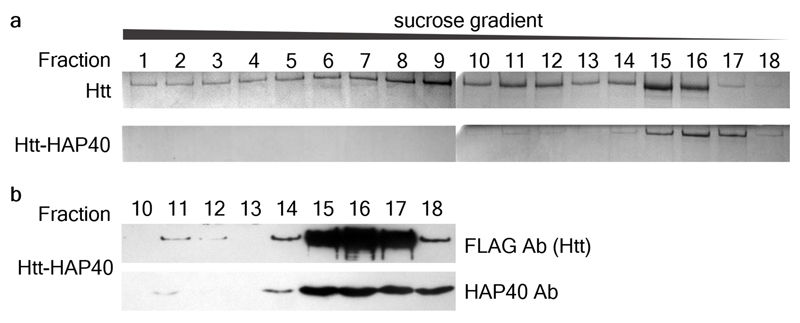
Extended Data Fig. 1. Sedimentation analysis by rate-zonal ultracentrifugation.
a, FLAG-tag purified Htt (top) and Strep-tag purified Htt-HAP40 complex (bottom) analysed by rate-zonal ultracentrifugation followed by SDS-PAGE and Coomassie staining. 25 fractions from 5-20 % sucrose gradients were collected from the bottom of the tube, here showing fractions 1-18. While Htt alone was present in fractions 1-18, the Htt-HAP40 complex was found mainly in fractions 15-17, indicating lower conformational heterogeneity. b, Western blot analysis of fractions 10-18 of the Htt-HAP40 complex. Independent experiments with similar results (n): n=3. For gel source data, see Supplementary Figure 1.
Extended Data Fig. 2. Cryo-EM analysis of the Htt-HAP40 complex.
a, Representative micrograph of Htt-HAP40 complex. b, 2D class averages. c, Fourier shell correlation (FSC) plots. Cyan, gold-standard FSC curve; orange, FSC curve calculated between the cryo-EM map and refined atomic model. 0.143 and 0.5 FCS cut-off values, respectively, were used as indicated. The (initial/final) numbers of micrographs and particles were 707/635 and 418,627/98,310, respectively. d, Final density map of the Htt-HAP40 complex colored according to local resolution. The map was low-pass filtered to 4.0 Å and sharpened with a B-factor of -174 Å2. e, Detail of the electron density maps (mesh) for parts of Htt and HAP40.
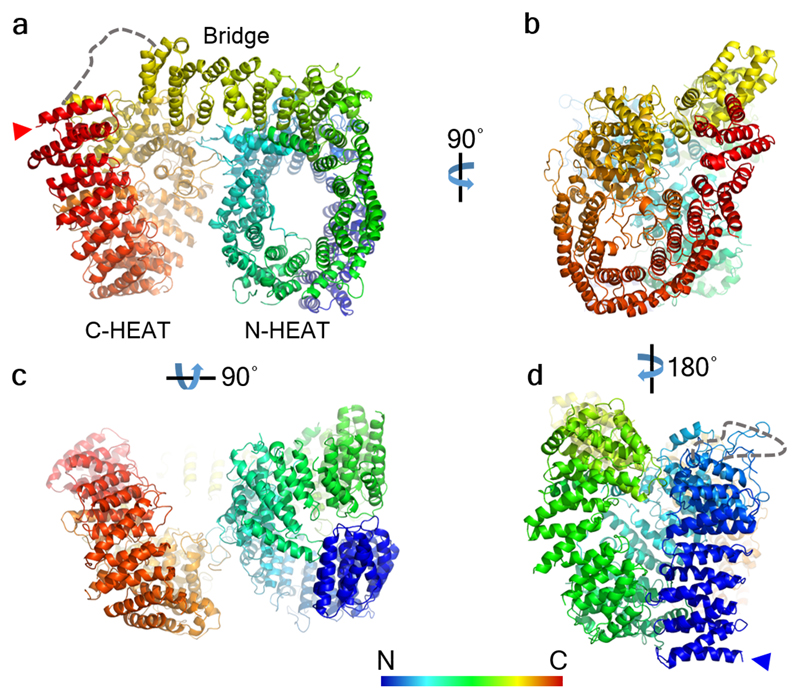
Extended Data Fig. 3. Atomic model of Htt within the Htt-HAP40 complex.
The atomic model is shown in ribbon representation with the indicated rainbow color code from N-terminus (blue arrowhead in d) to C- terminus (red arrowhead in a). a, b, c, d show different views of the complex as indicated. Dashed lines mark unresolved regions.
Extended Data Fig. 4. Amino acid sequences of 17QHtt and HAP40.
Structural elements of the atomic models are indicated as follows: not visible in the model (red box), unstructured region (no box) and α-helix (yellow box). The sites of previously reported proteases cleavage and post-translational modifications of Htt1,21,23,27 are indicated as follows: acetylation (dark blue), palmitoylation (red), phosphorylation (green) and proteolytic cleavage (cyan).
Extended Data Fig. 5. PSIPRED secondary structure predictions for Htt and HAP40.
Structural elements are indicated as follows: unstructured region (no box), α-helix (yellow box) and β-sheet (grey box).
Extended Data Fig. 6. Truncation analysis of HAP40 binding to Htt.
a, Schematic representation of the HAP40 constructs studied (all C-terminally Strep-tagged). b, HAP40 constructs were co-expressed with C-terminally FLAG-tagged 17QHtt, immunoprecipitated using Strep-Tactin beads and analyzed by Western blot. Lanes are indicated as follows: 1, cell lysates; 2, cell lysates upon incubation with Strep beads; 3, Strep beads eluates. Note that full-length HAP40 and a construct lacking the central domain immunoprecipitate Htt, but not deletions of the N- and C-terminal regions of HAP40. Independent experiments with similar results (n): n=2. For gel source data, see Supplementary Figure 1.
Extended Data Fig. 7. Evolutionary analysis of Htt.
The human Htt model is shown in ribbon representation, colored according to sequence conservation across 16 metazoan species (Homo sapiens, Rattus norvegicus, Mus musculus, Sus scrofa, Bos Taurus, Canis familiaris, Monodelphis domestica, Gallus gallus, Danio rerio, Tetraodon nigroviridis, Fugu rubripes, Ciona savignyi, Ciona intestinalis, Strongylocentrotus purpuratus, Tribolium castaneum, Apis mellifera), using a previously reported sequence alignment12. At the top, the orientation of the Htt-HAP40 complex is indicated with respect to Fig. 2.
Extended Data Fig. 8. Workflow for initial model validation for 3D reconstruction of the Htt-HAP40 complex.
A subset of particles with well-resolved 2D average were used for initial model generation using RELION33 or SPHIRE35. The resulting models were used as reference for 3D classification of all the good particles. A featureless sphere was also used as classification reference. Most of the particles were classified to identical structures with sufficient detail, indicating no reference bias in the reconstruction.
Extended Data Table 1. Cryo-EM data collection, refinement and validation statistics.
| Huntingtin-HAP40 (EMDB-3984) (PDB 6EZ8) |
|
|---|---|
| Data collection and processing | |
| Magnification | 105k |
| Voltage (kV) | 300 |
| Electron exposure (e−/Å2) | 32 |
| Defocus range (μm) | 1.4-3.0 |
| Pixel size (Å) | 1.35 |
| Symmetry imposed | C1 |
| Initial particle images (no.) | 418,627 |
| Final particle images (no.) | 98,310 |
| Map resolution (Å) | 4.0 |
| FSC threshold | 0.143 |
| Map resolution range (Å) | 3.6-4.8 |
| Refinement | |
| Initial model used (PDB code) | N/A |
| Model resolution (Å) | 4.1 |
| FSC threshold | 0.5 |
| Model resolution range (Å) | 4.1 |
| Map sharpening B factor (Å2) | -174 |
| Model composition | |
| Non-hydrogen atoms | 20,491 |
| Protein residues | 2.621 |
| B factors (Å2) | |
| Protein | 24.57 |
| R.m.s. deviations | |
| Bond lengths (Å) | 0.007 |
| Bond angles (°) | 1.42 |
| Validation | |
| MolProbity score | 1.68 |
| Clashscore | 4.87 |
| Poor rotamers (%) | 0.83 |
| Ramachandran plot | |
| Favored (%) | 93.59 |
| Allowed (%) | 6.14 |
| Disallowed (%) | 0.27 |
Supplementary Material
Acknowledgements
We thank Jürgen Plitzko for electron microscopy support, Florian Beck for help with image processing, Elena Conti, Hans Kiefer, Bernhard Landwehrmeyer, Katrin Lindenberg, Peer Mittl and Leticia Toledo-Sherman for helpful discussions and Andreas Bracher, Mark Hipp and Eri Sakata for the critical reading of the manuscript. This work has been funded by the CHDI Foundation, the German Federal Ministry of Education and Research (FTLDc 01GI1007A), the German Research Foundation (SFB1279) and the European Commission (grant FP7 GA ERC-2012-SyG_318987–ToPAG). Q.G. is the recipient of postdoctoral fellowships from EMBO (EMBO ALTF 73-2015) and the Alexander von Humboldt Foundation.
Footnotes
Author Contributions
Q.G., B.H., P.O., A.P., W.B., R.F.-B. and S.K. designed experiments. F.M., M.M. and A.P. performed DSF studies. P.O. performed mass spectrometry analyses. B.H. prepared the Htt-HAP40 samples for cryo-EM and performed the majority of the biochemical work together with T.E. M.S. performed the experiments with truncated HAP40 constructs. Q.G. performed the majority of the Cryo-EM work. Q.G. and G.P. optimized sample conditions for cryo-EM. J.C. built the atomic model. Q.G., J.C. and R.F.-B. analyzed the structure. Q.G., B.H., J.C., M.S., P.O., M.O., A.P., R.F.-B. and S.K. analyzed data. Q.G. and B.H. prepared figures. Q.G., B.H., W.B., R.F.-B. and S.K. wrote the manuscript. All authors commented on the manuscript.
The authors declare no competing financial interests.
Author Information
Requests for materials should be addressed to S.K. (stefan.kochanek@uni-ulm.de).
References
- 1.Saudou F, Humbert S. The Biology of Huntingtin. Neuron. 2016;89:910–926. doi: 10.1016/j.neuron.2016.02.003. [DOI] [PubMed] [Google Scholar]
- 2.Zuccato C, Cattaneo E. Huntington’s Disease. Oxford University Press; 2014. [Google Scholar]
- 3.Kaltenbach LS, et al. Huntingtin interacting proteins are genetic modifiers of neurodegeneration. PLoS genetics. 2007;3:e82. doi: 10.1371/journal.pgen.0030082. [DOI] [PMC free article] [PubMed] [Google Scholar]
- 4.Shirasaki DI, et al. Network organization of the huntingtin proteomic interactome in mammalian brain. Neuron. 2012;75:41–57. doi: 10.1016/j.neuron.2012.05.024. [DOI] [PMC free article] [PubMed] [Google Scholar]
- 5.MacDonald ME, et al. A novel gene containing a trinucleotide repeat that is expanded and unstable on Huntington's disease chromosomes. Cell. 1993;72:971–983. doi: 10.1016/0092-8674(93)90585-e. [DOI] [PubMed] [Google Scholar]
- 6.Finkbeiner S. Huntington's Disease. Cold Spring Harbor perspectives in biology. 2011;3 doi: 10.1101/cshperspect.a007476. [DOI] [PMC free article] [PubMed] [Google Scholar]
- 7.Peters MF, Ross CA. Isolation of a 40-kDa Huntingtin-associated protein. The Journal of biological chemistry. 2001;276:3188–3194. doi: 10.1074/jbc.M008099200. [DOI] [PubMed] [Google Scholar]
- 8.Palidwor GA, et al. Detection of alpha-rod protein repeats using a neural network and application to huntingtin. PLoS computational biology. 2009;5:e1000304. doi: 10.1371/journal.pcbi.1000304. [DOI] [PMC free article] [PubMed] [Google Scholar]
- 9.Vijayvargia R, et al. Huntingtin's spherical solenoid structure enables polyglutamine tract-dependent modulation of its structure and function. eLife. 2016;5:e11184. doi: 10.7554/eLife.11184. [DOI] [PMC free article] [PubMed] [Google Scholar]
- 10.Andrade MA, Bork P. HEAT repeats in the Huntington's disease protein. Nature genetics. 1995;11:115–116. doi: 10.1038/ng1095-115. [DOI] [PubMed] [Google Scholar]
- 11.Takano H, Gusella JF. The predominantly HEAT-like motif structure of huntingtin and its association and coincident nuclear entry with dorsal, an NF-kB/Rel/dorsal family transcription factor. BMC neuroscience. 2002;3:15. doi: 10.1186/1471-2202-3-15. [DOI] [PMC free article] [PubMed] [Google Scholar]
- 12.Tartari M, et al. Phylogenetic comparison of huntingtin homologues reveals the appearance of a primitive polyQ in sea urchin. Molecular biology and evolution. 2008;25:330–338. doi: 10.1093/molbev/msm258. [DOI] [PubMed] [Google Scholar]
- 13.Seong IS, et al. Huntingtin facilitates polycomb repressive complex 2. Human molecular genetics. 2010;19:573–583. doi: 10.1093/hmg/ddp524. [DOI] [PMC free article] [PubMed] [Google Scholar]
- 14.Wetzel R, Mishra R. Huntington’s Disease. Oxford University Press; 2014. [Google Scholar]
- 15.Li W, Serpell LC, Carter WJ, Rubinsztein DC, Huntington JA. Expression and characterization of full-length human huntingtin, an elongated HEAT repeat protein. The Journal of biological chemistry. 2006;281:15916–15922. doi: 10.1074/jbc.M511007200. [DOI] [PubMed] [Google Scholar]
- 16.Pal A, Severin F, Lommer B, Shevchenko A, Zerial M. Huntingtin-HAP40 complex is a novel Rab5 effector that regulates early endosome motility and is up-regulated in Huntington's disease. The Journal of cell biology. 2006;172:605–618. doi: 10.1083/jcb.200509091. [DOI] [PMC free article] [PubMed] [Google Scholar]
- 17.Huang B, et al. Scalable production in human cells and biochemical characterization of full-length normal and mutant huntingtin. PloS one. 2015;10:e0121055. doi: 10.1371/journal.pone.0121055. [DOI] [PMC free article] [PubMed] [Google Scholar]
- 18.Chari A, et al. ProteoPlex: stability optimization of macromolecular complexes by sparse-matrix screening of chemical space. Nature methods. 2015;12:859–865. doi: 10.1038/nmeth.3493. [DOI] [PMC free article] [PubMed] [Google Scholar]
- 19.Buchan DW, Minneci F, Nugent TC, Bryson K, Jones DT. Scalable web services for the PSIPRED Protein Analysis Workbench. Nucleic acids research. 2013;41:W349–357. doi: 10.1093/nar/gkt381. [DOI] [PMC free article] [PubMed] [Google Scholar]
- 20.Arndt JR, Chaibva M, Legleiter J. The emerging role of the first 17 amino acids of huntingtin in Huntington's disease. Biomolecular concepts. 2015;6:33–46. doi: 10.1515/bmc-2015-0001. [DOI] [PMC free article] [PubMed] [Google Scholar]
- 21.Yanai A, et al. Palmitoylation of huntingtin by HIP14 is essential for its trafficking and function. Nature neuroscience. 2006;9:824–831. doi: 10.1038/nn1702. [DOI] [PMC free article] [PubMed] [Google Scholar]
- 22.Kegel KB, et al. Huntingtin associates with acidic phospholipids at the plasma membrane. The Journal of biological chemistry. 2005;280:36464–36473. doi: 10.1074/jbc.M503672200. [DOI] [PubMed] [Google Scholar]
- 23.Wellington CL, et al. Caspase cleavage of gene products associated with triplet expansion disorders generates truncated fragments containing the polyglutamine tract. The Journal of biological chemistry. 1998;273:9158–9167. doi: 10.1074/jbc.273.15.9158. [DOI] [PubMed] [Google Scholar]
- 24.El-Daher MT, et al. Huntingtin proteolysis releases non-polyQ fragments that cause toxicity through dynamin 1 dysregulation. The EMBO journal. 2015;34:2255–2271. doi: 10.15252/embj.201490808. [DOI] [PMC free article] [PubMed] [Google Scholar]
- 25.Luo S, Vacher C, Davies JE, Rubinsztein DC. Cdk5 phosphorylation of huntingtin reduces its cleavage by caspases: implications for mutant huntingtin toxicity. The Journal of cell biology. 2005;169:647–656. doi: 10.1083/jcb.200412071. [DOI] [PMC free article] [PubMed] [Google Scholar]
- 26.Schilling B, et al. Huntingtin phosphorylation sites mapped by mass spectrometry. Modulation of cleavage and toxicity. The Journal of biological chemistry. 2006;281:23686–23697. doi: 10.1074/jbc.M513507200. [DOI] [PubMed] [Google Scholar]
- 27.Ratovitski T, et al. Post-Translational Modifications (PTMs), Identified on Endogenous Huntingtin, Cluster within Proteolytic Domains between HEAT Repeats. Journal of proteome research. 2017;16:2692–2708. doi: 10.1021/acs.jproteome.6b00991. [DOI] [PMC free article] [PubMed] [Google Scholar]
- 28.Ratovitski T, et al. Mutant huntingtin N-terminal fragments of specific size mediate aggregation and toxicity in neuronal cells. The Journal of biological chemistry. 2009;284:10855–10867. doi: 10.1074/jbc.M804813200. [DOI] [PMC free article] [PubMed] [Google Scholar]
- 29.Gusella JF, MacDonald ME. Huntingtin: a single bait hooks many species. Current opinion in neurobiology. 1998;8:425–430. doi: 10.1016/s0959-4388(98)80071-8. [DOI] [PubMed] [Google Scholar]
- 30.Vedadi M, et al. Chemical screening methods to identify ligands that promote protein stability, protein crystallization, and structure determination. Proceedings of the National Academy of Sciences of the United States of America. 2006;103:15835–15840. doi: 10.1073/pnas.0605224103. [DOI] [PMC free article] [PubMed] [Google Scholar]
- 31.Mastronarde DN. Automated electron microscope tomography using robust prediction of specimen movements. Journal of structural biology. 2005;152:36–51. doi: 10.1016/j.jsb.2005.07.007. [DOI] [PubMed] [Google Scholar]
- 32.Zheng SQ, et al. MotionCor2: anisotropic correction of beam-induced motion for improved cryo-electron microscopy. Nature methods. 2017;14:331–332. doi: 10.1038/nmeth.4193. [DOI] [PMC free article] [PubMed] [Google Scholar]
- 33.Scheres SH. RELION: implementation of a Bayesian approach to cryo-EM structure determination. Journal of structural biology. 2012;180:519–530. doi: 10.1016/j.jsb.2012.09.006. [DOI] [PMC free article] [PubMed] [Google Scholar]
- 34.Rohou A, Grigorieff N. CTFFIND4: Fast and accurate defocus estimation from electron micrographs. Journal of structural biology. 2015;192:216–221. doi: 10.1016/j.jsb.2015.08.008. [DOI] [PMC free article] [PubMed] [Google Scholar]
- 35.Moriya T, et al. High-resolution Single Particle Analysis from Electron Cryo-microscopy Images Using SPHIRE. Journal of visualized experiments : JoVE. 2017 doi: 10.3791/55448. [DOI] [PMC free article] [PubMed] [Google Scholar]
- 36.Scheres SH, Chen S. Prevention of overfitting in cryo-EM structure determination. Nature methods. 2012;9:853–854. doi: 10.1038/nmeth.2115. [DOI] [PMC free article] [PubMed] [Google Scholar]
- 37.Pettersen EF, et al. UCSF Chimera--a visualization system for exploratory research and analysis. Journal of computational chemistry. 2004;25:1605–1612. doi: 10.1002/jcc.20084. [DOI] [PubMed] [Google Scholar]
- 38.Schrodinger LLC. The PyMOL Molecular Graphics System, Version 1.8. 2015 [Google Scholar]
- 39.Emsley P, Cowtan K. Coot: model-building tools for molecular graphics. Acta Crystallogr D Biol Crystallogr. 2004;60:2126–2132. doi: 10.1107/S0907444904019158. [DOI] [PubMed] [Google Scholar]
- 40.Adams PD, et al. PHENIX: a comprehensive Python-based system for macromolecular structure solution. Acta Crystallogr D Biol Crystallogr. 2010;66:213–221. doi: 10.1107/S0907444909052925. [DOI] [PMC free article] [PubMed] [Google Scholar]
- 41.Chen VB, et al. MolProbity: all-atom structure validation for macromolecular crystallography. Acta Crystallogr D Biol Crystallogr. 2010;66:12–21. doi: 10.1107/S0907444909042073. [DOI] [PMC free article] [PubMed] [Google Scholar]
Associated Data
This section collects any data citations, data availability statements, or supplementary materials included in this article.
Supplementary Materials
Data Availability Statement
The data supporting the findings of this study are available within this paper, including source data for figures. The cryo-EM map of the 17QHtt-HAP40 complex has been deposited at the Electron Microscopy Data Bank under accession code EMD-3984. The modeled structure of the 17QHtt-HAP40 complex has been deposited at the Protein Data Bank under accession code 6EZ8.


