Abstract
Untreated rotator cuff tears can progress to a distinct form of shoulder arthritis, and the mechanism of this progression is poorly understood. Biomechanical, molecular and genetic factors may be at play, and a reliable animal model is needed to enable further research. The purpose of this study was to create a reproducible model of posttraumatic shoulder arthritis in the mouse, and to develop a scoring system for this model to enable future research on interventions, the role of various gene products, and the development of therapies to alter the natural course of the disease. Forty-five mice underwent operative ligation of the rotator cuff tendons and were followed for 45 weeks following surgery, with free cage activity post-operatively. Mice were sacrificed at various intervals from 2–45 weeks post-injury and histopathologic scoring was developed and tested by blinded reviewers using both quantitative computational analysis of coronal sections of the shoulder joint and semi-quantitative grading. The scoring system revealed a progressive, time-dependent set of tissue changes in the shoulder joint with features similar to human cuff tear arthropathy including acetabularization of the acromion and femoralization of the humeral head. This model establishes that osteoarthritis of the shoulder is distinct from osteoarthritis of the knee or hip, with different stages of degeneration and unique histopathologic features. Using the novel grading procedure and quantitative assessments presented here, future research using this model will enable investigators to test established and novel therapies and evaluate the role of inflammatory factors and gene products in shoulder arthritis.
Keywords: rotator cuff, injury, posttraumatic osteoarthritis, shoulder
INTRODUCTION
Approximately 17 million people in the United States are at risk of disability secondary to Rotator Cuff Tears (RCTs).1 Untreated tears fare predictably worse with indirect individual lifetime costs of untreated RC disease (unemployment, underemployment and disability payments) estimated at nearly $80,000 for young patients whose tears are left to degenerate without surgery.2 This arthritis is distinct from shoulder arthritis in persons with intact rotator cuffs based on key features including decreased acromiohumeral distance (AHD), superior migration of the humeral head, and acromial acetabularization and humeral femoralization as the undersurface of the acromion begins to articulate with the superiorly displaced humeral head.3 Clinically, patients present with shoulder pain and weakness with overhead activity, but can also present with pseudoparalysis of the shoulder, joint effusions, and instability with attempted shoulder elevation.4 Diagnosis can be confirmed with x-ray imaging which demonstrates not only the classic features of osteoarthritis such as erosion and loss of eccentricity of the joint surface but also the distinct features described above including superior migration of the humeral head, decreased AH distance, and acetabularization of the acromion with humeral femoralization.
Cuff Tear Arthropathy (CTA) develops in about 4% of patients with a massive tear of the RC.5 It remains unclear why some progress to CTA while the majority do not. Risk factors for CTA include advanced age, smoking, hypercholesterolemia, family history, RCT, and history of trauma to the shoulder.6; 7 Without understanding the pathogenesis of CTA in this 4%, it is not possible to predict who will progress to CTA or to develop therapeutic strategies to mitigate this process. Once CTA develops, the only option in management is joint replacement.8 The development of an applicable murine model for CTA is necessary to elucidate the pathogenesis and pathophysiology of this disorder at its most fundamental level, so that disease-modifying therapeutics may then be developed.
Investigators have attempted to establish a similar model in the rat and mouse. Perry et al. established changes in stride and paw parameters, walking speed, collagen organization, and glenoid cartilage thickness following rotator cuff tendon detachment in the rat.9; 10 Tenocyte therapy has been tested to treat rotator cuff tears (RCT) in a rabbit without attention to articular surface changes or long-term pathophysiology following RCT or development of CTA.11 Mouse models of RCT have described muscle atrophy and fatty infiltration of the tendons but did not continue to the development of CTA.12; 13 These authors attempted to use the Mankin scoring system, which showed increased scores with RC tenotomy and suprascapular nerve transection, however they did not track whether or not the Mankin score increased predictably over time. None of these studies describes progression from rotator cuff transection to the development of CTA.
Overall, we hypothesized that an isolated injury to the RC would lead to progressive, reliable, degeneration of the glenohumeral joint, and that this process could be confirmed and described histologically as well as radiographically. To address this hypothesis, we surgically-induced a unilateral massive RCT in adult mice for comparison with the uninjured contralateral shoulder. Using this surgical injury approach, we were able to successfully create a consistent and reproducible degenerative process similar to that seen in humans. Additionally, we present here a novel Humeral Head Degeneration Scoring system that allows for the grading of joint degeneration over time that is consistent with imaging (micro-computed tomography: microCT) and histomorphometry studies that were conducted in parallel
MATERIALS AND METHODS
Level of Evidence: II
Work with animals in this study was reviewed, approved and supervised by the University of Rochester committee on animal resources Institutional Animal Care & Use Committee (IACUC). Female C57BL/6 mice (25–30 g;n=24) were used in the study. The animals were kept in clear cages with five mice per cage and free access to food and water was ensured at all times. They were housed in a temperature-controlled room (23°C) with a normal 12-hour light/dark cycle (6:00 am to 6:00 pm). Each of these mice underwent a recovery surgery at 12 weeks of age in which an isolated injury was made to the supraspinatus, infraspinatus and teres minor. All animals underwent the same post-operative regimen of free cage activity. Animals were harvested at intervals ranging from 2–45 weeks post-injury.
Surgical Procedure
All animals underwent an identical surgical procedure on the same operative day by the same surgeon. A surgical plane of anesthesia was achieved using 2–3% isoflurane mixed with oxygen. The surgical procedure was performed using a standard deltoid splitting approach which mirrors the method by which the RC is approached in humans. Care was taken to cut only the RC tendons in a controlled manner at identical superior aspect landmarks using a sharp 21-gauge needle to separate the tendons from underlying structures as seen in Figure 1a, and spring scissors to ligate the tendons. In Figure 1a, the needle with cutting blade is placed cleanly below the RC so that when cut and reflected it can be confirmed to be completely removed from the tuberosity. In Figure 1b, the humeral head is able to be visualized following RC ligation. This was followed by deltoid repair with a single 8-0 absorbable vicryl (Ethicon, Somerville, NJ, USA) simple suture and skin closure with 5-0 vicryl (Ethicon, Somerville, NJ, USA). The procedures were performed with the approval of the IACUC at the University of Rochester Medical Center. Recovery was uneventful, and all animals returned to free cage activity for the duration of experiment and were monitored for signs of pain or distress.
Figure 1.
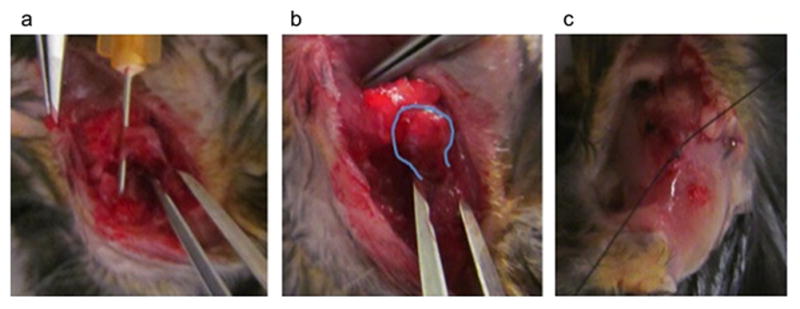
Rotator Cuff Surgery. a. Deltoid split and rotator cuff isolated. b. Rotator cuff sectioned (humeral head outlined, able to displace). c. Deltoid repaired
Shoulder harvest and Tissue Preparation
Groups of mice were sacrificed at the beginning of experimentation to establish a baseline (n=6), followed by sacrifice at intervals 14 (n=6), 29 (n=5) and 45 weeks (n=5) post-injury. Surgical and some non-operative shoulders were harvested en bloc, fixed at 20°C in 10% neutral buffered formalin for 5 days, de-calcified in 10% w/v EDTA for 21 days and embedded in paraffin. Sectioning in the coronal plane was performed to generate a series of 15 sections (5 microns thick) from each joint. These cut sections were mounted on positively charged glass slides, baked at 60°C overnight, de-paraffinized in xylene and re-hydrated in decreasing concentrations of ethanol. Sections were stained with Alcian blue and Safranin O. Time points for sacrifice were selected based on the previous work of Zuscik et al. in the timeline of degenerative changes in the murine knee.14
Data Analysis
Characterization of the shoulder pathology was undertaken using histopathologic analyses (Figure 2). In addition, microCT imaging of bilateral shoulders was performed at the 45-week harvest time point to assess the gross characteristics of the resultant CTA (Figure 3). These were evaluated by two orthopaedic surgeons who made consensus opinions based on the observed findings.
Figure 2.
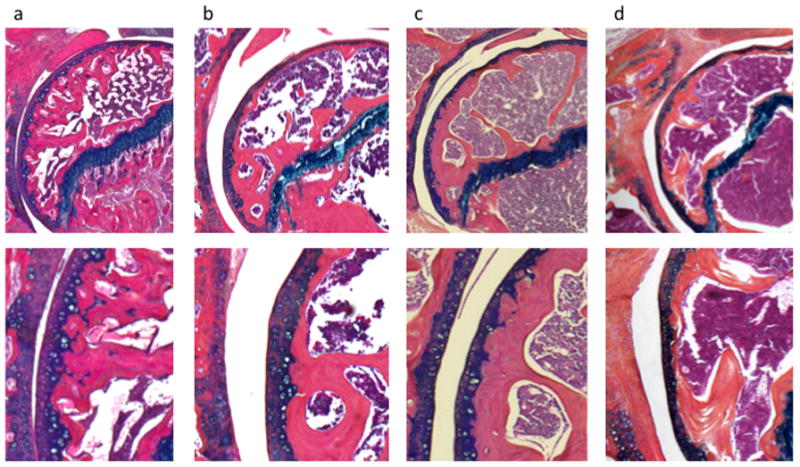
Mouse Shoulders at Baseline, 14, 29 and 45 weeks post rotator cuff injury, 5× (top panel) and 10× (bottom panel) power. a. Baseline: round articular surface with no areas of flattening, few mitotic figures superficial to tidemark, dense subchondral bone. b. 14 weeks: Some flattening of articular surface, reactive layer with mitotic figures superficial to tidemark, marrow space closer to osteochondral junction. c. 29 weeks: Pitting of articular surface, hypercellular throughout with overall depletion of articular cartilage, tidemark difficult to distinguish, further marrow infiltration. d. 45 weeks: Loss of sphericity, disorganization of cartilage with tidemark inconsistently visible, marrow proliferation with minimal subchondral bone.
Figure 3.
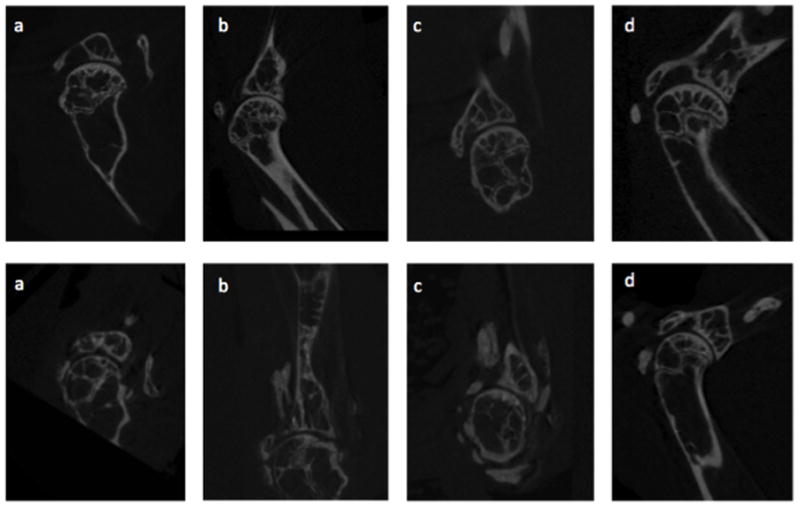
CT images of Mouse Shoulder Uninjured (top panel) and at 45 weeks Post-Rotator Cuff Injury (bottom panel). a. Humeral head medialization towards coracoid. b. Flattening of glenoid with calcification of rotator cuff tendons, migration of the humeral head towards the acromion, diminished sphericity of the humeral head, and acetabularization of the acromion. c. Anterior glenoid wear with significant soft-tissue calcifications. d. Humeral head migration towards the acromion with acetabularization of the acromion and impingement.
Quantitative histomorphometry was performed by three separate blinded observers who each analyzed several individual slides from 3–5 specimens from each time point (baseline, 14, 29 and 45 weeks post-injury, Osteomeasure, Osteometrics, Decatur GA). Each reviewer quantified uncalcified cartilage thickness (surface to tidemark), which was accomplished by measuring thickness in 20 discrete locations on each slide. Then, total cartilage (unmineralized + mineralized) was measured in the same fashion from the articular surface to the osteochondral junction (Figure 2). Observers also counted the number of mitotic figures of the articular cartilage superficial to the tidemark (Figure 3), sphericity of the humeral head (quantified by tracing the articular surface of humeral head and subtracting the length in micrometers of those portions that best fit a straight line, wavy line, or concave pitted line from those portions that fit a curve which was convex with relation to the center of the humeral head) (Figure 4), and the total area of trabecular bone and marrow between the osteochondral junction and the physeal scar (Figure 5). These measurements from each slide at each time point were compared using one-way analysis of the variance (ANOVA).
Figure 4.
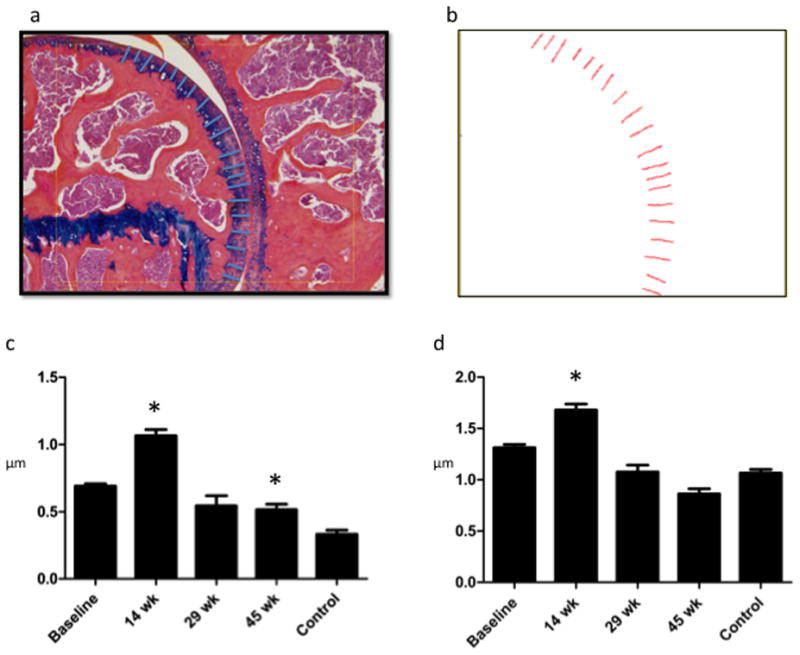
Cartilage Depth Measurements: Increase in cartilage depth during proliferative phase (14 weeks) is attributable to increase in articular cartilage superficial to the tidemark. a. Sample total cartilage depth measurement: Using a touchscreen pen, cartilage depth was traced in 20 different places by each reviewer. Each reviewer attempted to evenly space depth measurement throughout the slide. b. Osteomeasure screen shot of total cartilage depth schematic showing where the depth measurements were taken for this particular slide. c. Articular Cartilage Depth: depth from articular surface to tidemark in microns is significantly higher at 14 weeks (the proliferative stage) than at all other time points. At 45 weeks, depth was significantly less than it was at baseline or at 14 weeks. d. Total Cartilage depth is significantly greater during proliferative phase than at all other time points, significantly less at 29 and 45 weeks than at baseline and 14 weeks. This change is attributable to changes in the articular cartilage rather than the mineralized cartilage. (Note: Control = 45wk uninjured).
Figure 5.
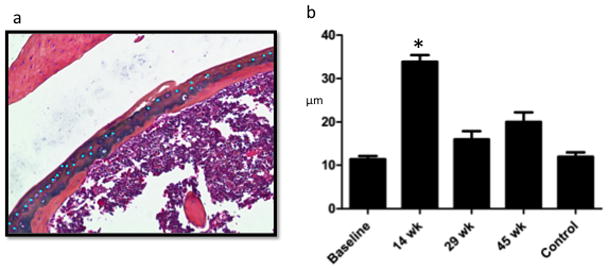
Number of Mitotic Figures is Significantly Greater During Proliferative Period (14 weeks). a. Sample mitotic figure measurement during proliferative period: using a touchscreen pen, mitotic figures were marked superficial to the mineralized cartilage (within the articular cartilage) within one standardized 10× power field (bright blue dots). Each investigator selected their own field with the goal to include maximal articular cartilage area. b. Osteomeasure counted the number of marks made by each investigator and means were calculated showing significantly more mitotic figures during the proliferative period.
Qualitative changes were characterized by the primary and senior author following repeated un-blinded evaluation of the specimens from all time points. Based on documentation of the key histopathologic changes, a novel scoring system was developed. Five blinded scorers (one PhD and two MDs specializing in arthritis research and two students who have completed significant arthritis research) scored specimens from baseline and from 14, 29 and 45 weeks post-injury (Figure 6). Only five mice were sacrificed at 29 and 45 weeks due to some mice dying of natural causes throughout the lengthy experiment. Of the five mice sacrificed at 29 weeks, two of the specimens were damaged during sectioning, staining, and processing of the sample and were therefore excluded from the final analysis. The results of these blinded evaluations were evaluated using one-way ANOVA and are seen in Figure 6B.
Figure 6.
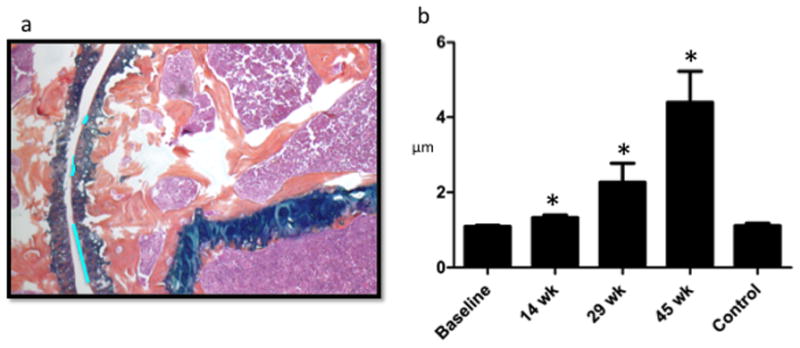
Humeral Head Sphericity Decreases Linearly Post-Injury and Remains Preserved in Controls. a. Sample sphericity measurement at 29 week post-injury: Areas of pitting or flattening (bright blue lines) outlined using Osteomeasure (shown). Areas that best fit a curve convex to the center of the humeral head also outlined using Osteomeasure (not shown). b. Ratio of length in micrometers of flattening to length in micrometers of sphericity at each time point shows that pitting and flattening increase over time in injured mouse shoulders. The control (45 week uninjured shoulder) remains spherical as compared with baseline.
RESULTS
Representative histological sections of mouse shoulders are shown in figure 2 and representative microCT images are shown in figure 3. Qualitative analysis reveals that in all images at low magnification the RC is not intact. More focused evaluation of the cartilage surface demonstrates a qualitatively evident, time-dependent degeneration in the cartilage surfaces. At baseline (figure 2a), the articular surface is spherical with few mitotic figures superficial to the tidemark and dense subchondral bone. At 14 weeks (Figure 2b), there are areas of flattened articular surface, and the cartilage has entered a “proliferative phase” in which there is a double layer of cartilage superficial to the tidemark including a superficial layer with many mitotic figures. In addition, the marrow occupies more of the humeral head as the proportion of trabecular bone decreases. At 29 weeks (Figure 2c), areas of pitting and flattening are evident along the articular surface, the cartilage is depleted and the tidemark difficult to distinguish, the organization of the cartilage is difficult to discern and grossly hypercellular, and the bone marrow shows even greater infiltration of the trabecular bone. At 45 weeks post-injury (Figure 2d), the humeral head is more than 50% flattened and pitted with overall loss of sphericity, the tidemark is inconsistently visible with overall loss of organization of the cartilage and inconsistency in cellularity, and the marrow occupies nearly all of the subchondral bone. In addition, pannus can be seen adjacent to the humeral head. The post-injury degeneration of the humeral head was progressive, with shoulders showing the most robust degeneration at 45 weeks post-injury.
Semi-quantitative histomorphometric measurements of cartilage depth allowed the comparison of articular vs. mineralized cartilage thickness changes over time (Figure 4a–b). Measurements were taken at regular spatial intervals and allow for a fine resolution of local cartilage depth analysis in an objective, blinded fashion by multiple reviewers as previously described for the mouse knee.15 This method has proven effective in the development of a standardized measurement system in other mouse joints and boasts low interobserver reliability.
Figure 4a–b a shows the application of this analysis to a typical 12-week post-injury shoulder by a typical reviewer. Quantitative spatial data on total cartilage depth (1.313 microns at baseline, 1.68 microns at 14 weeks) from this representative slide is segmented and can be analyzed for depth (Figure 4c), position (data not shown) and inter-observer reliability.
The total mean articular cartilage depth for the joint as measured objectively using this method (figure 4d). The increase in total cartilage thickness during the proliferative period (14 weeks) is attributable to an increase in articular cartilage only. It is also in this region of articular cartilage, superficial to the tidemark, that mitotic figures increase during the proliferative period.
In the articular cartilage, mitotic figures were measured by blinded observers (Figure 3A, representative measurement). In injured shoulders, this analysis revealed the same pattern of initial increase during the proliferative period (14 weeks), followed by sustained decrease over time (Figure 5a–b). It should be noted that 45-week control shoulders showed no difference compared to baseline.
The sphericity of the humeral head was directly assessed using a quantitative objective means to identify pitting and flattening (Figure 6a). The ratio of perimeter of flattened or pitted regions to the overall spherical joint perimeter shows a time-dependent increase in pitting and flattening (loss of sphericity) is evident and distinctly different from both baseline and age-matched controls (Figure 6b).
As a quantitative correlate of the volume of trabecular bone occupying the humeral epiphysis, successive histopathologic specimens were analyzed for the ratio of trabecular bone area to total bone area between the physeal scar and the osteochondral junction (representative specimen, Figure 7a). Age-dependent decreases in the proportion of trabecular bone resulted from an increase in the amount of reactive marrow present in the injured mouse shoulder (Figure 7b).
Figure 7.
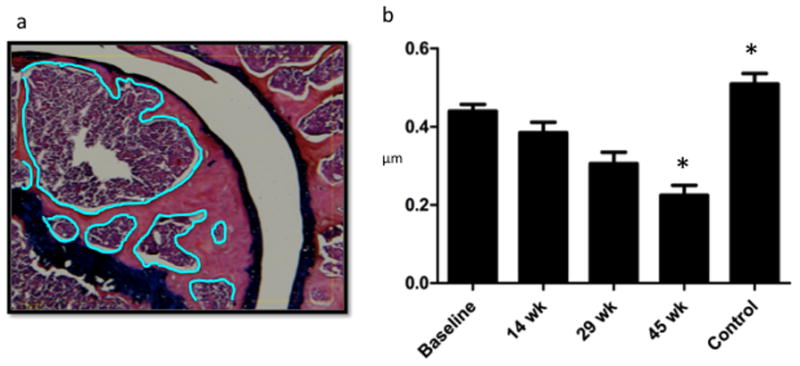
Trabecular Bone Area Between Mineralized Cartilage and Physeal Scar Decreases with Time Post-Injury. a. Osteomeasure screen shot with bone marrow area to be subtracted outlined in blue: Using a touchscreen pen, all bone between the physeal scar and base of the mineralized cartilage was outlined in a single 10× power field. Then, trabecular bone was outlined and subtracted from this yielding area measurements for total outlined area, voided area, and remaining area. b. Ratio of Trabecular Bone to Total Bone: Ratios were calculated based on measurements of all three reviewers. The ratio of trabecular: total bone area was significantly greater at 29 and 45 weeks than at baseline and 14 weeks, indicating that bone becomes reactive in response to prolonged injury despite aging of the mice.
Based on previous work using the OARSI classification system, we developed a scoring rubric for the evaluation of time-dependent degeneration of the mouse shoulder following RC injury (Table 1). Parameters included sphericity of the humeral head, cellularity of the articular cartilage, subchondral bone morphology, degree of organization of the mineralized and articular cartilage, and presence or absence of pannus within the joint. Scores increased predictably with time following injury (Figure 8a–b) in a statistically significant manner. Controls (45 week uninjured specimens, n=5) were significantly less affected by the aging process than injured specimens (n=5). Agreement between the five blinded observers in assigning our novel Murine Shoulder Arthritis Score, MSAS, was confirmed using simple and weighted kappa, which was 0.46 and 0.90, respectively. Given high inter-observer agreement, the 5 observer scores were averaged for each section. These average scores from all sections in a given experimental group were then combined to calculate an overall average score.
TABLE 1.
Murine Shoulder Arthritis Score (MSAS) Scoring System
| Points | 0 | 1 | 2 | 3 |
|---|---|---|---|---|
| Sphericity of Articular Portion of Humeral Head | 100% spherical | 80% spherical | 50% spherical | mostly flattened/pitted |
| Cellularity | obvious hypocellular layer superficial to tidemark | reactive cellular layer superficial to tidemark | scant layer superficial to tidemark | tidemark difficult to distinguish/inconsistent |
| Subchondral Bone Morphology | well trabeculated subchondral bone without bone marrow close to osteochondral junction | scant bone marrow approaching osteochondral junction | <50% of subchondral bone infiltrated by marrow space | >50% of subchondral bone infiltrated by marrow space |
| Alcian Blue Staining | intense blue staining deep to tidemark | two separate areas of intense blue staining: one deep to tidemark and one superficial | one thin area of deep blue staining with tidemark unclear | disorganized |
| Pannus Present | no | - | - | yes |
Figure 8.
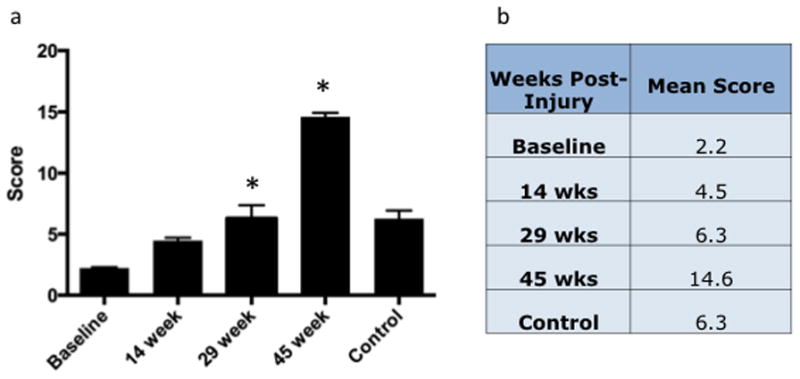
Murine Shoulder Arthritis Score Increases with Time, Significantly Higher at 29 Weeks than at Baseline and Significantly Higher at 45 Weeks than at all Other Time Points. a. Total Score. b. Mean total scores at each time point.
Finally, microCT scanning was performed to assess the mineralized structure of injured and control shoulder joints in a group of five mice. These scans (Figure 3) depicted findings commonly associated with rotator cuff arthropathy in humans including humeral head escape, acetabularization of the acromion, deformation of the humeral head, and glenoid wear. In addition to migrating towards the acromion, the humeral head was also noted to migrate towards the coracoid in one case.
DISCUSSION
Rotator cuff injury is known to progress in some individuals to a physiologically distinct form of shoulder arthritis, and a mouse model of this arthritis would be valuable for study of the tissue, molecular and genetic basis of this clinical situation. Since murine models are used to study osteoarthritis in the knee and hip, genetic variants are available for analysis. We have found that with simple injuries to the rotator cuff, we can achieve features of cuff tear arthropathy (CTA) that are consistent with human CTA.
In this study, we evaluated the development of CTA in a murine model of massive RCTs. The purpose of this study was twofold: 1) to establish a mouse model of CTA that demonstrates pathological changes comparable to that seen in humans, and 2) to develop a novel histopathological scoring system. This is the first study to characterize the articular cartilage changes in the mouse humeral head and glenoid. Additionally, we assessed the alterations in the subchondral bone that correlated with the cartilage degeneration. We then used these histological parameters to create a grading system that determines the stage in the progression of CTA.
CTA was originally described by Neer in 1983 as the end-point of severity in degeneration of the glenohumeral joint correlated with a massive RCT.5 Neer postulated that alterations in both mechanical and nutritional factors occur when there is significant injury to the RC tendons.5 When the stabilizing forces of the RC are disrupted, joint instability enables superior migration of the humeral head. Pathologic contact between the humerus and the glenoid and coracoacromial arch leads to frictional wear of the articular cartilage on these joint structures as well as subacromial impingement. Cartilage wear and erosion of the underlying subchondral bone occurs leading to femoralization of the humerus, acetabularization of the glenoid, and eventually, collapse of the humeral head.3;4;5;17 McCarty et al provided an alternate theory, postulating that articular cartilage destruction in the setting of RC deficiency is secondary to hydroxyapatite (calcium phosphate) crystal accumulation in the synovial fluid and tissue of joint space.16 Collins and Harryman combined these two hypotheses to explain the pathogenesis of CTA: pathologic joint kinematics lead to articular cartilage wear and fragmentation, resulting in crystal deposition and further degeneration.17
The precise pathophysiology and natural history of joint degeneration in CTA remains poorly understood. RC tendons play a crucial role in maintaining the dynamic stability of the inherently unstable GH joint,18; 19 so it stands to reason that mechanical forces are the primary cause of articular cartilage degeneration in the setting of a massive RCT.20; 21 However, loss of mechanical properties does not fully explain the development of CTA, as degeneration and destruction of articular cartilage occurs in <10% of patients with a massive RCT.22 There is limited data evaluating the articular changes that occur in the development of CTA.
RCTs are present in ~21% of the population and increase in prevalence with age, seen in >50% of individuals over 80 yo,23; 24 compared to 26–30% of 60 – 80 yos25; 26 and 24% of 40–60 yos.26 Many RCTs are asymptomatic and thus clinically silent. More than half of asymptomatic RCTs develop symptoms within 3 years, and half of these patients also present with an increase in tear size during this asymptomatic time frame.27 Operative outcomes are inconsistent,28 and nonoperative treatment is a reasonable first step for most patients.8; 21; 28 However, when conservative treatment fails, these patients are at risk of increase in tear size, irreparability, and progression to CTA.
Animal models are essential to uncover the pathogenesis of RCA from RCT to irreparable joint destruction. Murine models are of particular interest as mice have been used to study osteoarthritis in the knee and hip, yielding information about the histopathologic, radiographic, clinical, biomechanical, and biochemical elements of arthritis initiation and progression. These processes and interventions can be studied in our model of shoulder CTA. In addition, transgenic mice are available to study genetic defects and biochemical processes thought to be involved in the development of OA,29 allowing research of critical molecules such as degradative enzymes and inflammatory factors. Since genetic factors may contribute to 38 – 65% of OA prevalence,29; 30 the use of transgenic mice for the manipulation of gene expression is essential. A murine model enables researchers to elucidate the roles and relative contributions of various gene products in the progression from RCT to CTA and provides opportunities for therapeutic intervention.
Semi-quantitative classification schemes have been developed that allow evaluation of joint degenerative changes, allowing for assessment of therapeutic interventions and genetic modifications. In clinical decision making for patient care, radiographic classification systems are most commonly used. Hamada et al31; 32 and Vitosky-Seebauer’s33 radiographic classification uses plain radiographs in assessment of the GH joint with characteristic features seen at each stage of disease. Our mouse model has the following known similarities to shoulder osteoarthritis in humans: cartilage wear, glenoid wear, humeral head migration/escape, glenohumeral joint space narrowing, and humeral head collapse. There are specific characteristic radiographic changes seen in the progression of RCD and development of CTA. Ultimately, CTA staging using the Hamada scheme allows differentiation of shoulder joints amenable to joint-preserving surgery (grades 1–3) from those deemed for arthroplasty (grades 4–5)34.
Histopathological classification schemes are frequently utilized when studying cartilage degenerative disease in animal models. Currently, the most commonly employed histopathologic systems for grading OA lesions include Mankin grading for human cartilage analysis (although there are studies that have employed this in various animal models),35 and OARSI scoring for study of the mouse knee.15 The Mankin and OARSI scoring systems account for several features of knee OA that we did not find to be features of shoulder OA: vertical fissures and clefts, crossing of the tidemark by blood vessels, orientation of columns of cells which are not present in the normal mouse shoulder, cyst formation, and micro fracture. The absence of these features in CTA is likely attributable in part to minimal weight bearing through the shoulder, however there are also structural differences between uninjured mouse cartilage in the shoulder as compared with the knee.
Based on these observations, we evaluated the progression of changes over the course of 45 weeks after RC injury with the intention of characterizing the nature and course of cartilage morphology changes in the setting of worsening osteoarthritis secondary to RC tear. The development of this new scoring system was driven by discrepancies between observed characteristics of shoulder osteoarthritis in our mouse model and those characteristics captured by the Mankin and OARSI scoring systems. Our new scoring system, termed the Murine Shoulder Arthritis Score (MSAS) is based on the observations made by our investigative team and the development of consensus opinion on how to describe the progression of mouse shoulder OA (Table 1).
Quantitative analysis was undertaken with regard to parameters including depth to osteochondral junction (total cartilage depth), depth of cartilage superficial to the tidemark (articular cartilage), depth of cartilage deep to the tidemark (calcified cartilage), number of mitotic figures per 10× power field, humeral head sphericity and proportion of bone superficial to the physeal scar which was trabecular vs. marrow (with increased marrow being a known sign of reactivity to stress). We focused on the following parameters: cellularity, proteoglycan content (Alcian Blue staining), humeral head sphericity and subchondral bone morphology. This resulted in the scoring system presented in Figure 6a. This measure reliably showed time dependent increases after injury despite the fact that these animals may bear significant weight on the shoulder.
The present study is limited in that the analytical work presented here was focused on tissue structure and does not include an analysis of biochemical, molecular or genetic characteristics. Animal models do not perfectly mimic injuries that are seen in humans.20; 36 The normal ambulation of the animal was altered in this RCT model, which could impact joint degradation. Mice are quadrupeds and therefore have inherently dissimilar joint loading mechanics. Unfortunately, if any direct effects were present from the quadrupedal movement, the degree to which it contributed to the articular degeneration is unknown. However, we believe that this model simulates the arthropathy seen in humans that results from some severe RCTs, as we were able to demonstrate the progressive wear of the glenohumeral joint that occurs in a predictable manner.
All of this considered, in this report, we describe the development of a novel murine model of CTA and have created the MSAS histopathologic scoring system for the shoulder that is comparable to the OARSI scoring system in the knee. Application of this model and the associated analysis to questions of molecular mechanism and therapy development will set the stage for novel approaches to address the clinical problem of CTA in humans.
Statement of Clinical Significance.
This study provides a reproducible mouse model of shoulder arthritis following isolated injury to the rotator cuff which elucidates characteristics of cuff tear arthropathy and provides a scoring system and venue for future research.
Acknowledgments
The authors wish to thank Sarah Mack and Kathy Maltby (Histology, Biochemistry and Molecular Imaging Core), Jayne Gavrity (Biomedical Engineer, Musculoskeletal Tissue Engineering Lab) and Michael Thullen (Biomechanics and Multimodal Tissue Imaging Core), both in the Center for Musculoskeletal Research at the University of Rochester. They provided outstanding technical assistance and advice for tissue analysis and microCT imaging presented in this report. This work was supported by NIH NIAMS K01 AR060164 (JCE), NIH NIAMS P50 AR054041-5471 (MJZ), NIH NIAMS P30 AR061307 and NIH NCATS UL1 RR024160.
Footnotes
AUTHORS’ CONTRIBUTIONS
Alissa Zingman participated in significant thought leadership, participated in some of the surgeries, designed the MSAS scoring system, administered the blinded scoring, managed the data, made the figures, did the statistics, and wrote the manuscript. Hiayan Li participated in performing the majority of the surgeries and preparing the histology slides. Leigh Sundem participated in preparing the manuscript for publication. Becca DeHority served as a blinded scorer. Michael Geary served as a blinded scorer. Theron Fussel participated in assisting with surgeries and histology preparation. Robert Mooney served as a blinded scorer. Michael Zuscik participated in significant thought leadership, significant work on the manuscript, and served as a blinded scorer. John Elfar participated in significant thought leadership, assisted development of the MSAS scoring system, and contributed significant work on the manuscript.
References
- 1.Lashgari C, Redziniak D. The natural history of rotator cuff tears. Current Orthopaedic Practice. 2012;23:10–13. [Google Scholar]
- 2.Mather RC, 3rd, Koenig L, Acevedo D, et al. The societal and economic value of rotator cuff repair. J Bone Joint Surg Am. 2013;95:1993–2000. doi: 10.2106/JBJS.L.01495. [DOI] [PMC free article] [PubMed] [Google Scholar]
- 3.Zingg PO, Jost B, Sukthankar A, et al. Clinical and structural outcomes of nonoperative management of massive rotator cuff tears. J Bone Joint Surg Am. 2007;89:1928–1934. doi: 10.2106/JBJS.F.01073. [DOI] [PubMed] [Google Scholar]
- 4.Funk LHJ, Trail I. Rotator cuff arthropathy. Current Orthopaedics. 2007;21:415–421. [Google Scholar]
- 5.Neer CS, II, Craig EV, Fukuda H. Cuff-tear arthropathy. J Bone Joint Surg Am. 1983;65:1232–1244. [PubMed] [Google Scholar]
- 6.Aumiller WD, Kleuser TM. Diagnosis and treatment of cuff tear arthropathy. JAAPA. 2015;28:33–38. doi: 10.1097/01.JAA.0000469435.44701.ce. [DOI] [PubMed] [Google Scholar]
- 7.Tashjian RZ. Epidemiology, natural history, and indications for treatment of rotator cuff tears. Clin Sports Med. 2012;31:589–604. doi: 10.1016/j.csm.2012.07.001. [DOI] [PubMed] [Google Scholar]
- 8.Ecklund KJ, Lee TQ, Tibone J, et al. Rotator cuff tear arthropathy. J Am Acad Orthop Surg. 2007;15:340–349. doi: 10.5435/00124635-200706000-00003. [DOI] [PubMed] [Google Scholar]
- 9.Perry SM, Getz CL, Soslowsky LJ. Alterations in function after rotator cuff tears in an animal model. J Shoulder Elbow Surg. 2009;18:296–304. doi: 10.1016/j.jse.2008.10.008. [DOI] [PMC free article] [PubMed] [Google Scholar]
- 10.Dourte LM, Perry SM, Getz CL, et al. Tendon properties remain altered in a chronic rat rotator cuff model. Clin Orthop Relat Res. 2010;468:1485–1492. doi: 10.1007/s11999-009-1206-y. [DOI] [PMC free article] [PubMed] [Google Scholar]
- 11.Chen JM, Willers C, Xu J, et al. Autologous tenocyte therapy using porcine-derived bioscaffolds for massive rotator cuff defect in rabbits. Tissue Eng. 2007;13:1479–1491. doi: 10.1089/ten.2006.0266. [DOI] [PubMed] [Google Scholar]
- 12.Liu X, Laron D, Natsuhara K, et al. A mouse model of massive rotator cuff tears. J Bone Joint Surg Am. 2012;94:e41. doi: 10.2106/JBJS.K.00620. [DOI] [PubMed] [Google Scholar]
- 13.Kim HM, Galatz LM, Lim C, et al. The effect of tear size and nerve injury on rotator cuff muscle fatty degeneration in a rodent animal model. J Shoulder Elbow Surg. 2012;21:847–858. doi: 10.1016/j.jse.2011.05.004. [DOI] [PMC free article] [PubMed] [Google Scholar]
- 14.Hamada D, Sampson ER, Maynard RD, et al. Surgical induction of posttraumatic osteoarthritis in the mouse. Methods Mol Biol. 2014;1130:61–72. doi: 10.1007/978-1-62703-989-5_5. [DOI] [PubMed] [Google Scholar]
- 15.Glasson SS, Chambers MG, Van Den Berg WB, et al. The OARSI histopathology initiative - recommendations for histological assessments of osteoarthritis in the mouse. Osteoarthritis Cartilage. 2010;18(Suppl 3):S17–23. doi: 10.1016/j.joca.2010.05.025. [DOI] [PubMed] [Google Scholar]
- 16.McCarty DJ, Halverson PB, Carrera GF, et al. “Milwaukee shoulder”--association of microspheroids containing hydroxyapatite crystals, active collagenase, and neutral protease with rotator cuff defects. I. Clinical aspects. Arthritis Rheum. 1981;24:464–473. doi: 10.1002/art.1780240303. [DOI] [PubMed] [Google Scholar]
- 17.Collins DN, Harryman DT., 2nd Arthroplasty for arthritis and rotator cuff deficiency. Orthop Clin North Am. 1997;28:225–239. doi: 10.1016/s0030-5898(05)70282-0. [DOI] [PubMed] [Google Scholar]
- 18.Abboud JA, Soslowsky LJ. Interplay of the static and dynamic restraints in glenohumeral instability. Clin Orthop Relat Res. 2002:48–57. doi: 10.1097/00003086-200207000-00007. [DOI] [PubMed] [Google Scholar]
- 19.Soslowsky LJ, Carpenter JE, Bucchieri JS, et al. Biomechanics of the rotator cuff. Orthop Clin North Am. 1997;28:17–30. doi: 10.1016/s0030-5898(05)70261-3. [DOI] [PubMed] [Google Scholar]
- 20.Kramer EJ, Bodendorfer BM, Laron D, et al. Evaluation of cartilage degeneration in a rat model of rotator cuff tear arthropathy. J Shoulder Elbow Surg. 2013;22:1702–1709. doi: 10.1016/j.jse.2013.03.014. [DOI] [PMC free article] [PubMed] [Google Scholar]
- 21.Reuther KE, Sarver JJ, Schultz SM, et al. Glenoid cartilage mechanical properties decrease after rotator cuff tears in a rat model. J Orthop Res. 2012;30:1435–1439. doi: 10.1002/jor.22100. [DOI] [PMC free article] [PubMed] [Google Scholar]
- 22.Gartsman GM, Taverna E. The incidence of glenohumeral joint abnormalities associated with full-thickness, reparable rotator cuff tears. Arthroscopy. 1997;13:450–455. doi: 10.1016/s0749-8063(97)90123-7. [DOI] [PubMed] [Google Scholar]
- 23.Yamamoto A, Takagishi K, Osawa T, et al. Prevalence and risk factors of a rotator cuff tear in the general population. J Shoulder Elbow Surg. 2010;19:116–120. doi: 10.1016/j.jse.2009.04.006. [DOI] [PubMed] [Google Scholar]
- 24.Tempelhof S, Rupp S, Seil R. Age-related prevalence of rotator cuff tears in asymptomatic shoulders. J Shoulder Elbow Surg. 1999;8:296–299. doi: 10.1016/s1058-2746(99)90148-9. [DOI] [PubMed] [Google Scholar]
- 25.Yamaguchi K, Ditsios K, Middleton WD, et al. The demographic and morphological features of rotator cuff disease. A comparison of asymptomatic and symptomatic shoulders. J Bone Joint Surg Am. 2006;88:1699–1704. doi: 10.2106/JBJS.E.00835. [DOI] [PubMed] [Google Scholar]
- 26.Sher J, Uribe J, Posada A, et al. Abnormal findings on magnetic resonance images of asymptomatic shoulders. J Bone Joint Surg Am. 1995;77:10– 15. doi: 10.2106/00004623-199501000-00002. [DOI] [PubMed] [Google Scholar]
- 27.Yamaguchi K, Tetro AM, Blam O, et al. Natural history of asymptomatic rotator cuff tears: a longitudinal analysis of asymptomatic tears detected sonographically. J Shoulder Elbow Surg. 2001;10:199–203. doi: 10.1067/mse.2001.113086. [DOI] [PubMed] [Google Scholar]
- 28.Eajazi A, Kussman S, LeBedis C, et al. Rotator Cuff Tear Arthropathy: Pathophysiology, Imaging Characteristics, and Treatment Options. AJR Am J Roentgenol. 2015;205:W502–511. doi: 10.2214/AJR.14.13815. [DOI] [PubMed] [Google Scholar]
- 29.Helminen HJ, Saamanen AM, Salminen H, et al. Transgenic mouse models for studying the role of cartilage macromolecules in osteoarthritis. Rheumatology (Oxford) 2002;41:848–856. doi: 10.1093/rheumatology/41.8.848. [DOI] [PubMed] [Google Scholar]
- 30.Little CB, Smith MM. Animal Models of Osteoarthritis. Current Rheumatology Reviews. 2008;4:1–8. [Google Scholar]
- 31.Hamada K, Fukuda H, Mikasa M, et al. Roentgenographic findings in massive rotator cuff tears. A long-term observation. Clin Orthop Relat Res. 1990:92–96. [PubMed] [Google Scholar]
- 32.Hamada K, Yamanaka K, Uchiyama Y, et al. A radiographic classification of massive rotator cuff tear arthritis. Clin Orthop Relat Res. 2011;469:2452–2460. doi: 10.1007/s11999-011-1896-9. [DOI] [PMC free article] [PubMed] [Google Scholar]
- 33.Visotsky JL, Basamania C, Seebauer L, et al. Cuff tear arthropathy: pathogenesis, classification, and algorithm for treatment. J Bone Joint Surg Am. 2004;86-A(Suppl 2):35–40. [PubMed] [Google Scholar]
- 34.Kappe T, Cakir B, Reichel H, et al. Reliability of radiologic classification for cuff tear arthropathy. J Shoulder Elbow Surg. 2011;20:543–547. doi: 10.1016/j.jse.2011.01.012. [DOI] [PubMed] [Google Scholar]
- 35.Mankin HJ, Dorfman H, Lippiello L, et al. Biochemical and metabolic abnormalities in articular cartilage from osteo-arthritic human hips. II. Correlation of morphology with biochemical and metabolic data. J Bone Joint Surg Am. 1971;53:523–537. [PubMed] [Google Scholar]
- 36.Davies MR, Ravishankar B, Laron D, et al. Rat rotator cuff muscle responds differently from hindlimb muscle to a combined tendon-nerve injury. J Orthop Res. 2015;33:1046–1053. doi: 10.1002/jor.22864. [DOI] [PubMed] [Google Scholar]


