


Abstract
Of the three forms of nitrogenase (Mo-nitrogenase, V-nitrogenase, and Fe-nitrogenase), Fe-nitrogenase has the poorest ratio of N2 reduction relative to H2 evolution. Recent work on the Mo-nitrogenase has revealed that reductive elimination of two bridging Fe–H–Fe hydrides on the active site FeMo-cofactor to yield H2 is a key feature in the N2 reduction mechanism. The N2 reduction mechanism for the Fe-nitrogenase active site FeFe-cofactor was unknown. Here, we have purified both component proteins of the Fe-nitrogenase system, the electron-delivery Fe protein (AnfH) plus the catalytic FeFe protein (AnfDGK), and established its mechanism of N2 reduction. Inductively coupled plasma optical emission spectroscopy and mass spectrometry show that the FeFe protein component does not contain significant amounts of Mo or V, thus ruling out a requirement of these metals for N2 reduction. The fully functioning Fe-nitrogenase system was found to have specific activities for N2 reduction (1 atm) of 181 ± 5 nmol NH3 min−1 mg−1 FeFe protein, for proton reduction (in the absence of N2) of 1085 ± 41 nmol H2 min−1 mg−1 FeFe protein, and for acetylene reduction (0.3 atm) of 306 ± 3 nmol C2H4 min−1 mg−1 FeFe protein. Under turnover conditions, N2 reduction is inhibited by H2 and the enzyme catalyzes the formation of HD when presented with N2 and D2. These observations are explained by the accumulation of four reducing equivalents as two metal-bound hydrides and two protons at the FeFe-cofactor, with activation for N2 reduction occurring by reductive elimination of H2.
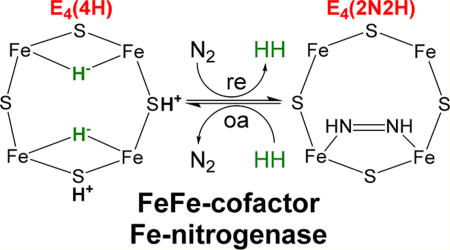
Graphical abstract
Nitrogenase is the microbial enzyme responsible for biological dinitrogen (N2) fixation to ammonia (NH3) and represents the largest contributor of fixed nitrogen (N) to the global biogeochemical nitrogen cycle.1–3 There are only three known forms of nitrogenase designated as the molybdenum (Mo)-dependent, the vanadium (V)-dependent, and the iron (Fe)-dependent enzymes,4–6 each encoded by unique gene clusters, designated nif, vnf, and anf, respectively.7–9 Each nitrogenase contains a complex metal cluster called the FeMo-cofactor, FeV-cofactor, and FeFe-cofactor, as the active site for substrate reduction (Figure 1B). These multimetallic cofactors all contain Fe and S, with available evidence indicating that all three are similar, with substitution of one metal (Mo, V, or Fe).4,5,10–13 The X-ray structure of the Mo-nitrogenase has been well established,14 and a recent X-ray structure of the V-dependent nitrogenase confirms that the basic architectures of FeMo-cofactor and FeV-cofactor are similar, with V substituting for Mo.15 Additionally, the structure of FeV-cofactor shows a molecule replacing one of the bridging sulfide atoms found in FeMo-cofactor. While the identity of the molecule replacing S is unknown, it has been proposed to be carbonate.15 No structural information is available for the FeFe-cofactor in Fe-nitrogenase.
Figure 1.

General nitrogenase architecture, nitrogenase cofactors, and N2 activation mechanism. (A) Schematic of nitrogenases showing the electron delivery component (Fe protein), catalytic component (MoFe, VFe, or FeFe protein), metal clusters, and electron delivery pathway. The differing metal atom (M in red) is Mo, V, or Fe. MoFe protein is an α2β2 heterotetramer, while VFe and FeFe proteins are α2β2γ2 heterohexamers. (B) Structural models of nitrogenase cofactors with homocitrate on the right based on crystal structures for MoFe and VFe proteins. The carbonate in the FeV-cofactor has not been unambiguously assigned. No structure for the FeFe-cofactor is available, so a model is proposed based on available data. (C) Simplified form of the N2 activation mechanism, with cartoons of the Fe 2, 3, 6, 7 face of FeMo-cofactor in the E0, E2, and E4 states (designation from the Lowe–Thorneley kinetic model) showing hydrides and protons and showing both the re/oa equilibrium with loss of H2 and binding/reduction of N2 (going right) and the two steps of H2 generation by hydride protonation that occur in the absence of N2 (going left). The exact location of the bound hydrides and protons is proposed.
Mo-nitrogenase is the best studied of the three nitrogenase forms. It is a two-component system comprising a catalytic MoFe protein (NifDK) and electron-delivery Fe protein (NifH) (Figure 1A). The Fe protein is a homodimer that contains a single Fe4S4 cluster and two MgATP-binding sites.5 The MoFe protein is a α2β2 heterotetramer that forms two catalytic halves, with each half containing a Fe8S7 cluster (P-cluster) and a MoFe7S9C-homocitrate active site cofactor (FeMo-co). During catalysis, the two component proteins transiently associate, during which the Fe protein donates one electron to the MoFe protein, coupled to the hydrolysis of two MgATP. Electrons are accumulated on FeMo-cofactor, with the P-cluster proposed to act as a “deficit-spending” electron shuttle between the Fe protein and FeMo-cofactor.5,13 Studies of the MoFe protein trapped during catalysis have shown how electrons and protons accumulate on FeMo-cofactor and how the enzyme is activated for N2 binding and reduction (Figure 1C).13 In short, four electrons and protons must be accumulated on FeMo-cofactor to create the E4(4H) state before N2 can be reduced. This E4(4H) state contains two Fe–H–Fe bridging hydrides. The two hydrides combine to make H2 in a reductive elimination (re) reaction that is coupled to N2 binding and reduction by two electrons/protons to the first bound intermediate, a diazenido-metal complex (E4(2N2H)). The re step is reversible, with the oxidative addition (oa) of H2 by E4(2N2H) leading to N2 release.13,16–19 The reversibility of this re/oa step explains early findings that two HD are formed for every D2 consumed when nitrogenase is turned over in the presence of D2 and N2.20,21 This observation can be understood from the mechanistic model as resulting from oa of D2 by the E4(2N2H) state, which leads to formation of two metal-bound D− with loss of N2. These nonexchangeable deuterides each react with H+ derived from solvent, yielding two HD.20,21 Overall, the two signature features of the re/oa mechanism for N2 activation by nitrogenase are the observations that H2 can inhibit N2 reduction and that turnover in the presence of N2 and D2 results in the formation of HD.
Studies on V-nitrogenase have indicated that while it does reduce N2, it does so at a lower rate compared to Mo-nitrogenase, and little is known about its catalytic mechanism.4,6,10,12,22 Even fewer studies have been conducted on Fe-nitrogenase, and less is known about its mechanism for N2 reduction.4,9,11,12,23–28 Like Mo-nitrogenase, Fe-nitrogenase comprises an electron-delivery Fe protein (AnfH) and catalytic “FeFe protein” (AnfDGK) (Figure 1A). Compared to the MoFe protein, the FeFe protein incorporates an extra gamma subunit per catalytic half, forming an α2β2γ2 heterohexamer (Figure 1A). Amino acid residues in the Fe protein of Mo-nitrogenase that coordinate the Fe4S4 cluster and nucleotide binding sites, as well as those in MoFe protein that coordinate the P-cluster and FeMo-cofactor, are conserved in the Fe-nitrogenase proteins.8,9,29,30 Spectroscopic studies predict that Fe-nitrogenase contains a metallocluster called FeFe-co that is structurally homologous to FeMo-co of Mo-nitrogenase.11
While structurally and functionally similar, some aspects of catalysis by the three nitrogenases are not identical. In the case of Mo-nitrogenase, the re/oa equilibrium incorporates a mechanistically required limiting stoichiometry (eq 1) for N2 reduction
| (1) |
as proposed by Lowe and Thorneley.31 This limiting stoichiometry is, in fact, approached under high N2 pressures.32 In contrast, under 1 atm partial pressure of N2 (PN2), the optimal stoichiometry for Fe-nitrogenase is about 9 H2 per N2 reduced.9 The mechanism-determined ratio of H2 formed per N2 reduced for V-nitrogenase is not known, but the observed H2 produced/N2 reduced ratio is between the values for the Mo- and Fe-enzymes. Overall, there is no experimental evidence to establish that the V- and Fe-nitrogenases follow the same re/oa mechanism for N2 activation and the same mechanistic stoichiometry proposed for N2 activation by the Mo-enzyme. Indeed, the absence of Mo in the Fe-enzyme directly raises the possibility that this enzyme could follow a different mechanism for N2 reduction.
Here, we have purified both component proteins for the Azotobacter vinelandii Fe-nitrogenase and carried out experiments that reveal that this nitrogenase indeed follows the re/oa mechanism established for Mo-nitrogenase, with its “eight-electron” stoichiometry (eq 1).
MATERIALS AND METHODS
Reagents and General Procedures
All reagents were obtained from Sigma-Aldrich (St. Louis, MO) or Fisher Scientific (Fair Lawn, NJ) unless specified otherwise and used without further purification. Argon, dinitrogen, dihydrogen, D2, acetylene, and ethylene gases were purchased from Air Liquide America Specialty Gases LLC (Plumsteadville, PA). Manipulation of proteins and buffers was done anaerobically in septum-sealed serum vials or flasks under an argon atmosphere or on a Schlenk line. Gas transfers were made using gastight syringes.
Strain Construction, Bacterial Growth, and Protein Expression and Purification
A. vinelandii strain DJ1255 was constructed in two steps. First, the tungsten-tolerant phenotype was transferred to DJ33, which is deleted for the nifDK genes,33 by using chromosomal DNA isolated from CA11.6.24 This strain is designated DJ1254 and is inactivated for the Mo-dependent system but has both the V-dependent and Fe-only nitrogen fixation systems intact. Subsequently, the V-dependent system from DJ1254 was inactivated by transformation using pDB1087 DNA that carries a kanamycin-resistance gene cartridge located within the N-terminal coding region of vnfK. This strain, DJ1255, is inactivated for both the Mo-dependent and V-dependent nitrogenases but retains an intact Fe-dependent nitrogenase.
Fe-nitrogenase proteins, FeFe protein (AnfDGK) and Fe protein (AnfH), were expressed in A. vinelandii strain DJ1255 cells grown under N2 fixing conditions at 30 °C in Burk N-free medium34 with Na2MoO4 omitted in a custom-built 100 L fermenter with stirring and aeration to an OD600 of 1.8–2.0 and then harvested. Mo-nitrogenase proteins were expressed in A. vinelandii strains DJ995 (MoFe protein, NifDK) and DJ884 (Fe protein, NifH) and grown as previously described.35 For Mo-nitrogenase proteins, crude cell extracts were prepared and proteins were purified according to previously described methods with minor modifications.35–37 For Fe-nitrogenase proteins, cell extracts were prepared using a French pressure cell (SLM Aminco FA-078, Aminco, Rochester, NY) operated at 1500 lb/in2 in a degassed 50 mM Tris·HCl buffer (pH 8.0) with 2 mM sodium dithionite. All steps were conducted with oxygen-free buffers under Ar gas. This is the base buffer used throughout the purification with varying concentrations of NaCl as indicated. The cell extract was centrifuged at 50 000g for 1 h to remove cell debris. Lysate was then loaded onto a ~170 mL Q-Sepharose column that had been previously washed in buffer containing 1 M NaCl and then rinsed and equilibrated in no salt buffer. The column was then washed for 2 column volumes (CV) with 10% NaCl. Proteins were separated with a NaCl gradient (20–45% NaCl over 6 CV at 5 mL/min). AnfH eluted off the column as a dark brown fraction at 24–27% NaCl, and AnfDGK eluted as a dark brown fraction at 29–35% NaCl. AnfH and AnfDGK fractions were then further purified with Sephacryl S-200 or Sephacryl S-300 columns, respectively, in buffer with 250 mM NaCl. Pooled fractions of AnfH or AnfDGK were concentrated using an Amicon (EMD Millipore, Billerica, MA) concentrator with a 60 or 100 kDa cutoff membrane, respectively, and stored in liquid nitrogen. Protein concentrations were determined by the Biuret assay using BSA as a standard. Protein purity of >85% was confirmed by sodium dodecyl sulfate polyacrylamide gel electrophoresis (SDS-PAGE) analysis using Coomassie blue staining.
Protein Identification
Protein identification from gel bands and solution digestion was performed according to standard protocols recommended by the manufacturers using a trypsin (Promega, Madison, WI) protease/complex ratio of 1:50 overnight at 37 °C (in-gel digestion) and 1:100 for 3 h at 37 °C (in-solution digestion). Proteins were identified as described38 using a maXis Impact UHR-QTOF instrument (Bruker Daltonics, Billerica, MA) interfaced with a Dionex 3000 nano-uHPLC (Thermo-Fisher, Waltham, MA) followed by data analysis in Peptide Shaker.39 Protein homology models were generated by Phyre2.40
Dinitrogen, Acetylene, Proton Reduction, and H2 Inhibition of N2 Assays
Substrate reduction assays were conducted in 9.4 mL serum vials containing an assay buffer consisting of a MgATP regeneration system (6.7 mM MgCl2, 30 mM phosphocreatine, 5 mM ATP, 0.2 mg/mL creatine phosphokinase, 1.2 mg/mL BSA) and 10 mM sodium dithionite in 100 mM MOPS buffer at pH 7.0. After solutions were made anaerobic, headspace gases in the reaction vials were adjusted to desired partial pressures of relevant gaseous substrates or inhibitors (N2, C2H2, or H2) per condition indicated. Any remaining headspace was filled by argon. The FeFe or MoFe protein was then added to the vials, the vials were ventilated to atmospheric pressure, and the reactions were initiated by addition of the relevant Fe protein. FeFe and MoFe proteins were used at a 0.1 mg/mL concentration. Fe proteins were used at a saturating concentration of 30:1 molar ratio of Fe/FeFe and 20:1 molar ration of Fe/MoFe. Reactions were conducted at 30 °C for 8 min and then quenched by the addition of 300 µL of 400 mM EDTA (pH 8.0). The products (NH3, H2, and C2H4) from different substrate reduction assays were quantified according to published methods with minor modifications.41,42
Metal Content Analysis
Molybdenum and iron concentrations were determined at the Utah State University Analytics Lab on a Thermo Fisher Scientific (Waltham, MA) iCAP 6300 ICP-OES (minimum detection limit, 0.0001 µg/mL; minimum reporting limit, 0.001 µg/mL). Vanadium concentrations were determined at the Utah Veterinary Diagnostic Laboratory (UVDL, Logan, UT) using a validated protocol with argon plasma mass spectrometry (minimum detection limit, 0.0001 µg/mL; minimum reporting limit, 0.001 µg/mL). To quantify the vanadium content, analyses were performed using nitric acid digested samples. The samples were digested (1:1) in trace mineral grade nitric acid (Fisher Scientific, Pittsburgh, PA) in sealed 10 mL Oak Ridge screw-cap Teflon digestion tubes (Nalge Nunc International, Rochester, NY) on a heat block for 2 h at 90 °C. The digests were diluted 1:10 with 18.2 mOhm water in a 15 mL polypropylene trace metal free tube. This provided a 5% nitric acid matrix for analysis, which was matrix matched for all standard curve and quality control samples. Vanadium analysis was performed using an ELAN 6000 inductively coupled plasma mass spectrometer (ICP-MS) (PerkinElmer, Shelton, CT). Five-point standard curves (0.010, 0.050, 0.100, 0.250, and 0.500 µg/mL) and quality control (QC) samples were analyzed every five samples. QC analyses were considered acceptable at ±10% of the known vanadium concentration, but they were generally less than ±5%.
HD Production
Turnover samples were prepared, initiated, and terminated as described above. Paired no-turnover control samples with both proteins excluded and the liquid volume contribution from the proteins substituted with EDTA were prepared and handled identically to the turnover samples. The ratio of the partial pressures of N2 and D2 in the headspaces of a sample pair was varied as desired, with Ar filling the remaining headspace. In turnover samples, FeFe and Fe proteins were each used at a 0.4 mg/mL concentration for a Fe/FeFe molar ratio of 4:1. MoFe and Fe proteins were each used at a 0.2 mg/mL concentration for a Fe/MoFe molar ratio of 4:1.
The headspace volumes of all samples were tested with an Inficon L100 RGA for the presence of H2 and HD produced during reaction. In these experiments, a 300 µm i.d. fused silica capillary connected to the vacuum chamber on which the RGA was mounted was passed into the sample vial through a hollow needle, which had punctured the septum of the vial. Current measurements were acquired for m/z = 2 and 3, averaged over ~1 min for each vial; typical measurement traces are presented in Figure S1. For each gas mixture, multiple samples were each subjected to multiples of such independent measurements. The differences in paired turnover and no-turnover samples were converted into volume units of H2 and HD (at 1 atm, 295 K) from a calibration obtained with a set of appropriately prepared standards containing a known H2 gas volume, which was varied from 10 to 60 µL. Comparison of paired turnover and no-turnover samples allowed us to take into account an m/z = 2 background, formed from H2O and D2 and present in all vials, which varied with the tested N2/D2 mixture, as well as an m/z = 3 background caused by contamination of the D2 gas with HD. Measurements of m/z = 3 and 4 signals in no-turnover samples indicate the HD contamination as 0.15 ± 0.02%.
Statistical Analysis
Statistical significance tests (Student’s t test) were run for the variations of H2 and HD production as a function of the ratio of partial pressures of N2/D2 (Figure 7, upper and lower), using the online “t test” calculator https://www.graphpad.com/quickcalcs/ttest2/. Results are reported below in terms of the output P value, which varies between 0 and 1, and is the probability of observing a difference in the average values of two sets of measurements as large as observed in experiment, even if the two population means are identical.
Figure 7.

HD formation by Fe-nitrogenase. Volumes of produced H2 (upper) and HD (lower) (1 atm, 295 K) in the headspace of turnover sample vials as a function of the ratio of N2 and D2 partial pressures (see Materials and Methods); error bars represent standard deviations.
Data obtained for H2 production (upper plot of Figure 7) reveal P values ranging from 0.08 to 0.79 for the first four N2/D2 ratios, indicating that differences in the measured H2 production during FeFe-protein turnovers at N2/D2 ratios of 0.1/0.9, 0.3/0.7, 0.5/0.5, and 0.7/0.3 are not statistically significant. For the highest ratio, N2/D2 = 0.9/0.1, the value of P ranges between 0.0011 and 0.047 in comparison with the four lower ratios, which implies that the decrease in the H2 production induced by high pressure of N2 during FeFe-protein turnover can be considered statistically significant or even very significant. The same statistical significance test applied to HD production (lower plot of Figure 7) gave P values of 0.0011 or less when comparing the two ratios with the highest HD production measured at N2/D2 = 0.5/0.5 and 0.7/0.3, with production at both lower and higher extremes of the N2/D2 ratio, indicating the decreases in HD production at low and high N2/D2 ratios are very or even extremely statistically significant.
RESULTS
Fe-Nitrogenase Properties
Both Fe-nitrogenase component proteins were expressed in a strain of A. vinelandii (DJ1255) that contains deletions in the Mo-nitrogenase structural genes (nifDK) and the V-nitrogenase structural genes (vnfDGK), thus precluding the presence of those other nitrogenases. AnfH (Fe protein) and AnfDGK (FeFe protein) were purified using a combination of ion exchange and size exclusion chromatography to near homogeneity, as judged by the migration on SDS-PAGE with Coomassie blue staining (Figure S2). The AnfH protein appeared as one protein on SDS-PAGE at the expected molecular weight (not shown). The AnfDGK protein appeared as three proteins, corresponding in mass to the expected subunits, with approximate 1:1:1 stoichiometry from densitometry of the Coomassie stained gel (Figure S2). The identity of all component proteins (AnfHDGK) was established by performing a trypsin digest on SDS gel fragments and analyzing the peptide fragments by mass spectrometry. Proteins were identified with 100% confidence based on 88, 76, and 23 proteolytic peptides providing 76, 66, and 65% sequence coverage for AnfK, AnfD, and AnfG, respectively. AnfH was identified with 100% confidence based on 58 proteolytic fragments providing 63% sequence coverage43 (Figure S3). The minor protein below 48 kDa was identified as NifS.
The purified FeFe protein was subjected to inductively coupled optical emission and mass spectrometry to establish the metal content. Mo and V content were at or below the detection limits for the measurement (1 ppb), indicating a maximum possible Mo content of 0.07 mol Mo/mol protein and V content of 0.005 mol V/mol protein. Fe content was found to be 27.8 ± 0.9 mol Fe/mol protein. The predicted Fe content is 16 Fe from two P clusters and 16 Fe from the two FeFe-cofactors for a total of 32 mol Fe per mol protein. The measured Fe content is 87% of the predicted value and is consistent with occupancies in prior studies.9 The very low upper limits to the Mo and V content confirm that the measured substrate reduction activities are not associated with these elements.
Substrate Reduction and Inhibition
The purified Fe protein (AnfH) and FeFe protein (AnfDGK) were tested for reduction of H+, C2H2, and N2 in an assay with MgATP, creatine phosphate, and creatine phosphokinase as an ATP regenerating system. Activity was only detectable in the presence of both component proteins and MgATP. Optimal activity was seen at pH 7.0, with lower activity seen above pH 7.3. Sodium dithionite (Na2S2O4) concentrations above 2 mM did not increase activity, showing that the reactions are saturated for this reductant. Concentrations above 6 mM did not inhibit activity as has been previously reported for the FeFe protein purified from Rhodobacter capsulatas.9 The specific activity was dependent on the electron flux as determined by the molar ratio Fe protein/FeFe protein, with activity increasing with molar ratios up to 20:1 and saturating above 30:1.
The dependence of the specific activities for N2 and C2H2 reduction on their partial pressures is presented for both MoFe and FeFe in Figure 2. Fits of the data to a binding isotherm show that Fe-nitrogenase has a 4–5-fold higher apparent Km (0.56 ± 0.06 atm) for N2 than Mo-nitrogenase (0.13 ± 0.03 atm) and a 2.5-fold lower Vmax. Carrying the fits out to high PN2 shows that MoFe protein would asymptotically approach saturation for PN2 ≳ 50 atm, consistent with the experimental study carried out to 50 atm.32 Because of the higher apparent Km for FeFe protein, an equivalent approach to saturation would require a far higher value, PN2 ≳ 210 atm. For the reduction of acetylene, Fe-nitrogenase shows a 4-fold lower Vmax and a ~16-fold higher apparent Km compared to those of Mo-nitrogenase (Figure 2). Specific activities and total electron flux at PN2 = 1 atm and PC2H2 = 0.3 atm are summarized in Table 1.
Figure 2.

Specific activities for substrate reduction by Mo- and Fe-nitrogenases. Shown are the N2 partial pressure dependence of NH3 formation (left) and C2H2 on C2H4 formation (right) in Fe-nitrogenase (●) and Mo-nitrogenase (■). N2 and C2H2 apparent Km and Vmax values were determined by a fit of the data to the Michaelis–Menten equation (lines). Mo-nitrogenase: apparent Km N2 = 0.13 ± 0.03 atm, Vmax = 713 ± 19 nmol NH3 min−1 mg−1 MoFe protein, and apparent Km C2H2 = 0.009 ± 0.0005 atm, Vmax = 1876 ± 20 nmol C2H4 min−1 mg−1 MoFe protein. Fe-nitrogenase: apparent Km N2 = 0.56 ± 0.06 atm, Vmax = 286 ± 15 nmol NH3 min−1 mg−1 FeFe protein, and apparent Km C2H2 = 0.14 ± 0.01 atm, Vmax = 450 ± 18 nmol C2H4 min−1 mg−1 FeFe protein. Data are the average of two independent experiments with error bars. Assays were performed as described in Materials and Methods.
Table 1.
Specific Activities and Total Electron Flux in Mo- and Fe-Nitrogenase
| substrate | ||||||||
|---|---|---|---|---|---|---|---|---|
|
|
||||||||
| enzyme | H+ | N2a | C2H2b | |||||
|
|
|
|
|
|||||
| H2 specific activity |
total e− | H2 specific activity |
NH3 specific activity |
total e−c | H2 specific activity |
C2H4 specific activity |
total e−d | |
| nitrogenase | nmol/min/mg | nmol/min/mg | nmol/min/mg | nmol/min/mg | nmol/min/mg | nmol/min/mg | nmol/min/mg | nmol/min/mg |
| Mo | 2226 ± 35 | 4452 ± 69 | 600 ± 4 | 605 ± 9 | 3016 ± 36 | NDe | 1819 ± 20 | 3639 ± 43 |
| Fe | 1085 ± 41 | 2170 ± 83 | 599 ± 57 | 181 ± 5 | 1739 ± 128 | 484 ± 3 | 306 ± 3 | 1580 ± 13 |
1 atm N2.
0.3 atm C2H2.
Total e− is 2× nmol H2 + 3× nmol NH3.
Total e− is 2× nmol H2 + 2× nmol C2H4.
ND, not detectable.
The effect of the partial pressure of N2 and C2H2 on electron partitioning between N2 or C2H2 reduction and proton reduction to make H2 was examined (Figures 3 and 4). For Mo-nitrogenase, increasing PN2 rapidly inhibits H+ reduction, with ~70% inhibition at 1 atm N2. At this value of PN2, the ratio of H2 formed to N2 reduced is the product ratio H2/(NH3/2) ~ 2, about twice the limiting value of unity that is found at 50 atm and is associated with eq 1. For Fe-nitrogenase, the H2 production in the absence of N2 is about half that of Mo-nitrogenase and N2 is about half as effective as an inhibitor of H2 formation, decreasing it by ~40% at PN2 = 1 atm (Figure 3 and Table 1). However, because Fe-nitrogenase is significantly less active in reducing N2, at PN2 = 1 atm the ratio of H2 formed per N2 reduced is given by the product ratio, H2/N2 ~ 7, close to that reported previously and more than triple the value for Mo-nitrogenase at this N2 pressure.
Figure 3.

Effect of increasing partial pressure of N2 (PN2) on N2 (●) and H+ (■) reduction in Mo-nitrogenase (top) and Fe-nitrogenase (bottom). Data points are connected with a solid line as a guide. Data are the average of two independent experiments with error bars. Assays were performed as described in Materials and Methods.
Figure 4.

Effect of increasing partial pressure of acetylene (PC2H2) on acetylene (●) and H+ (■) reduction in Mo-nitrogenase (top) and Fe-nitrogenase (bottom). Data points are connected with a solid line as a guide. Data are the average of two independent experiments with error bars. Assays were performed as described in Materials and Methods.
C2H2 is a good substrate and potent inhibitor of H+ reduction in MoFe, essentially quenching all H2 production by PC2H2 ~ 0.2 atm (Figure 4). In the case of FeFe protein, the inhibition is far weaker, with H2 formation decreased by only about a factor of 2 at PC2H2 = 0.3 atm, at which pressure more H2 is still formed than C2H4 (Figure 4).
H2 Inhibition of N2 Reduction
The ability of H2 to inhibit N2 reduction was examined. For Mo-nitrogenase, when N2 is held at 0.2 atm, increasing H2 up to 0.8 atm suppresses of N2 reduction by up to 70% compared to the no-H2 condition. For Fe-nitrogenase, even though the activity is half that of MoFe in the absence of added H2, a similar trend is observed. At 0.6 atm N2, addition of H2 up to 0.4 atm shows approximately 60% inhibition of N2 reduction (Figure 5).
Figure 5.

H2 inhibition of N2 reduction. Shown is the specific activity for N2 reduction as a function of the partial pressure of H2 for Mo-nitrogenase (A) and Fe-nitrogenase (B). Data are the average of two independent experiments with error bars. Assays were performed as described in Materials in Methods. For Mo-nitrogenase, N2 was held at 0.2 atm and H2 was varied. For Fe-nitrogenase, N2 was held at 0.6 atm and H2 was varied.
HD Formation
D2 does not interact with nitrogenase in the absence of N2. As a result, the most dramatic manifestation of the re/oa mechanism in Mo-nitrogenase is seen during reduction of N2 in the presence of D2. Under these conditions, D2 does react, being stoichiometrically reduced to form 2HD formed per D2 according to eq 2
| (2) |
This phenomenon is explained as arising through the oa of D2 with release of N2 and formation of two solvent nonexchangeable, bridging deuterides, [Fe–D–Fe], and then the sequential protonation of these D− by H+ from solvent (Figure 6).
Figure 6.

HD formation by nitrogenase. Shown is one FeS face of FeMo-cofactor with a reversible re/oa equilibrium for N2 or D2 binding. The pathway to the left leads to the formation of 2 equiv of HD. The deutrides (green) are not solvent exchangeable, whereas the protons (red) are solvent exchangeable.
To test for HD formation by Fe-nitrogenase, the enzyme was turned over under a range of partial pressures of N2 and D2, and the production of H2 and HD was monitored by mass spectrometry. The volumes of H2 produced, as measured in the headspace of the reaction vials, do not vary significantly up to a ratio of partial pressures N2/D2 = 0.7/0.3 (Figure 7, top). Upon further increase of this ratio, to a N2/D2 = 0.9/0.1 gas mixture, the volume of H2 produced may begin to decrease, as might be expected from an increase in the proportion of the turnover electron flux going to N2 reduction, leaving less for H2 formation. However, the small magnitude of this effect, even at the N2/D2 = 0.9/0.1 pressure ratio, is consistent with literature reports and with our results for N2 reduction presented above.
In testing for HD formation during N2 reduction, it is important to note that HD is present in all samples, including no-turnover samples, because of HD contamination in the D2 gas (Table S1). However, every FeFe protein turnover sample contained more HD than its paired no-turnover sample. This establishes that HD is produced by Fe-nitrogenase during N2 turnover in the presence of D2, an observation that by itself requires that Fe-nitrogenase carries out nitrogen fixation by the same re/oa mechanism as has been established for Mo-nitrogenase (Figure 6).
The amount of HD produced under various assay conditions was determined by subtraction of the HD background measured in the corresponding no-turnover samples. Figure 7, bottom, shows that the amount of HD produced during Fe-nitrogenase turnover exhibits a strong dependence on the ratio of the pressures of N2 and D2 during reaction: The HD volume maximizes at ratios N2/D2 ~ 1–2 (0.5/0.5 and 0.7/0.3 atm) and is significantly lower at both higher and lower tested ratios, as revealed by statistical tests described in Materials and Methods. During turnover by Fe-nitrogenase and Mo-nitrogenase at the same Fe protein to MoFe protein/FeFe protein ratio, Fe-nitrogenase produces its maximum amount of HD, ~6 µL per 0.4 mg FeFe protein, at the ratio N2/D2 ≈ 0.7/0.3 ≈ 2.3, whereas the HD maximum of Mo-nitrogenase occurs at a ratio less than unity, N2/D2 ≈ 0.2/0.6 ≈ 0.33, where it produces roughly ~12-fold more HD per mol of protein, ~35 µL per 0.2 mg MoFe protein (Figure S4).
This dependence of HD formation by Fe-nitrogenase on the N2/D2 ratio (Figure 7, bottom) is explained by and reveals details of the re/oa mechanism. HD formation maximizes when the ratio of partial pressures is such that the N2 partial pressure is high enough that the re/oa equilibrium significantly populates E4(2N2H), N2/D2 ~ 1–2, but at the same time the partial pressure of D2 is sufficiently high that D2 can effectively react with this state through oa with the release of N2 and formation of the HD-producing E4(2H,2D) state (Figure 6). As the N2 partial pressure is increased and D2 decreased (e.g., N2/D2 = 0.9/0.1), the population of the E4(2N2H) state increases, but because the partial pressure of D2 is now small, so is the extent of D2 oa by the E4(2N2H) state to form the HD-producing dideuteride intermediate, E4(2H,2D), and so HD production decreases.
At the other extreme of the N2/D2 ratio, when N2 concentration is low and D2 is high (e.g., N2/D2 = 0.1/0.9), the population of E4(2N2H) is low, which precludes substantial oa of D2 by E4(2N2H) to form the E4(2H,2D) state, despite the high D2 partial pressure, and so HD production is low.
DISCUSSION
N2 Reduction without Mo
The discovery of Mo-dependent nitrogenase was followed by the synthesis of mononuclear Mo-complexes that bound, activated, and ultimately reduced N2.44,45 Combined, these findings led to the assumption that Mo was necessary for N2 reduction in nitrogenase. This assumption was later challenged by the demonstration of N2 fixation by bacterial strains with deletions of the Mo-nitrogenase genes and cells grown in Mo-deficient media.46–48 However, doubts about Mo-independent N2 reduction remained until purified V- and Fe-nitrogenase24,26,49–51 systems with very little Mo content were shown to be capable of N2 fixation, solidifying that Mo was not essential for N2 reduction in nitrogenase. As reported here, highly purified FeFe protein from A. vinelandii has Mo and V below the detection limit of our plasma emission method, placing the Mo and V content below 0.07 mol Mo or 0.005 mol V/mol FeFe protein. We find that the FeFe protein has an N2 reduction specific activity of 181 nmol NH3/min/mg FeFe protein compared to a value of 605 nmol NH3/min/mg MoFe protein. The 3-fold lower N2 reduction activity for the FeFe protein compared to the MoFe protein contrasts with the greater than 28-fold difference in Mo or V content (2 Mo per MoFe protein versus <0.07 Mo or <0.005 V per FeFe protein). Combined with the earlier work, these results clearly indicate that Mo and V are not required for nitrogenase N2 reduction.
This conclusion is in line with other evidence pointing to the FeS portion of the nitrogenase active site providing the location of hydride accumulation and N2 activation.13 First, amino acid substitution studies near FeMo-cofactor pointed to one FeS face, the one that includes Fe atoms 2, 3, 6, 7 (numbering from the X-ray structure), as the site of N2 binding.42,52 Second, 95Mo ENDOR showed that Mo is not an “anchoring” atom of the two metal-bridging hydrides of E4(4H), which thus have the form [Fe–H–Fe].53 Further, ENDOR/ESEEM spectroscopic studies of a catalytic intermediate of N2 reduction by the MoFe protein enriched with 95Mo showed no evidence for substrate binding or for oxidation state changes of the Mo.13,19 The findings certainly implicate the FeS portion of the active site metal cluster in substrate reduction, but they do not exclude the involvement of Mo in some as yet untrapped state. In support of the reactivity of the Fe portion of FeMo-co are a number of recent studies on Fe-complexes that have been shown to activate and reduce N2.54,55 Taken together, these observations demonstrate that N2 reduction can occur at Fe-based metal clusters, both outside and within nitrogenase proteins, and that many, if not all, of the stages of N2 reduction by nitrogenase occur at Fe.
N2 Reduction Mechanism
N2 reduction by Mo-nitrogenase can be understood in terms of a reductive elimination mechanism whereby two bridging hydrides bound to Fe atoms of the E4 state of FeMo-cofactor combine to generate H2 and a doubly reduced FeMo-cofactor that is primed for N2 binding and activation.13 This mechanism explicitly incorporates, as a limiting stoichiometry of reaction, that eight electrons and protons are required and one H2 is produced for each N2 reduced, consistent with experiments at PN2 = 50 atm.32 However, the reaction stoichiometry observed for the Fe-nitrogenase, both in earlier work9 and as reported here, clearly show that even at PN2 = 1 atm, Fe-nitrogenase makes much more H2 than Mo-nitrogenase, and the ratio of product formation is H2/N2 ~ 6–7, raising the question: does Fe-nitrogenase follow the same reductive elimination mechanism for N2 activation?
This question is answered by an analysis of two properties of N2 reduction catalyzed by nitrogenase: (i) the ability of H2 to inhibit N2 reduction and (ii) the ability of nitrogenase to catalyze the formation of HD when run under N2 and D2. H2 inhibition of N2 reduction by nitrogenase was reported in some of the earliest kinetic studies of nitrogenase.56 This inhibition can be understood in terms of the reversibility of the N2 binding/H2 release step in the reductive elimination/oxidative addition mechanism (Figure 1C). Excess H2 reverses the E4 re/oa equilibrium to the left, in effect introducing a nonproductive reaction pathway, lowering the occupancy of the N2 bound state and net N2 reduction activity, and enhancing the return to the resting state with loss of two H2. This re/oa equilibrium has been validated by spectroscopic quantification of trapped states under different N2 and H2 concentrations.16–18 As can be seen in Figure 5, Fe-nitrogenase shows a similar pattern of H2 inhibition of N2 reduction to that observed in Mo-nitrogenase, although at different concentrations of N2 and H2. This parallelism in H2 inhibition of N2 reduction between the two nitrogenases suggests that they share a similar mechanism (Figure 1C).
The formation of HD when nitrogenase is turned over under a mixture of N2 and D2 is, however, the definitive test for a reversible re/oa mechanism at E4 in nitrogenase.20 No explanation had been offered for the fact that whereas Mo-nitrogenase does not react with H2/D2 at all in the absence of N2, the enzyme nonetheless acts as catalyst for the stoichiometric reduction of D2 to 2HD, with N2 as a cocatalyst, eq 2, until it was recognized that the re/oa equilibrium explains this reaction as shown in Figure 6.13 The present experiments clearly show that, as is observed for Mo-nitrogenase, Fe-nitrogenase likewise catalyzes the reduction of D2 to HD dependent on the presence of N2 (Figure 7). Thus, based on the observations of H2 inhibition and HD formation, the conclusion is inescapable that both Mo- and Fe-nitrogenase utilize a similar re/oa mechanism for N2 reduction.
Measurements presented above offer an explanation for why the observed product ratio, H2-formed/N2-reduced, at PN2 = 1 atm is so much greater for Fe-nitrogenase than for Mo nitrogenase: H2/N2 ~7 versus ~2. The activity measurements actually show that Fe-nitrogenase is 2-fold less active at proton reduction in the absence of N2 than Mo-nitrogenase (e.g., Fe-nitrogenase has an overall lower electron flux). They also show that Fe-nitrogenase has a rather similarly decreased effectiveness for N2 reduction, having a Vmax for N2 reduction ~2.5-fold smaller than that for Mo-nitrogenase. Thus, the replacement of Fe for Mo and the different protein environments of the two proteins decrease the effectiveness of both H+ reduction to H2 and of N2 reduction by roughly similar amounts in Fe-nitrogenase, and therefore these changes cannot account for the high value of the H2/N2 ratio for Fe-nitrogenase. Instead, the significant difference between the two enzymes is that they differ sharply in the Km for N2, which is 5-fold higher for Fe-nitrogenase than for Mo-nitrogenase. In short, it appears that the greater production of H2 by Fe-nitrogenase under 1 atm of N2 is largely because the N2 pressures used to date (1 atm or less) are insufficient for N2 reduction to suppress/outcompete hydride protonation to form H2.
The differences between the reactivity at FeMo-co and FeFe-co surely reflect the presence of Mo versus Fe, but it can be influenced by the differences in the protein surrounding each cofactor. A homology model for the protein environment predicted around FeFe-co has been reported, showing many similarities to the MoFe protein environment around FeMo-co, as well as some key alterations in amino acids.30 Analysis of the influence of these protein changes on reactivity will require additional experimental and theoretical studies. Given the recent observation of carbonate instead of a sulfur in the VFe-cofactor,15 it is possible that such a variation in ligands may also be found in the FeFe-cofactor, influencing reactivity. Deducing the relative roles of these factors in controlling the reactivity of Mo- and Fe-nitrogenase will provide valuable insights into how these enzymes meet the challenge of N2 reduction, but ultimately, as shown here, they both utilize the same fundamental mechanism for N2 binding and activation.
Supplementary Material
Acknowledgments
The authors thank Carrie Harwood, Katie Fixen, and Yanning Zheng for discussions on Fe only nitrogenase.
Funding
Support for the cell growth, protein purification, and kinetic analysis was provided by the U.S. Department of Energy, Office of Science, Basic Energy Sciences (BES) under awards to L.C.S. and D.R.D. (DE-SC0010687 and DE-SC0010834). Support for HD exchange measurements was provided by a grant from the National Institutes of Health to B.M.H. (GM111097). Protein mass spectrometry work was done as part of the Biological Electron Transfer and Catalysis (BETCy) Energy Frontiers Research Center (EFRC) supported by the Department of Energy (DE-SC0012518). The Mass Spectrometry Facility at MSU is supported in part by the Murdock Charitable Trust and an NIH IDEA program grant P20GM103474.
Footnotes
ASSOCIATED CONTENT
- Examples of m/z = 2 and 3 signals for FeFe samples prepared at N2/D2 = 0.5/0.5 and 0.9/0.1; Coomassie stained SDS-PAGE gel of purified FeFe protein along with densitometry data; dependence of HD contamination in “no-turnover” samples on PD2; protein identification within Fe-nitrogenase complex purified from A. vinelandii; comparison of HD production by MoFe and FeFe nitrogenases at their optimal assay conditions (PDF)
The authors declare no competing financial interest.
References
- 1.Raymond J, Siefert JL, Staples CR, Blankenship RE. The natural history of nitrogen fixation. Mol. Biol. Evol. 2004;21:541–554. doi: 10.1093/molbev/msh047. [DOI] [PubMed] [Google Scholar]
- 2.Burris RH, Roberts GP. Biological nitrogen fixation. Annu. Rev. Nutr. 1993;13:317–35. doi: 10.1146/annurev.nu.13.070193.001533. [DOI] [PubMed] [Google Scholar]
- 3.Gruber N, Galloway JN. An Earth-system perspective of the global nitrogen cycle. Nature. 2008;451:293–296. doi: 10.1038/nature06592. [DOI] [PubMed] [Google Scholar]
- 4.Eady RR. Structure-function relationships of alternative nitrogenases. Chem. Rev. 1996;96:3013–3030. doi: 10.1021/cr950057h. [DOI] [PubMed] [Google Scholar]
- 5.Burgess BK, Lowe DJ. Mechanism of molybdenum nitrogenase. Chem. Rev. 1996;96:2983–3012. doi: 10.1021/cr950055x. [DOI] [PubMed] [Google Scholar]
- 6.Hu Y, Lee CC, Ribbe MW. Vanadium nitrogenase: A two-hit wonder? Dalton Trans. 2012;41:1118–1127. doi: 10.1039/c1dt11535a. [DOI] [PMC free article] [PubMed] [Google Scholar]
- 7.Robson R, Woodley P, Jones R. Second gene (nifH*) coding for a nitrogenase iron protein in Azotobacter chroococcum is adjacent to a gene coding for a ferredoxin-like protein. EMBO J. 1986;5:1159–1163. doi: 10.1002/j.1460-2075.1986.tb04341.x. [DOI] [PMC free article] [PubMed] [Google Scholar]
- 8.Joerger RD, Jacobson MR, Premakumar R, Wolfinger ED, Bishop PE. Nucleotide sequence and mutational analysis of the structural genes (anfHDGK) for the second alternative nitrogenase from Azotobacter vinelandii. J. Bacteriol. 1989;171:1075–1086. doi: 10.1128/jb.171.2.1075-1086.1989. [DOI] [PMC free article] [PubMed] [Google Scholar]
- 9.Schneider K, Müller A. Catalysts for Nitrogen Fixation. Springer; Dordrecht: 2004. Iron-only nitrogenase: Exceptional catalytic, structural and spectroscopic features; pp. 281–307. [Google Scholar]
- 10.Fay AW, Blank MA, Lee CC, Hu Y, Hodgson KO, Hedman B, Ribbe MW. Characterization of isolated nitrogenase FeVco. J. Am. Chem. Soc. 2010;132:12612–12618. doi: 10.1021/ja1019657. [DOI] [PMC free article] [PubMed] [Google Scholar]
- 11.Krahn E, Weiss B, Kröckel M, Groppe J, Henkel G, Cramer S, Trautwein A, Schneider K, Müller A. The Fe-only nitrogenase from Rhodobacter capsulatus: identification of the cofactor, an unusual, high-nuclearity iron-sulfur cluster, by Fe K-edge EXAFS and 57Fe Mössbauer spectroscopy. JBIC, J. Biol. Inorg. Chem. 2002;7:37–45. doi: 10.1007/s007750100263. [DOI] [PubMed] [Google Scholar]
- 12.Hales BJ. Alternative nitrogenase. Adv. Inorg. Biochem. 1990;8:165–198. [PubMed] [Google Scholar]
- 13.Hoffman BM, Lukoyanov D, Yang Z-Y, Dean DR, Seefeldt LC. Mechanism of nitrogen fixation by nitrogenase: The next stage. Chem. Rev. 2014;114:4041–4062. doi: 10.1021/cr400641x. [DOI] [PMC free article] [PubMed] [Google Scholar]
- 14.Howard JB, Rees DC. How many metals does it take to fix N2? A mechanistic overview of biological nitrogen fixation. Proc. Natl. Acad. Sci. U. S. A. 2006;103:17088–17093. doi: 10.1073/pnas.0603978103. [DOI] [PMC free article] [PubMed] [Google Scholar]
- 15.Sippel D, Einsle O. The structure of vanadium nitrogenase reveals an unusual bridging ligand. Nat. Chem. Biol. 2017;13:956–960. doi: 10.1038/nchembio.2428. [DOI] [PMC free article] [PubMed] [Google Scholar]
- 16.Lukoyanov D, Khadka N, Yang Z-Y, Dean DR, Seefeldt LC, Hoffman BM. Reversible photoinduced reductive elimination of H2 from the nitrogenase dihydride state, the E4(4H) Janus intermediate. J. Am. Chem. Soc. 2016;138:1320–1327. doi: 10.1021/jacs.5b11650. [DOI] [PMC free article] [PubMed] [Google Scholar]
- 17.Lukoyanov D, Khadka N, Yang Z-Y, Dean DR, Seefeldt LC, Hoffman BM. Reductive elimination of H2 activates nitrogenase to reduce the N≡N triple bond: characterization of the E4(4H) Janus intermediate in wild-type enzyme. J. Am. Chem. Soc. 2016;138:10674–10683. doi: 10.1021/jacs.6b06362. [DOI] [PMC free article] [PubMed] [Google Scholar]
- 18.Lukoyanov D, Yang Z-Y, Khadka N, Dean DR, Seefeldt LC, Hoffman BM. Identification of a key catalytic intermediate demonstrates that nitrogenase is activated by the reversible exchange of N2 for H2. J. Am. Chem. Soc. 2015;137:3610–3615. doi: 10.1021/jacs.5b00103. [DOI] [PMC free article] [PubMed] [Google Scholar]
- 19.Lukoyanov D, Yang Z-Y, Barney BM, Dean DR, Seefeldt LC, Hoffman BM. Unification of reaction pathway and kinetic scheme for N2 reduction catalyzed by nitrogenase. Proc. Natl. Acad. Sci. U. S. A. 2012;109:5583–5587. doi: 10.1073/pnas.1202197109. [DOI] [PMC free article] [PubMed] [Google Scholar]
- 20.Burgess BK, Wherland S, Newton WE, Stiefel EI. Nitrogenase reactivity: insight into the nitrogen-fixing process through hydrogen-inhibition and HD-forming reactions. Biochemistry. 1981;20:5140–5146. doi: 10.1021/bi00521a007. [DOI] [PubMed] [Google Scholar]
- 21.Guth JH, Burris RH. Inhibition of nitrogenase-catalyzed ammonia formation by hydrogen. Biochemistry. 1983;22:5111–5122. doi: 10.1021/bi00291a010. [DOI] [PubMed] [Google Scholar]
- 22.Lee CC, Hu Y, Ribbe MW. Unique features of the nitrogenase VFe protein from Azotobacter vinelandii. Proc. Natl. Acad. Sci. U. S. A. 2009;106:9209–9214. doi: 10.1073/pnas.0904408106. [DOI] [PMC free article] [PubMed] [Google Scholar]
- 23.Pau RN, Eldridge ME, Lowe DJ, Mitchenall LA, Eady RR. Molybdenum-independent nitrogenases of Azotobacter vinelandii: a functional species of alternative nitrogenase-3 isolated from a molybdenum-tolerant strain contains an iron-molybdenum cofactor. Biochem. J. 1993;293:101–107. doi: 10.1042/bj2930101. [DOI] [PMC free article] [PubMed] [Google Scholar]
- 24.Chisnell JR, Premakumar R, Bishop PE. Purification of a second alternative nitrogenase from a nifHDK deletion strain of Azotobacter vinelandii. J. Bacteriol. 1988;170:27–33. doi: 10.1128/jb.170.1.27-33.1988. [DOI] [PMC free article] [PubMed] [Google Scholar]
- 25.Schneider K, Gollan U, Dröttboom M, Selsemeier-Voigt S, Müller A. Comparative biochemical characterization of the iron-only nitrogenase and the molybdenum nitrogenase from Rhodobacter capsulatus. Eur. J. Biochem. 1997;244:789–800. doi: 10.1111/j.1432-1033.1997.t01-1-00789.x. [DOI] [PubMed] [Google Scholar]
- 26.Schneider K, Müller A, Schramm U, Klipp W. Demonstration of a molybdenum-and vanadium-independent nitrogenase in a nifHDK-deletion mutant of Rhodobacter capsulatus. Eur. J. Biochem. 1991;195:653–661. doi: 10.1111/j.1432-1033.1991.tb15750.x. [DOI] [PubMed] [Google Scholar]
- 27.Müller A, Schneider K, Knüttel K, Hagen WR. EPR spectroscopic characterization of an ‘iron only nitrogenase S= 3/2 spectrum of component 1 isolated from Rhodobacter capsulatus. FEBS Lett. 1992;303:36–40. doi: 10.1016/0014-5793(92)80472-s. [DOI] [PubMed] [Google Scholar]
- 28.Davis R, Lehman L, Petrovich R, Shah VK, Roberts GP, Ludden PW. Purification and characterization of the alternative nitrogenase from the photosynthetic bacterium Rhodospirillum rubrum. J. Bacteriol. 1996;178:1445–1450. doi: 10.1128/jb.178.5.1445-1450.1996. [DOI] [PMC free article] [PubMed] [Google Scholar]
- 29.Schüddekopf K, Hennecke S, Liese U, Kutsche M, Klipp W. Characterization of anf genes specific for the alternative nitrogenase and identification of nif genes required for both nitrogenases in Rhodobacter capsulatus. Mol. Microbiol. 1993;8:673–684. doi: 10.1111/j.1365-2958.1993.tb01611.x. [DOI] [PubMed] [Google Scholar]
- 30.Mcglynn SE, Boyd ES, Peters JW, Orphan VJ. Classifying the metal dependence of uncharacterized nitrogenases. Front. Microbiol. 2013;3:419. doi: 10.3389/fmicb.2012.00419. [DOI] [PMC free article] [PubMed] [Google Scholar]
- 31.Thorneley RNF, Lowe DJ. Kinetics and mechanism of the nitrogenase enzyme. In: Spiro TG, editor. Molybdenum Enzymes. Wiley-Interscience Publications; New York: 1985. pp. 221–284. [Google Scholar]
- 32.Simpson FB, Burris RH. A nitrogen pressure of 50 atm does not prevent evolution of hydrogen by nitrogenase. Science. 1984;224:1095–1097. doi: 10.1126/science.6585956. [DOI] [PubMed] [Google Scholar]
- 33.Robinson AC, Burgess BK, Dean DR. Activity, reconstitution, and accumulation of nitrogenase components in Azotobacter vinelandii mutant strains containing defined deletions within the nitrogenase structural gene cluster. J. Bacteriol. 1986;166:180–186. doi: 10.1128/jb.166.1.180-186.1986. [DOI] [PMC free article] [PubMed] [Google Scholar]
- 34.Toukdarian A, Kennedy C. Regulation of nitrogen metabolism in Azotobacter vinelandii: isolation of ntr and glnA genes and construction of ntr mutants. EMBO J. 1986;5:399–407. doi: 10.1002/j.1460-2075.1986.tb04225.x. [DOI] [PMC free article] [PubMed] [Google Scholar]
- 35.Christiansen J, Goodwin PJ, Lanzilotta WN, Seefeldt LC, Dean DR. Catalytic and biophysical properties of a nitrogenase apo-MoFe protein produced by an nifB-deletion mutant of Azotobacter vinelandii. Biochemistry. 1998;37:12611–12623. doi: 10.1021/bi981165b. [DOI] [PubMed] [Google Scholar]
- 36.Burgess BK, Jacobs DB, Stiefel EI. Large-scale purification of high activity Azotobacter vinelandii nitrogenase. Biochim. Biophys. Acta. 1980;614:196–209. doi: 10.1016/0005-2744(80)90180-1. [DOI] [PubMed] [Google Scholar]
- 37.Peters JW, Fisher K, Dean DR. Identification of a nitrogenase protein-protein interaction site defined by residues 59 through 67 within the Azotobacter vinelandii Fe protein. J. Biol. Chem. 1994;269:28076–28083. [PubMed] [Google Scholar]
- 38.Yang Z-Y, Ledbetter R, Shaw S, Pence N, Tokmina-Lukaszewska M, Eilers B, Guo Q, Pokhrel N, Cash VL, Dean DR, Antony E, Bothner B, Peters JW, Seefeldt LC. Evidence that the Pi release event is the rate-limiting step in the nitrogenase catalytic cycle. Biochemistry. 2016;55:3625–3635. doi: 10.1021/acs.biochem.6b00421. [DOI] [PubMed] [Google Scholar]
- 39.Vaudel M, Burkhart JM, Zahedi RP, Oveland E, Berven FS, Sickmann A, Martens L, Barsnes H. PeptideShaker enables reanalysis of MS-derived proteomics data sets. Nat. Biotechnol. 2015;33:22–24. doi: 10.1038/nbt.3109. [DOI] [PubMed] [Google Scholar]
- 40.Kelley LA, Mezulis S, Yates CM, Wass MN, Sternberg MJE. The Phyre2 web portal for protein modeling, prediction and analysis. Nat. Protoc. 2015;10:845–858. doi: 10.1038/nprot.2015.053. [DOI] [PMC free article] [PubMed] [Google Scholar]
- 41.Corbin JL. Liquid chromatographic-fluorescence determination of ammonia from nitrogenase reactions: A 2-min assay. Appl. Environ. Microbiol. 1984;47:1027–1030. doi: 10.1128/aem.47.5.1027-1030.1984. [DOI] [PMC free article] [PubMed] [Google Scholar]
- 42.Barney BM, Igarashi RY, Dos Santos PC, Dean DR, Seefeldt LC. Substrate interaction at an iron-sulfur face of the FeMo-cofactor during nitrogenase catalysis. J. Biol. Chem. 2004;279:53621–53624. doi: 10.1074/jbc.M410247200. [DOI] [PubMed] [Google Scholar]
- 43.Setubal JC, dos Santos P, Goldman BS, Ertesvåg H, Espin G, Rubio LM, Valla S, Almeida NF, Balasubramanian D, Cromes L, Curatti L, Du Z, Godsy E, Goodner B, Hellner-Burris K, Hernandez JA, Houmiel K, Imperial J, Kennedy C, Larson TJ, Latreille P, Ligon LS, Lu J, Mærk M, Miller NM, Norton S, O’Carroll IP, Paulsen I, Raulfs EC, Roemer R, Rosser J, Segura D, Slater S, Stricklin SL, Studholme DJ, Sun J, Viana CJ, Wallin E, Wang B, Wheeler C, Zhu H, Dean DR, Dixon R, Wood D. Genome sequence of Azotobacter vinelandii an obligate aerobe specialized to support diverse anaerobic metabolic processes. J. Bacteriol. 2009;191:4534–4545. doi: 10.1128/JB.00504-09. [DOI] [PMC free article] [PubMed] [Google Scholar]
- 44.Yandulov DV, Schrock RR. Catalytic reduction of dinitrogen to ammonia at a single molybdenum center. Science. 2003;301:76–78. doi: 10.1126/science.1085326. [DOI] [PubMed] [Google Scholar]
- 45.Pickett CJ. The Chatt cycle and the mechanism of enzymic reduction of molecular nitrogen. JBIC. J. Biol. Inorg. Chem. 1996;1:601–606. [Google Scholar]
- 46.Bishop PE, Jarlenski DM, Hetherington DR. Evidence for an alternative nitrogen fixation system in Azotobacter vinelandii. Proc. Natl. Acad. Sci. U. S. A. 1980;77:7342–7346. doi: 10.1073/pnas.77.12.7342. [DOI] [PMC free article] [PubMed] [Google Scholar]
- 47.Bishop PE, Premakumar R, Dean DR, Jacobson MR, Chisnell JR, Rizzo TM, Kopczynski J. Nitrogen fixation by Azotobacter vinelandii strains having deletions in structural genes for nitrogenase. Science. 1986;232:92–94. doi: 10.1126/science.232.4746.92. [DOI] [PubMed] [Google Scholar]
- 48.Bishop PE, Hawkins ME, Eady RR. Nitrogen fixation in molybdenum-deficient continuous culture by a strain of Azotobacter vinelandii carrying a deletion of the structural genes for nitrogenase (nifHDK) Biochem. J. 1986;238:437–442. doi: 10.1042/bj2380437. [DOI] [PMC free article] [PubMed] [Google Scholar]
- 49.Eady RR, Robson RL, Richardson TH, Miller RW, Hawkins M. The vanadium nitrogenase of Azotobacter chroococcum Purification and properties of the VFe protein. Biochem. J. 1987;244:197–207. doi: 10.1042/bj2440197. [DOI] [PMC free article] [PubMed] [Google Scholar]
- 50.Hales BJ, Case EE, Morningstar JE, Dzeda MF, Mauterer LA. Isolation of a new vanadium-containing nitrogenase from Azotobacter vinelandii. Biochemistry. 1986;25:7251–7255. doi: 10.1021/bi00371a001. [DOI] [PubMed] [Google Scholar]
- 51.Müller A, Schneider K, Gollan U, Krahn E, Dröttboom M. Characterization of the “iron only” nitrogenase from Rhodobacter capsulatus. J. Inorg. Biochem. 1995;59:551–551. doi: 10.1111/j.1432-1033.1997.t01-1-00789.x. [DOI] [PubMed] [Google Scholar]
- 52.Dos Santos PC, Igarashi RY, Lee H-I, Hoffman BM, Seefeldt LC, Dean DR. Substrate interactions with the nitrogenase active site. Acc. Chem. Res. 2005;38:208–214. doi: 10.1021/ar040050z. [DOI] [PubMed] [Google Scholar]
- 53.Lukoyanov D, Yang Z-Y, Dean DR, Seefeldt LC, Hoffman BM. Is Mo involved in hydride binding by the four-electron reduced (E4) intermediate of the nitrogenase MoFe protein? J. Am. Chem. Soc. 2010;132:2526–2527. doi: 10.1021/ja910613m. [DOI] [PMC free article] [PubMed] [Google Scholar]
- 54.Čorić I, Mercado BQ, Bill E, Vinyard DJ, Holland PL. Binding of dinitrogen to an iron-sulfur-carbon site. Nature. 2015;526:96–99. doi: 10.1038/nature15246. [DOI] [PMC free article] [PubMed] [Google Scholar]
- 55.Anderson JS, Rittle J, Peters JC. Catalytic conversion of nitrogen to ammonia by an iron model complex. Nature. 2013;501:84–87. doi: 10.1038/nature12435. [DOI] [PMC free article] [PubMed] [Google Scholar]
- 56.Rivera-Ortiz JM, Burris RH. Interactions among substrates and inhibitors of nitrogenase. J. Bacteriol. 1975;123:537–545. doi: 10.1128/jb.123.2.537-545.1975. [DOI] [PMC free article] [PubMed] [Google Scholar]
Associated Data
This section collects any data citations, data availability statements, or supplementary materials included in this article.