

Abstract
Background
Epidemiological studies have inconsistently linked transportation noise and air pollution (AP) with diabetes risk. Most studies have considered single noise sources and/or AP, but none has investigated their mutually independent contributions to diabetes risk.
Methods
We investigated 2631 participants of the Swiss Cohort Study on Air Pollution and Lung and Heart Diseases in Adults (SAPALDIA), without diabetes in 2002 and without change of residence between 2002 and 2011. Using questionnaire and biomarker data, incident diabetes cases were identified in 2011. Noise and AP exposures in 2001 were assigned to participants’ residences (annual average road, railway or aircraft noise level during day-evening-night (Lden), total night number of noise events, intermittency ratio (temporal variation as proportion of event-based noise level over total noise level) and nitrogen dioxide (NO2) levels. We applied mixed Poisson regression to estimate the relative risk (RR) of diabetes and their 95% confidence intervals (CI) in mutually-adjusted models.
Results
Diabetes incidence was 4.2%. Median [interquartile range (IQR)] road, railway, aircraft noise and NO2 were 54 (10) dB, 32 (11) dB, 30 (12) dB and 21 (15) μg/m3, respectively. Lden road and aircraft were associated with incident diabetes (respective RR: 1.35; 95% CI: 1.02–1.78 and 1.86; 95% CI: 0.96–3.59 per IQR) independently of Lden railway and NO2 (which were not associated with diabetes risk) in mutually adjusted models. We observed stronger effects of Lden road among participants reporting poor sleep quality or sleeping with open windows.
Conclusions
Transportation noise may be more relevant than AP in the development of diabetes, potentially acting through noise-induced sleep disturbances.
Keywords: Noise, transportation, air pollution, diabetes mellitus, sleep
Key Messages
This study examines the mutually independent association between transportation noise and air pollution, and incidence of diabetes in 2631 Swiss adults.
Road traffic and aircraft noise were independently associated with diabetes risk.
Individuals who slept with open windows or had poor sleep quality were more susceptible to road traffic noise.
Neither railway noise nor NO2 was associated with diabetes risk in this study.
The findings imply a potentially more relevant role for transportation noise than air pollution in the development of diabetes.
Introduction
Transportation noise and air pollution (AP) constitute common exposures contributing to global morbidity and mortality.1,2 Transportation noise sources commonly include road traffic, aircraft and railways, whereas nitrogen dioxide (NO2) and particulate matter < 2.5 um in diameter (PM2.5) are common markers of traffic-related AP.3 Both pollutant groups have been linked to cardio-metabolic phenotypes including cardiovascular diseases,3–5 obesity,6,7 insulin resistance or diabetes.8–10 Whereas AP has been shown by experimental11,12 and epidemiological studies13–15 to induce inflammation, leading to systemic reactions that may result in insulin resistance, noise could be stress-inducing due to catecholamine dysregulation16–18 and impact on glucose homeostasis through insulin resistance.19 Noise also induces sleep disturbances,20,21 which was linked to glucose dysregulation.22
Epidemiological evidence linking these exposures with diabetes has been mixed. Studies have shown traffic-related AP to be inconsistently associated with diabetes risk.23–31 Compared with AP, epidemiological evidence on the impact of transportation noise on diabetes risk is sparse. Exposure to road traffic noise,32,33 and aircraft noise34 but not railway noise32 increased diabetes risk. Reported road traffic intensity was also associated with incident diabetes.35
Transportation noise and AP may occur together, may confound each other36,37and might share pathological effect pathways.17,18 Given the need for efficient intervention strategies, it is important to better understand their respective effects on population health. Research exploring the mutually independent associations of road traffic noise and AP with diabetes is limited.32,33,38
Thus the present study aimed to investigate the independent effects of noise (road, aircraft and railway noise and specific noise characteristics like number and temporal variation of noise events), and of NO2 on diabetes incidence.
Methods
Study population
This study includes participants of the Swiss Cohort Study on Air Pollution and Lung and Heart Diseases in Adults (SAPALDIA) which is a population-based study that included 9651 adults in 1991 (SAP1) sampled from eight areas representing diverse characteristics of Switzerland. SAP1 focused on respiratory phenotypes, participants had interviews and health examinations39 and there was no information on participants’ diabetes status. In 2002 (SAP2), the study expanded into cardio-metabolic phenotypes, including 8047 participants who had interviews, health examination and blood sampling into a biobank for biomarkers (including glycosylated haemoglobin, HbA1c).40 In 2011 (SAP3), the study included 6088 participants and applied an extended SAP2 protocol. Ethical clearance was obtained from the ethics committees of the participating cantons and the Swiss National Ethics Committee. Participants provided informed written consent before participating in any assessment of the SAPALDIA study.
From the 6088 participants at SAP3, we excluded 309 participants with diagnosed diabetes at SAP2, defined by health questionnaire and HbA1c data. To limit misclassification in exposures and area-level covariates, we excluded 2363 participants for having changed their residence between SAP2 and SAP3 and 685 participants for lacking covariate information. We therefore included 2631 participants of SAP2 and SAP3 who were not diabetic at SAP2 and had the same residence between SAP2 and SAP3 and complete covariate data.
Identification of incident diabetes
At SAP2 and SAP3, participants answered questions concerning their health and medication use. HbA1c was measured in EDTA-buffered whole blood from both surveys using the ARK-RAY ADAMS A1c HA-8180V analyser (Menarini, Florence), based on high-performance liquid chromatography. This array performs optimally in clinical applications as it has minimal interference from alternate haemoglobin variants.41 HbA1c was measured in mmol/mol according to the International Federation of Clinical Chemistry and converted into percentage according to the National Glycohemoglobin Standardization Programme (NGSP)42. Participants were identified as incident diabetes cases if they were not diabetic at SAP2 but reported physician-diagnosed diabetes or taking diabetes medication (including insulin, metformin, thiazolidinedione, gliflozin, incretin mimetic, acarbose or their combinations) or had HbA1c ≥ 6.5%, at SAP3.
Assignment of transportation noise and AP exposures
In the framework of the SiRENE (Short and Long Term Effects of Transportation Noise Exposure) project, road traffic, aircraft and railway noise levels were calculated as annual noise levels using Swiss noise models as previously described.43 In 2001, exposures to road traffic, aircraft and railway noise at the most-exposed façade of the participants’ residential floors were assigned to the participants. Road noise was calculated using the SonROAD44 emission and Stl-8645 propagation models. Aircraft noise was predicted using FLULA246 which performs a time-step simulation of individual flights, yielding maximum noise levels. Railway noise was calculated using the SonRAIL47 emission and SEMIBEL48 propagation models.
Noise exposure metrics were computed for each source including day (Lday; 07–23 h; dB), night (Lnight; 23–07 h; dB) and day-evening-night noise level with 5 dB and 10 dB penalties for evening (19–23 h) and night-time, respectively, (Lden, dB). The total number of noise events from any noise source standing out from the background noise during night-time (NEnight), and the intermittency ratio at night (IRnight; %, which is the ratio of the event-based noise level to the overall noise level for all noise sources combined) were also computed.49 Road, aircraft or railway noise levels were assigned respective left-truncated values of 35, 30 and 30 dB.
Annual mean residential outdoor NO2 levels were assigned to participants’ residences in 2001 using a combination of Gaussian dispersion (incorporating traffic, agricultural and industrial emission inventories) at a resolution of 200 m x 200 m, and land-use regression models (incorporating population, elevation, road length within 50- and 20-m buffers, number of apartments and buildings within 9 and 81 hectares, respectively), with the final hybrid model having an adjusted R2 of 0.8.50 In 2010/11, using the same principle, area-specific hybrid models were used to model NO2 exposures to participants’ residences, with adjusted R2 range of 0.5–0.9 across study areas. In 2000, PM2.5 was modelled to participants’ residences using similar Gaussian dispersion model as for NO2.51 Compared with PM2.5 which has more regional/homogeneous distribution, NO2 shows a steeper decay with distance from traffic, provides more local contrast and is therefore a better marker of near-road traffic-related air pollution.52 Our study therefore focused on six main exposures, namely Lden road, aircraft and railway, NEnight, IRnight, NO2, and applied PM2.5 and change in NO2 (between 2001 and 2010/11) towards sensitivity analyses.
Measurement of potential confounders/ effect modifiers
Relevant variables were extracted from data provided by the participants in both surveys. Selected potential confounders at SAP2 include: age (continuous); sex (male/female); educational attainment (≤ 9 years/> 9 years of formal education); neighbourhood socioeconomic index (SEI; continuous) derived from a principal component analysis involving educational level and income of household head, crowding and median rent of households;54 smoking status (never/former/current), and pack-years (continuous); passive smoke exposure (yes/no); consumption of at least one glass of alcohol (ordinal: never, rarely, 1–2 times/week, several times/week, once/day, twice/day, three or more times/day); consumption of at least one portion of fruits and vegetables (ordinal: never/seldom/from 1 to 7 days per week); at least 150 min/week of moderate physical activity defined as engagement in activities that makes one sweat or moderately out of breadth (yes/no); and body mass index (BMI; continuous) and change in BMI (continuous) between both surveys.
Other relevant variables assessed at SAP2 include: hearing problems (yes/no); noise annoyance based on 11-point noise annoyance scale;55 and green areas within a 2-km residential buffer, available from the European Environment Agency hectare resolution dataset (CORINE CLC-2006 Version 13, 02–2010). At SAP3, we measured noise sensitivity based on the 10-item Weinstein’s noise sensitivity 6-point score,56 self-reported sleep quality (good/bad), sleeping with open windows (yes/no) and bedroom orientation (street/non-street).
Statistical analyses
We summarized the participants’ characteristics based on diabetes status and compared these characteristics between included and excluded SAPALDIA participants. Continuous variables were summarized as medians (interquartile range, IQR) and differences in medians tested using the median test, and categorical variables were summarized as proportions (%) and differences in proportions tested using the chi-squared test.
To estimate the relative risk (RR) of diabetes in relation to transportation noise and AP exposures, we used mixed Poisson regression models with random intercepts at the level of study areas, and corrected for the biased variance estimates obtained by applying the Poisson model to binary data. Since our data are clustered, we could not apply the robust sandwich estimator.53 Having only eight clusters, we also could not apply the cluster-level robust variance estimator (optimal when clusters are ≥ 50) which would lead to over-compensation of standard errors.53 Therefore, we used a heuristic method where we adjusted the coefficient from the mixed Poisson regression model with the T-statistic of the corresponding mixed logistic regression model, which provides unbiased standard errors and P-values:54
The rationale behind this approach is analogous to the one underlying Miettinen’s construction of confidence intervals for odds ratios and relative risks where the 95% confidence interval for a relative risk is defined as RR(1+/-1.96/t) where t is the positive square root of the chi-squared statistic of the associated chi-squared test.54
Estimation of relative risks proceeded in stages. First, we explored single exposure models for Lden road, Lden aircraft, Lden railway and NO2, adjusted for age, sex, educational attainment, SEI, smoking status, pack-years, passive smoking, consumption of alcohol, fruits and vegetables, physical activity, BMI and change in BMI. Due to the substantial left truncation of aircraft and railway noise levels, we also included a source-specific truncation indicator (0 = truncated/1 = non-truncated values). Second, we built a multi-exposure model (main model) including three noise sources: Lden, their truncation indicators and NO2, and adjusted for same potential confounders. We further explored the impact of IRnight, noise annoyance and green space on diabetes risk using this main model. Next, we tested linearity of associations by including thin-plate smoothing splines of exposures in the main model. We explored day and night differences in relative risks using multi-exposure models built with Lday and Lnight. We also explored the independent contributions of NEnight (in quartiles due to its left-skewed distribution with isolated high values) also using the main model. Next, we tested effect modification by age, sex and noise annoyance measured at SAP2, and by noise sensitivity, sleep quality, bedroom orientation and sleeping with open windows measured at SAP3.
For sensitivity analyses, we assessed the additional effect of change in NO2 between surveys, replaced NO2 with PM2.5, and applied the in-built cluster-level robust variance estimator. We also applied random slopes of noise variables and NO2 at the level of study areas, excluded three incident diabetes cases identified only through HbA1c testing, excluded participants reporting hearing problems and explored the effect of potential selection bias using inverse probability weighting (IPW) by applying the inverse of the probability of participation in the present analyses, derived from SAP 1, on our main effect estimates. Analyses were done with STATA version 14 (Stata Corporation, TX) and R Studio version 0.99.092 (R Foundation for Statistical Computing, Vienna). All results are presented as relative risks of diabetes incidence per IQR of the respective exposure variables.
Results
Diabetes incidence was 4.2% during a median follow-up of 8.3 years. Medians (IQR) of Lden road, aircraft, railway noise, NEnight, IRnight and NO2 levels were 54 (10) dB, 32 (11) dB, 30 (12) dB, 109 (160), 75 (26)% and 21 (15) μg/m3 respectively. There was a high correlation between Lden and Lday and Lnight for road noise (r = 0.99), and Lden and Lday, but not Lnight, for aircraft noise (Supplementary Table 1, available as Supplementary data at IJE online). Road traffic noise was moderately correlated with NO2 (r = 0.43) and NEnight (r = 0.62). Road traffic noise was the commonest noise exposure whereas railway noise was the least (Lden) (Supplementary Figure 1, available as Supplementary data at IJE online). Aircraft noise was the least observed at night (Table 1). Compared with the excluded participants, included participants were older, of higher social status, smoked less, drank less alcohol, gained less weight, had higher exposure to road traffic noise and number of events, and less green space (Table 1). Incident diabetes was comparable between included (4.2%) and excluded participants (4.7%). Incident diabetes cases were older, of lower social status and had higher BMI and reported hearing problems and poorer sleep quality, compared with participants without diabetes (Table 1). We also observed differences in their exposures to road traffic and aircraft noise (Lden and Lday) and NEnight but not with Lnight aircraft or railway noise or NO2 (Table 1).
Table 1.
Characteristics of participants included in the study
| Included |
Excludeda |
||||
|---|---|---|---|---|---|
| Characteristic | Incident diabetes (%) | No incident diabetes (%) | Chi-squared test (P-value)b | n (%) | Chi-squared test (P-value)c |
| n = 110 | n = 2521 | ||||
| Females | 50.9 | 52.8 | 0.698 | 4715 (52.6) | 0.949 |
| Education ≤ 9 years | 11.9 | 7.0 | 0.050 | 4704 (9.6) | < 0.001 |
| Ever-smokers | 56.0 | 54.3 | 0.726 | 5082 (59) | < 0.001 |
| Exposure to passive smoke | 46.4 | 41.2 | 0.279 | 5082 (49.6) | < 0.001 |
| Alcohol > 1 glass/day | 10.1 | 8.0 | 0.439 | 3636 (10) | 0.693 |
| Fruits > 3 days/week | 60.9 | 59.7 | 0.893 | 3634 (53.9) | < 0.001 |
| Vegetables > 3 days/week | 69.1 | 72.5 | 0.353 | 3638 (67.6) | < 0.001 |
| At least 150 min/week of moderate physical activity | 52.7 | 49.4 | 0.503 | 3619 (48.7) | 0.462 |
| Bad sleep quality | 16.4 | 10.1 | 0.034 | 1593 (11.5) | 0.243 |
| Hearing problems | 17.3 | 9.8 | 0.011 | 4415 (9.9) | 0.754 |
| Bedroom facing street | 35.9 | 43.5 | 0.128 | 1569 (39.3) | 0.014 |
| Closing windows | 22.1 | 21.2 | 0.826 | 1569 (22.9) | 0.201 |
| Area: Basel | 9.1 | 13.7 | 0.212 | 624 (13.2) | < 0.001 |
| Wald | 20.9 | 21.2 | 782 (16.6) | ||
| Davos | 4.5 | 9.2 | 359 (7.6) | ||
| Lugano | 10.9 | 11.9 | 757 (16.1) | ||
| Montana | 2.7 | 3.2 | 559 (11.9) | ||
| Payerne | 21.8 | 13.7 | 690 (14.6) | ||
| Aarau | 19.1 | 17.1 | 507 (10.7) | ||
| Geneva | 10.9 | 10.0 | 437 (9.3) | ||
| Median (IQR) | Median test (P-value)b | n [Median (IQR)] | Median test (P-value)c | ||
| Age | 59.2 (13.1) | 53.3 (16.1) | < 0.001 | 4715 [51.2 (19.7)] | < 0.001 |
| Body mass index (BMI) | 28.3 (5.4) | 24.9 (5.1) | < 0.001 | 3673 [25.3 (5.5)] | 0.554 |
| Change in BMI | 0.5 (2.7) | 0.5 (1.9) | 0.997 | 1593 [0.7 (2.1)] | < 0.001 |
| Neighbourhood socioeconomic index | 64.2 (14.7) | 65.3 (13.9) | 0.174 | 5027 [63.1 (14)] | < 0.001 |
| Pack-years of smoking | 0 (16.3) | 0 (12.9) | 0.778 | 4534 [0.3 (18.5)] | 0.010 |
| 11-point noise annoyance scale | 2 (4) | 2 (5) | 0.191 | 3638 [2 (5)] | 0.151 |
| Noise sensitivity score | 31 (15) | 32 (16) | 0.414 | 1883 [32 (16)] | 0.450 |
| PM2.5 (μg/m3) | 15.2 (4.5) | 14.6 (3.5) | 0.629 | 5358 [14.9 (5.5)] | 0.338 |
| NO2 (μg/m3) | 20.4 (15) | 21.1 (15.4) | 0.562 | 4633 [21.5(16.8)] | 0.187 |
| Change in NO2 (μg/m3) between SAP3 and SAP2 | −2.8 (4.8) | −3.2 (6.7) | 0.204 | 2943 [-3.5 (9.4)] | 0.028 |
| Lden road (dB) | 56(10) | 54(11) | 0.031 | 5027 [55 (12)] | < 0.001 |
| Lden air (dB) | 30 (19) | 30 (12) | 0.291 | 5027 [30 (12)] | 0.661 |
| Lden railway (dB) | 33 (12) | 32 (11) | 0.623 | 5027 [31 (11)] | < 0.001 |
| Leq road, night (dB) | 46.6 (10) | 44.8 (10.4) | 0.015 | 5027 [46 (12)] | < 0.001 |
| Leq air, night (dB) | 20 (3) | 20 (3) | 0.729 | 5027 [20(3)] | 0.361 |
| Leq railway, night (dB) | 26 (15) | 25 (14) | 0.493 | 5027 [24(14)] | 0.015 |
| Total intermittency ratio (IR), night | 74 (29) | 75 (26) | 0.730 | 5025 [75 (26)] | 0.564 |
| Total number of events (NE), night | 143 (178) | 107 (157) | 0.032 | 5025 [126 (189)] | < 0.001 |
| Leq road, day (dB) | 54 (10) | 52 (11) | 0.029 | 5027 [53 (12)] | < 0.001 |
| Leq air, day (dB) | 30 (20) | 30 (11) | 0.267 | 5027 [30 (11)] | 0.618 |
| Leq railway, day (dB) | 30 (7) | 30 (6) | 0.756 | 5027 [30 (7)] | 0.030 |
| Green space within 2 km residential buffer (km2) | 0.17 (0.51) | 0.17 (0.51) | 0.997 | 5027 [0.22 (0.51)] | 0.012 |
aNumber of participants excluded due to missing data, change of residence or having diabetes at baseline for each variable, and their corresponding summary measure (proportion or median). SAP2 and SAP3 refer to the first and second follow-up surveys of the SAPALDIA (Swiss Cohort Study on Air Pollution and Lung and Heart Diseases in Adults) study.
bP-value of difference in proportions or medians between participants with and without incident diabetes.
cP-value of difference in proportions or medians between included and excluded participants. Leq; noise levels over a given period of time, Lden; day-evening-night noise levels with 5dB and 10dB penalties for evening and night-time respectively.
In single exposure models for Lden and NO2 (Table 2), road and aircraft noise were positively associated with incident diabetes independent of traditional risk factors. Adjustment for physical activity and BMI reduced effect estimates across all exposures. Aircraft noise, which showed doubling of diabetes incidence per IQR, became more precise on accounting for noise intermittency, whereas the effects of road traffic noise remained unchanged. Noise intermittency itself was not associated with diabetes risk across single exposure models for road [relative risk (RR): 0.92; 95% CI: 0.72–1.18], aircraft (RR: 0.88; 95% CI: 0.68–1.13) and railway (RR: 0.94; 95% CI: 0.73–1.20) noise. We observed no effect of railway noise or NO2 on diabetes risk in the single exposure models.
Table 2.
Association between 1-year mean transportation noise levels, NO2 and incident diabetes
| Lden road | Lden aircraft | Lden railway | NO2 | |
|---|---|---|---|---|
| RR (95% CI) | RR (95% CI) | RR (95% CI) | RR (95% CI) | |
| Single exposure | ||||
| Model 1 | 1.29 (1.00, 1.67) | 1.83 (1.03, 3.28) | 0.96 (0.71, 1.28) | 0.94 (0.68, 1.30) |
| Model 2 | 1.21 (0.94, 1.57) | 1.80 (0.97, 3.35) | 0.90 (0.68, 1.19) | 0.88 (0.65, 1.20) |
| Model 3 | 1.20 (0.92, 1.56) | 1.75 (0.96, 3.19) | 0.94 (0.72, 1.22) | 0.92 (0.67, 1.26) |
| Model 4 | 1.20 (0.93, 1.55) | 1.86 (1.01, 3.40) | 0.95 (0.73, 1.24) | 0.89 (0.64, 1.23) |
| Model 5 | 1.17 (0.88, 1.53) | 1.92 (1.04, 3.55) | 0.94 (0.72, 1.22) | 0.87 (0.62, 1.21) |
| Multi-exposure | ||||
| Model 1 | 1.41 (1.07, 1.87) | 1.86 (1.00, 3.45) | 0.94 (0.71, 1.26) | 0.84 (0.59, 1.20) |
| Model 2 | 1.38 (1.03, 1.83) | 1.82 (0.93, 3.56) | 0.90 (0.68, 1.20) | 0.81 (0.56, 1.15) |
| Model 3 | 1.35 (1.02, 1.78) | 1.86 (0.96, 3.59) | 0.94 (0.71, 1.24) | 0.86 (0.61, 1.22) |
| Model 4 | 1.40 (1.05, 1.86) | 1.95 (1.01, 3.77) | 0.98 (0.74, 1.29) | 0.79 (0.55, 1.15) |
| Model 5 | 1.31 (0.98, 1.75) | 1.96 (1.00, 3.81) | 0.94 (0.72, 1.24) | 0.86 (0.60, 1.22) |
| Model 6 | 1.35 (1.02, 1.78) | 1.87 (0.96, 3.62) | 0.94 (0.71, 1.24) | 0.87 (0.60, 1.22) |
All RRs are per IQR of respective noise metric (road: 10 dB, aircraft: 12 dB, rail: 11d B, NO2: 15μg/m3). Single exposure models included one exposure at a time whereas multi-exposure models considered all exposure metrics at the same time. Random intercepts were applied at the level of the study areas in all models.
Model 1: unadjusted model. Unadjusted model for multi-exposure models include road, aircraft and railway traffic noise, noise truncation indicator and NO2.
Model 2: Model 1 + age, sex, educational level, neighbourhood socioeconomic index, smoking status and pack-years, consumption of alcohol, fruits and vegetables.
Model 3: Model 2 + physical activity, body mass index and change in body mass index.
Model 4: Model 3 + noise intermittency.
Model 5: Model 3 + traffic noise annoyance.
Model 6: Model 3 + green space.
We observed similar results with the multi-exposure models (Table 2) except for road traffic noise which became stronger and more precise (Figure 1). We observed little confounding among exposures in the multi-exposure models. Neither noise intermittency (RR: 0.83; 95% CI: 0.64–1.06), green space (RR: 0.95; 0.55–1.63) nor PM2.5 (RR: 0.99; 95% CI: 0.81–1.17) was associated with incident diabetes in the multi-exposure models. Describing the association between diabetes incidence and road and aircraft noise (Lden), by smoothing splines in multi-exposure models, showed that optimal solution was linear for both variables (Supplementary Figure 2, available as Supplementary data at IJE online). Daytime and night-time noise effects on diabetes risk were comparable with those of Lden for road and railway noise levels (Figure 1). We observed a strong positive effect of aircraft noise on diabetes risk during the day, but not at night (Figure 1). We observed a positive trend between quartiles of NEnight and diabetes risk independent of road, railway and aircraft noise and NO2. Compared with the participants in the lowest quartile of noise events, participants in the highest quartile had more than 2-fold greater diabetes risk (Table 3). In the NEnight model, the main effects of road noise became reduced and imprecise (RR: 1.10; 95% CI: 0.81–1.50) whereas those of aircraft and railway noise remained unchanged (data not shown).
Figure 1.
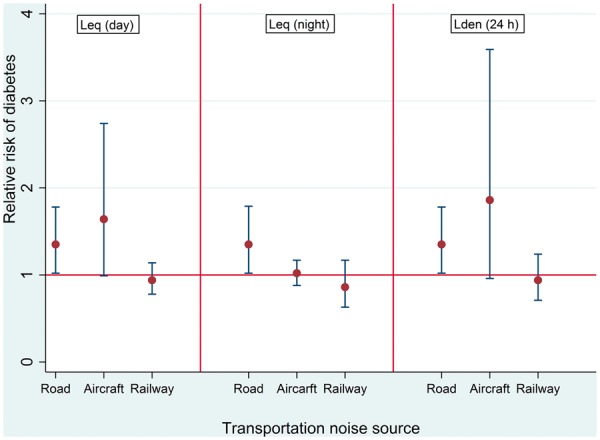
Relationship between transportation noise and risk of diabetes. All effect estimates are per inter-quartile range of respective noise metric (Lden/Lday/Lnight road: 10dB; Lden/Lday aircraft: 12dB; Lden/Lday/Lnight railway: 11dB). Leq: noise level. Lden: day-evening-night noise level. All estimates are from multi-exposure models adjusted for age, sex, educational level, neighborhood socio-economic index, smoking status and pack years, consumption of alcohol, fruits and vegetables, nitrogen dioxide, physical activity, body mass index and change in body mass index. Random intercepts were applied at the level of the study areas in the all models.
Table 3.
Association between incidence of diabetes and quartiles of number of noise events at the most exposed façade, independent of transportation noise levels
| 4.7–52.3 | 52.4–108.7 | 108.9–212.2 | 212.3–1339.7 | |
|---|---|---|---|---|
| RR (95% CI) | RR (95% CI) | RR (95% CI) | RR (95% CI) | |
| Model 1 | 1 | 1.18 (0.65, 1.13) | 1.50 (0.84, 2.67) | 1.69 (0.86, 3.32) |
| Model 2 | 1 | 1.24 (0.69, 2.23) | 1.61 (0.90, 2.86) | 1.98 (1.00, 3.92) |
| Model 3 | 1 | 1.29 (0.71, 2.34) | 1.65 (0.94, 2.91) | 2.07 (1.06, 4.06) |
| Model 4 | 1 | 1.29 (0.71, 2.35) | 1.65 (0.93, 2.91) | 2.05 (1.04, 4.03) |
| Model 5 | 1 | 1.29 (0.71, 2.34) | 1.65 (0.94, 2.91) | 2.08 (1.06, 4.08) |
All RRs were obtained by taking the lowest quartile as reference category. Random intercepts were applied at the level of the study areas in all models.
Model 1: unadjusted model including Lden road, aircraft, railway, and their truncation indicators.
Model 2: Model 1 + age, sex, educational level, neighbourhood socioeconomic index, smoking status and pack-years, consumption of alcohol, fruits and vegetables, and NO2.
Model 3: Model 2 + physical activity, body mass index and change in body mass index.
Model 4: Model 3 + traffic noise annoyance.
Model 5: Model 3 + green space.
Given that we observed positive precise effects of road noise on diabetes risk, we focused our effect modification on road noise. Although the P-values of heterogeneity were > 0.05, we observed substantially increased effects of road noise among persons who reported sleeping with open windows and poor sleep quality (Table 4). Sensitivity analyses yielded robust results, and there was minimal evidence for potential selection bias (Supplementary Table 3, available as Supplementary data at IJE online).
Table 4.
Modification of the association between 1-year mean Lden road and diabetes risk
| Characteristics | n | RR (95% CI) |
|---|---|---|
| Sex | ||
| Males | 1244 | 1.66 (1.08, 2.55) |
| Females | 1387 | 1.17 (0.77, 1.77) |
| P-value of interaction | 0.259 | |
| Age groups | ||
| ≤ 54 | 1316 | 1.10 (0.67, 1.82) |
| > 54 | 1315 | 1.46 (1.04, 2.04) |
| P-value of interaction | 0.344 | |
| Sleep quality | ||
| Good | 2359 | 1.28 (0.95, 1.72) |
| Bad | 272 | 2.05 (1.02, 4.12) |
| P-value of interaction | 0.228 | |
| Noise annoyance | ||
| ≤ P50 | 1533 | 1.21 (0.83, 1.78) |
| > P50 | 1095 | 1.27 (0.85, 1.91) |
| P-value of interaction | 0.872 | |
| Noise sensitivity score | ||
| ≤ P50 | 1144 | 1.20 (0.75, 1.92) |
| > P50 | 1091 | 1.19 (0.69, 2.06) |
| P-value of interaction | 0.935 | |
| Bedroom orientation | ||
| Non-street | 1108 | 1.61 (1.11, 2.35) |
| Street | 1457 | 1.08 (0.64, 1.83) |
| P-value of interaction | 0.341 | |
| Sleeping with open windows | ||
| Yes | 2016 | 1.44 (1.02, 2.03) |
| No | 544 | 0.64 (0.34, 1.19) |
| P-value of interaction | 0.083 | |
| Noise intermittency | ||
| ≤ P50 | 1312 | 1.28 (0.88, 1.86) |
| > P50 | 1319 | 1.35 (0.90, 2.02) |
| P-value of interaction | 0.839 | |
| Residential NO2 level | ||
| ≤ P50 | 1316 | 1.30 (0.89, 1.92) |
| > P50 | 1315 | 1.42 (0.94, 2.15) |
| P-value of interaction | 0.852 | |
| Decline in NO2 level | ||
| ≤ P50 | 1315 | 1.72 (1.13, 1.92) |
| > P50 | 1314 | 1.11 (0.76, 1.62) |
| P-value of interaction | 0.096 |
All RRs are per 10 dB of road traffic noise. P50 represents the median level of each variable. All estimates are from multi-exposure models adjusted for age, sex, educational level, neighbourhood socioeconomic index, smoking status and pack-years, consumption of alcohol, fruits and vegetables, physical activity, body mass index and change in body mass index. Random intercepts were applied at the level of the study areas in all models.
Discussion
We have presented comprehensive evidence on the association of transportation noise and AP with diabetes risk independent of AP. Our findings suggest a strong effect of road and aircraft noise, independent of the other transportation noise sources and NO2, but no effect of railway noise or NO2. Number of noise events rather than the temporal noise variation (intermittency ratio) predicted diabetes risk.
Our findings on transportation noise and risk of diabetes generally agree with other studies. Road traffic, but not railway noise, was associated with diabetes risk independent of AP exposure.32 Higher diabetes risk was reported among those living in busy traffic areas compared with those in quieter areas,35 which could relate to both road traffic noise and AP. Another study reported a positive relationship between aircraft noise and incident diabetes among those who did not change their residence during follow-up.34 A recent study reported a stronger association between road noise and prevalent diabetes compared with PM2.5 in mutually-adjusted models.33 The absence of effects from railway noise and night-time aircraft noise may be due to lower levels of exposures compared with road and daytime aircraft exposures. Most flights occur during the day and we cannot exclude the impact of night-time exposure misclassification due to flight re-routing in previous years.43 It may also be that railway noise characteristics are less detrimental for diabetes risk.
Noise may impact on diabetes risk through two major and interrelated pathways-stress and sleep disturbances.17,18 Stress responses to chronic activation of the hypothalamic-pituitary adrenal axis16 may result in metabolic impairment and insulin resistance.19,55 The impact of noise exposure on sleep is well established. Noise may impair sleep quality, leading to behavioural56 and metabolic derangements.57 Reduced sleep quantity and quality were linked to impaired glucose regulation22 and increased adiposity.58 Our finding of 2-fold stronger risk of diabetes related to road traffic noise among participants reporting poor sleep quality agrees with the metabolic complications of noise exposure. In fact, exploratory analyses showed that railway noise was only positively associated with diabetes risk among participants reporting poor sleep quality [(RR: 1.28; 95% CI: 0.80–2.05) vs (RR: 0.83; 95% CI: 0.60–1.16 for good sleep quality)]. Noise annoyance represents a cognitive pathway through which noise may impact on health outcomes.59,60 Although effect modification by noise annoyance and/or sensitivity has been reported with hypertension61 and obesity,62 we could not find any modification by these attributes. However, we cannot discard the conscious pathway of the noise effects on diabetes, given our observation of daytime road and aircraft noise effects.
Although we found stronger effect among participants who slept with open windows, we did not replicate this trend among participants whose bedrooms faced the street. Participants with sleeping rooms away from the street were more likely to sleep with open windows (84% vs 73%), thus increasing their noise exposure. Evidence on the relevance of number of noise events and intermittency in understanding the health impacts of noise has been limited to sleep studies.63,64 We did not observe any main effect with noise intermittency on diabetes risk. Experimental mouse models showed that chronic intermittent noise did not affect pancreatic function.65 Although we observed positive association with noise events, the main effect of road traffic noise was lost due to the high correlation between both parameters. Therefore, number of events may capture some road noise effects. Further exploration of these noise attributes are needed to better understand the health impacts of noise exposure.
Despite the plausibility of a link between air pollutants and diabetes risk, and previous observation of a positive association between NO2 and prevalent diabetes in SAPALDIA66 and other studies,8 we could not replicate those findings in this study. This may be due to our few incident diabetes cases and relatively short follow-up time. In addition, mean NO2 levels, which comprised our measure of contrasts in long-term exposure to AP, were much lower at the first follow-up survey (22.6 μg/m3) compared with the previous 10-year mean (27 μg/m3) used in our previous studies.10,66 NO2 levels further decreased between surveys (Table 1), and this change was not associated with incident diabetes (RR: 0.90; 0.71–1.15). Furthermore, we did not observe any associations with PM2.5, corroborating the findings of recent studies where no association was observed between both pollutants and incident diabetes.28–30 Our observation of stronger noise effects among participants with lower NO2 exposures during follow-up may reflect less NO2 exposure misclassification and therefore residual confounding by NO2 in this group.
Apart from being the first study exploring the simultaneous impact of all three types of transportation noise, including number of events and intermittency, and AP, our study has other strengths. It was a longitudinal study with at least 8-year follow-up time. We identified undiagnosed diabetes using National Glycohemoglobin Standardization Program (NGSP)-certified methods. The SAPALDIA study provided an extensive database of lifestyle characteristics which enabled the exploration of potential confounding and susceptibility. Our noise exposures were derived from validated and detailed Swiss noise models, and noise exposure characteristics were assigned individually to facades on participants’ residential floors. Our AP estimates assigned to participants’ residences also derive from validated models with high spatial resolution. This study focused on non-movers, further reducing exposure misclassification.
This study was mainly limited by the sample size and the number of diabetes cases which precluded detailed exploration of susceptibilities, especially for aircraft noise where only about 40% was exposed. Some exposure misclassification could have occurred due to data errors, building characteristics and daytime mobility of participants, which is most likely non-systematic, leading to bias towards null. Sleep quality was subjectively assessed by the participants. Bias from loss to follow-up due to noise-related death from cardiovascular causes may have led to underestimating the observed noise effects on diabetes. Although IPW showed minimal evidence for potential selection bias, some bias may still persist, given that road noise effects were weaker among participants excluded due to missing data (Supplementary Table 3). Finally, distinction of type 2 diabetes from type 1 diabetes cases was not possible, but we expect only < 10% to be incident type 1 diabetes.67
Conclusion
We found positive associations of road and aircraft noise, but not traffic-related AP, with incidence of diabetes. Window opening pattern and sleep disturbance may modify the susceptibility to road traffic noise. Larger longitudinal studies are needed to confirm these findings and consider indoor and non-transportation noise.
Supplementary Data
Supplementary data are available at IJE online.
Funding
This work was supported by the Swiss National Science Foundation; SNF-SAPALDIA (grants numbers 33CS30–148470/1, 33CSCO-134276/1, 33CSCO-108796, 324730_135673, 3247BO-104283, 3247BO-104288, 3247BO-104284, 3247–065896, 3100–059302, 3200–052720, 3200–042532, 4026–028099, PMPDP3_129021/1, PMPDP3_141671/1); SNF-SiRENE (grant number CRSII3_147635); and the Swiss Federal Office for the Environment.
SAPALDIA is also supported by the Federal Office of Public Health, the Federal Office of Roads and Transport, the canton’s government of Aargau, Basel-Stadt, Basel-Land, Geneva, Luzern, Ticino, Valais and Zürich, the Swiss Lung League, the canton’s Lung League of Basel Stadt/Basel Landschaft, Geneva, Ticino, Valais, Graubünden and Zurich, Stiftung ehemals Bündner Heilstätten, SUVA, Freiwillige Akademische Gesellschaft, UBS Wealth Foundation, Talecris Biotherapeutics GmbH, Abbott Diagnostics, European Commission 018996 (GABRIEL), Wellcome Trust WT 084703MA.
Conflict of interest: None declared.
Supplementary Material
References
- 1. Lim SS, Vos T, Flaxman AD. et al. A comparative risk assessment of burden of disease and injury attributable to 67 risk factors and risk factor clusters in 21 regions, 1990–2010: a systematic analysis for the Global Burden of Disease Study 2010. Lancet 2012;380:2224–60. [DOI] [PMC free article] [PubMed] [Google Scholar]
- 2. Fritschi L, Brown L, Kim R, Schwela D, Kephalopolous S. Conclusions [Burden of Disease From Environmental Noise: Quantification of Healthy Years Life Lost in Europe]. Copenhagen: World Health Organization, 2011. [Google Scholar]
- 3. Brook RD, Rajagopalan S, Pope CA 3rd. et al. Particulate matter air pollution and cardiovascular disease: An update to the scientific statement from the American Heart Association. Circulation 2010;121:2331–78. [DOI] [PubMed] [Google Scholar]
- 4. Munzel T, Gori T, Babisch W, Basner M. Cardiovascular effects of environmental noise exposure. Eur Heart J 2014;35:829–36. [DOI] [PMC free article] [PubMed] [Google Scholar]
- 5. Vienneau D, Schindler C, Perez L, Probst-Hensch N, Roosli M. The relationship between transportation noise exposure and ischemic heart disease: a meta-analysis. Environ Res 2015;138:372–80. [DOI] [PubMed] [Google Scholar]
- 6. Dzhambov AM, Dimitrova DD. Long-term self-reported exposure to occupational noise is associated with BMI-defined obesity in the US general population. Am J Ind Med 2016;59:1009–19. [DOI] [PubMed] [Google Scholar]
- 7. Jerrett M, McConnell R, Wolch J. et al. Traffic-related air pollution and obesity formation in children: a longitudinal, multilevel analysis. Environ Health 2014;13:49. [DOI] [PMC free article] [PubMed] [Google Scholar]
- 8. Eze IC, Hemkens LG, Bucher HC. et al. Association between ambient air pollution and diabetes mellitus in Europe and North America: systematic review and meta-analysis. Environ Health Perspect 2015;123:381–89. [DOI] [PMC free article] [PubMed] [Google Scholar]
- 9. Dzhambov AM. Long-term noise exposure and the risk for type 2 diabetes: a meta-analysis. Noise Health 2015;17:23–33. [DOI] [PMC free article] [PubMed] [Google Scholar]
- 10. Eze IC, Schaffner E, Foraster M. et al. Long-term exposure to ambient air pollution and metabolic syndrome in adults. PLoS One 2015;10:e0130337. [DOI] [PMC free article] [PubMed] [Google Scholar]
- 11. Liu C, Ying Z, Harkema J, Sun Q, Rajagopalan S. Epidemiological and experimental links between air pollution and type 2 diabetes. Toxicol Pathol 2013;41:361–73. [DOI] [PMC free article] [PubMed] [Google Scholar]
- 12. Rajagopalan S, Brook RD. Air pollution and type 2 diabetes: mechanistic insights. Diabetes 2012;61:3037–45. [DOI] [PMC free article] [PubMed] [Google Scholar]
- 13. Brook RD, Xu X, Bard RL. et al. Reduced metabolic insulin sensitivity following sub-acute exposures to low levels of ambient fine particulate matter air pollution. Sci Total Environ 2013;448:66–71. [DOI] [PMC free article] [PubMed] [Google Scholar]
- 14. Eze IC, Imboden M, Kumar A. et al. A common functional variant on the pro-inflammatory interleukin-6 gene may modify the association between long-term PM10 exposure and diabetes. Environ Health 2016;15:39. [DOI] [PMC free article] [PubMed] [Google Scholar]
- 15. Eze IC, Imboden M, Kumar A. et al. Air pollution and diabetes association: Modification by type 2 diabetes genetic risk score. Environ Int 2016;94:263–71. [DOI] [PubMed] [Google Scholar]
- 16. Babisch W, Fromme H, Beyer A, Ising H. Increased catecholamine levels in urine in subjects exposed to road traffic noise: the role of stress hormones in noise research. Environ Int 2001;26:475–81. [DOI] [PubMed] [Google Scholar]
- 17. Munzel T, Sorensen M, Gori T. et al. Environmental stressors and cardio-metabolic disease: part II-mechanistic insights. Eur Heart J 2016;doi:10.1093/eurheartj/ehw294. [Epub ahead of print.] [DOI] [PMC free article] [PubMed] [Google Scholar]
- 18. Recio A, Linares C, Banegas JR, Diaz J. Road traffic noise effects on cardiovascular, respiratory, and metabolic health: An integrative model of biological mechanisms. Environ Res 2016; 146:359–70. [DOI] [PubMed] [Google Scholar]
- 19. Bjorntorp P, Rosmond R. Obesity and cortisol. Nutrition 2000;16:924–36. [DOI] [PubMed] [Google Scholar]
- 20. Basner M, Babisch W, Davis A. et al. Auditory and non-auditory effects of noise on health. Lancet 2014;383:1325–32. [DOI] [PMC free article] [PubMed] [Google Scholar]
- 21. Frei P, Mohler E, Roosli M. Effect of nocturnal road traffic noise exposure and annoyance on objective and subjective sleep quality. Int J Hyg Environ Health 2014;217:188–95. [DOI] [PubMed] [Google Scholar]
- 22. Cappuccio FP, D’Elia L, Strazzullo P, Miller MA. Quantity and quality of sleep and incidence of type 2 diabetes: a systematic review and meta-analysis. Diabetes Care 2010;33:414–20. [DOI] [PMC free article] [PubMed] [Google Scholar]
- 23. Kramer U, Herder C, Sugiri D. et al. Traffic-related air pollution and incident type 2 diabetes: results from the SALIA cohort study. Environ Health Perspect 2010;118:1273–79. [DOI] [PMC free article] [PubMed] [Google Scholar]
- 24. Andersen ZJ, Raaschou-Nielsen O, Ketzel M. et al. Diabetes incidence and long-term exposure to air pollution: a cohort study. Diabetes Care 2012;35:92–98. [DOI] [PMC free article] [PubMed] [Google Scholar]
- 25. Chen H, Burnett RT, Kwong JC. et al. Risk of incident diabetes in relation to long-term exposure to fine particulate matter in Ontario, Canada. Environ Health Perspect 2013;121:804–10. [DOI] [PMC free article] [PubMed] [Google Scholar]
- 26. Hansen AB, Ravnskjaer L, Loft S. et al. Long-term exposure to fine particulate matter and incidence of diabetes in the Danish Nurse Cohort. Environ Int 2016;91:243–50. [DOI] [PubMed] [Google Scholar]
- 27. Weinmayr G, Hennig F, Fuks K. et al. Long-term exposure to fine particulate matter and incidence of type 2 diabetes mellitus in a cohort study: effects of total and traffic-specific air pollution. Environ Health 2015;14:53. [DOI] [PMC free article] [PubMed] [Google Scholar]
- 28. Park SK, Adar SD, O’Neill MS. et al. Long-term exposure to air pollution and type 2 diabetes mellitus in a multiethnic cohort. Am J Epidemiol 2015;181:327–36. [DOI] [PMC free article] [PubMed] [Google Scholar]
- 29. Coogan PF, White LF, Yu J. et al. Long term exposure to NO2 and diabetes incidence in the Black Women’s Health Study. Environ Res 2016;148:360–66. [DOI] [PMC free article] [PubMed] [Google Scholar]
- 30. Coogan PF, White LF, Yu J. et al. PM2.5 and diabetes and hypertension incidence in the Black Women’s Health Study. Epidemiology 2016;27:202–10. [DOI] [PMC free article] [PubMed] [Google Scholar]
- 31. Puett RC, Hart JE, Schwartz J, Hu FB, Liese AD, Laden F. Are particulate matter exposures associated with risk of type 2 diabetes? Environ Health Perspect 2011;119:384–89. [DOI] [PMC free article] [PubMed] [Google Scholar]
- 32. Sorensen M, Andersen ZJ, Nordsborg RB. et al. Long-term exposure to road traffic noise and incident diabetes: a cohort study. Environ Health Perspect 2013;121:217–22. [DOI] [PMC free article] [PubMed] [Google Scholar]
- 33. Dzhambov AM, Dimitrova DD. Exposures to road traffic, noise, and air pollution as risk factors for type 2 diabetes: A feasibility study in Bulgaria. Noise Health 2016;18:133–42. [DOI] [PMC free article] [PubMed] [Google Scholar]
- 34. Eriksson C, Hilding A, Pyko A, Bluhm G, Pershagen G, Ostenson CG. Long-term aircraft noise exposure and body mass index, waist circumference, and type 2 diabetes: a prospective study. Environ Health Perspect 2014;122:687–94. [DOI] [PMC free article] [PubMed] [Google Scholar]
- 35. Heidemann C, Niemann H, Paprott R, Du Y, Rathmann W, Scheidt-Nave C. Residential traffic and incidence of Type 2 diabetes: the German Health Interview and Examination Surveys. Diabet Med 2014;31:1269–76. [DOI] [PubMed] [Google Scholar]
- 36. Tetreault LF, Perron S, Smargiassi A. Cardiovascular health, traffic-related air pollution and noise: are associations mutually confounded? A systematic review. Int J Public Health 2013;58:649–66. [DOI] [PMC free article] [PubMed] [Google Scholar]
- 37. Foraster M. Is it traffic-related air pollution or road traffic noise, or both? Key questions not yet settled! Int J Public Health 2013;58:647–48. [DOI] [PubMed] [Google Scholar]
- 38. Munzel T, Sorensen M, Gori T. et al. Environmental stressors and cardio-metabolic disease: Part I. Epidemiologic evidence supporting a role for noise and air pollution and effects of mitigation strategies. Eur Heart J 2016;doi:10.1093/eurheartj/ehw269. [Epub ahead of print.] [DOI] [PubMed] [Google Scholar]
- 39. Martin BW, Ackermann-Liebrich U, Leuenberger P. et al. SAPALDIA: methods and participation in the cross-sectional part of the Swiss Study on Air Pollution and Lung Diseases in Adults. Soz Praventivmed 1997;42:67–84. [DOI] [PubMed] [Google Scholar]
- 40. Ackermann-Liebrich U, Kuna-Dibbert B, Probst-Hensch NM. et al. Follow-up of the Swiss Cohort Study on Air Pollution and Lung Diseases in Adults (SAPALDIA 2) 1991–2003: methods and characterization of participants. Soz Praventivmed 2005;50:245–63. [DOI] [PubMed] [Google Scholar]
- 41. Weykamp C, Visser-Dekkers W, Kemna E, Siebelder C. Effects of hemoglobin D and E on the measurement of HbA1c with the modified Menarini/ARKRAY ADAMS A1c HA-8180V analyser. Clin Chim Acta 2012;414:44–45. [DOI] [PubMed] [Google Scholar]
- 42. Sacks DB. Global harmonization of hemoglobin A1c. Clin Chem 2005;51:681–83. [DOI] [PubMed] [Google Scholar]
- 43. Karipidis I, Vienneau D, Habermacher M. et al. Reconstruction of historical noise exposure data for environmental epidemiology in Switzerland within the SiRENE project. Noise Mapping 2014; 1:3–14. [Google Scholar]
- 44. Heutschi K. SonRoad: New Swiss road traffic noise model. Acta Acustica 2004;90:548–54. [Google Scholar]
- 45. FOEN. Computermodell zur Berechnung von Strassenlärm, Teil 1, Bedienungsanleitung zum Computerprogramm StL-86, in Schriftenreihe Umweltschutz. (In English:Computer model for the calculation of street noise, part 1, operating instructions for the computer program StL-86, in the environmental protection series). Bern: Swiss Federal Office for the Environment, 1987. [Google Scholar]
- 46. Empa. FLULA2, Ein Verfahren zur Berechnung und Darstellung der Fluglärmbelastung. Technische Programm Dokumentation Version 4 (In English: FLULA2, a method for calculating and displaying the noise exposure. Technical program documentation Version 4). Dübendorf: Eidgenössische Materialprüfungs und Forschunganstalt (EMPA), Abteilung Akustik/Lärmminderung; (In English: Federal Laboratories for Materials Testing and Research (EMPA), Department of Acoustics / Noise Control), 2010. [Google Scholar]
- 47. Thron T, Hecht M. The sonRAIL emission model for railway noise in Switzerland. Acta Acustica 2010;96:873–83. [Google Scholar]
- 48. FOEN. SEMIBEL: Schweizerisches Emissions-und Immisionsmodell für die Berechnung von Eisenbahnlärm (In English: Swiss Emission and Immission Model for the calculation of railway noise). Bern: Swiss Federal Office for the Environment, 1990. [Google Scholar]
- 49. Wunderli JM, Pieren R, Habermacher M. et al. Intermittency ratio: A metric reflecting short-term temporal variations of transportation noise exposure. J Expo Sci Environ Epidemiol 2015;26:575–85. [DOI] [PMC free article] [PubMed] [Google Scholar]
- 50. Liu L-JS, Tsai M-Y, Keidel D. et al. Long-term exposure models for traffic related NO2 across geographically diverse areas over separate years. Atmos Environ 2012;46:460–71. [Google Scholar]
- 51. SAEFL. Modelling of PM10 and PM2.5 Ambient Concentrations in Switzerland 2000 and 2010. Bern: Swiss Agency for the Environment, Forests and Landscape, 2003. [Google Scholar]
- 52. Health Effects Institute. Panel on the Health Effects of Traffic-related Air Pollution. Traffic-related Air Pollution: A Critical Review of the Literature on Emissions, Exposure, and Health Effects. HEI Special Report No. 17. Boston, MA: Health Effects Institute, 2010. [Google Scholar]
- 53. Zou GY, Donner A. Extension of the modified Poisson regression model to prospective studies with correlated binary data. Stat Methods Med Res 2013;22:661–70. [DOI] [PubMed] [Google Scholar]
- 54. Miettinen O. Estimability and estimation in case-referent studies. Am J Epidemiol 1976;103:226–35. [DOI] [PubMed] [Google Scholar]
- 55. Rosmond R. Stress induced disturbances of the HPA axis: a pathway to Type 2 diabetes? Med Sci Monit 2003;9:Ra35–39. [PubMed] [Google Scholar]
- 56. Passchier-Vermeer W, Passchier WF. Noise exposure and public health. Environ Health Perspect 2000;108(Suppl 1):123–31. [DOI] [PMC free article] [PubMed] [Google Scholar]
- 57. Van Cauter E, Spiegel K, Tasali E, Leproult R. Metabolic consequences of sleep and sleep loss. Sleep Med 2008;9(Suppl 1):S23–28. [DOI] [PMC free article] [PubMed] [Google Scholar]
- 58. Chaput JP, Despres JP, Bouchard C, Tremblay A. Short sleep duration is associated with reduced leptin levels and increased adiposity: Results from the Quebec family study. Obesity (Silver Spring) 2007;15:253–61. [DOI] [PubMed] [Google Scholar]
- 59. Foraster M, Eze IC, Vienneau D. et al. Long-term transportation noise annoyance is associated with subsequent lower levels of physical activity. Environ Int 2016;91:341–49. [DOI] [PubMed] [Google Scholar]
- 60. Heritier H, Vienneau D, Frei P. et al. The association between road traffic noise exposure, annoyance and health-related quality of life (HRQOL). Int J Environ Res Public Health 2014;11:12652–67. [DOI] [PMC free article] [PubMed] [Google Scholar]
- 61. Babisch W, Pershagen G, Selander J. et al. Noise annoyance - a modifier of the association between noise level and cardiovascular health? Sci Total Environ 2013;45253:50–57. [DOI] [PubMed] [Google Scholar]
- 62. Oftedal B, Krog NH, Pyko A. et al. Road traffic noise and markers of obesity – a population-based study. Environ Res 2015;138:144–53. [DOI] [PubMed] [Google Scholar]
- 63. Hurtley C. Night Noise Guidelines for Europe. Copenhagen: WHO Regional Office for Europe, 2009. [Google Scholar]
- 64. Pirrera S, De Valck E, Cluydts R. Nocturnal road traffic noise: A review on its assessment and consequences on sleep and health. Environ Int 2010;36:492–98. [DOI] [PubMed] [Google Scholar]
- 65. Armario A, Castellanos J, Balasch J. Chronic noise stress and insulin secretion in male rats. Physiol Behav 1985;34:359–61. [DOI] [PubMed] [Google Scholar]
- 66. Eze IC, Schaffner E, Fischer E. et al. Long-term air pollution exposure and diabetes in a population-based Swiss cohort. Environ Int 2014;70:95–105. [DOI] [PubMed] [Google Scholar]
- 67. Alberti KG, Zimmet PZ. Definition, diagnosis and classification of diabetes mellitus and its complications. Part 1: diagnosis and classification of diabetes mellitus provisional report of a WHO consultation. Diabet Med 1998;15:539–53. [DOI] [PubMed] [Google Scholar]
Associated Data
This section collects any data citations, data availability statements, or supplementary materials included in this article.