

Abstract
Aims
There is an urgent need to extend sudden cardiac death (SCD) risk stratification beyond the left ventricular ejection fraction (LVEF). We evaluated whether a cumulative electrocardiogram (ECG) risk score would improve identification of individuals at high risk of SCD.
Methods and results
In the community-based Oregon Sudden Unexpected Death Study (catchment population ∼1 million), 522 SCD cases with archived 12-lead ECG available (65.3 ± 14.5 years, 66% male) were compared with 736 geographical controls to assess the incremental value of multiple ECG parameters in SCD prediction. Heart rate, LV hypertrophy, QRS transition zone, QRS-T angle, QTc, and Tpeak-to-Tend interval remained significant in the final model, which was externally validated in the Atherosclerosis Risk in Communities (ARIC) Study. Sixteen percent of cases and 3% of controls had ≥4 abnormal ECG markers. After adjusting for clinical factors and LVEF, increasing ECG risk score was associated with progressively greater odds of SCD. Overall, subjects with ≥4 ECG abnormalities had an odds ratio (OR) of 21.2 for SCD [95% confidence interval (CI) 9.4–47.7; P < 0.001]. In the LVEF >35% subgroup, the OR was 26.1 (95% CI 9.9–68.5; P < 0.001). The ECG risk score increased the C-statistic from 0.625 to 0.753 (P < 0.001), with net reclassification improvement of 0.319 (P < 0.001). In the ARIC cohort validation, risk of SCD associated with ≥4 ECG abnormalities remained significant after multivariable adjustment (hazard ratio 4.84; 95% CI 2.34–9.99; P < 0.001; C-statistic improvement 0.759–0.774; P = 0.019).
Conclusion
This novel cumulative ECG risk score was independently associated with SCD and was particularly effective for LVEF >35% where risk stratification is currently unavailable. These findings warrant further evaluation in prospective clinical investigations.
Keywords: Death, Sudden cardiac, Risk stratification, Prevention, Left ventricular ejection fraction, Electrocardiography
Introduction
Sudden cardiac arrest is a major cause of mortality in the Western world, causing >300 000 sudden cardiac deaths (SCD) annually in the USA alone.1 In a large proportion of patients, SCD is the first manifestation of underlying cardiac disease.2 At present, the left ventricular (LV) ejection fraction (LVEF) is widely used to identify candidates for primary prevention therapy with implantable cardioverter-defibrillators, but this approach has significant and well-recognized limitations. Importantly, most cardiac arrests occur among subjects with preserved or only moderately reduced LVEF, who are judged to be at low risk if only LV function is considered3; therefore, new markers that will enhance SCD risk stratification are urgently sought.4 Recently published risk scores for SCD have demonstrated the importance of discovering novel markers that are more specific for sudden arrhythmic death.5,6 Since SCD ultimately results from a lethal arrhythmia, electrical markers could be explored further.7 Due to wide availability and low cost, the 12-lead electrocardiogram (ECG) is a potentially attractive, non-invasive tool for SCD risk stratification. Several ECG variables, including increased resting heart rate and markers of abnormal cardiac depolarization and repolarization, have been previously associated with increased risk of SCD.8–13 However, the discriminative power of individual ECG parameters has been limited, prompting a search for new approaches that employ the ECG as a risk predictor.4 Most importantly, none of the existing SCD risk scores have incorporated and compared the role of the LVEF, the current major clinically utilized risk predictor of SCD.
Since SCD risk represents the sum of several different risk-inducing processes and factors, it is possible that a combination of ECG parameters reflecting abnormalities in different phases of the cardiac electrical cycle could convey more information than a single parameter alone. A proof-of-concept study from the Oregon Sudden Unexpected Death Study (Oregon SUDS) has recently demonstrated that the combined use of a few selected ECG parameters may result in improved SCD risk prediction.14 In the present study from the Oregon SUDS, we assessed the incremental SCD risk associated with the presence of multiple ECG risk markers that have each individually been associated with SCD. Moreover, we evaluated whether this ECG-based approach would improve the risk prediction models beyond the LVEF, and then sought to validate these associations in an independent cohort.
Methods
Ascertainment of sudden cardiac death cases and controls
The Oregon SUDS is a population-based case-control study investigating out-of-hospital cardiac arrests in the Northwestern USA, with ongoing prospective identification of cases. The rationale and methods of the study have been described in detail previously.15 In brief, between 1 February 2002 and 31 January 2015, all cases of suspected out-of-hospital cardiac arrest (including survivors) were prospectively identified in the Portland, Oregon metropolitan area, with a population of approximately one million. Sudden cardiac death definition, adjudication process, and enrolment of controls are explained in more detail in Supplementary material online, Methods.
Controls were recruited from the same geographical area to represent individuals at risk for SCD, but with no history of ventricular arrhythmias or cardiac arrest. Since coronary artery disease (CAD) is responsible for SCD in the majority of cases, controls were ascertained so that they would represent a similar distribution of CAD as SCD cases,3 making it possible to identify factors specific to SCD.
The present analysis was restricted to ≥18-year-old subjects with 12-lead ECGs and medical records available. Demographics and past clinical history were determined from the medical records in a uniform fashion for cases and controls. Left ventricular ejection fraction was determined from archived echocardiograms, performed prior and unrelated to cardiac arrest. The study was approved by the institutional review boards of Cedars-Sinai Medical Center, Oregon Health and Science University, and all participating hospitals and health systems.
Electrocardiographic analysis
All cases and controls included in this study had an archived resting 12-lead ECG available for the analysis with paper speed of 25 mm/s and calibration of 10 mm/mV. ECGs prior and unrelated to the cardiac arrest were obtained for cases [a median of 324 days prior to arrest (interquartile range 65–981)]; for 67% the ECG was obtained within 2 years of SCD. If multiple ECGs were available, the one closest to the cardiac arrest was chosen. Electrocardiograms with atrial fibrillation or atrial flutter, left or right bundle-branch block (LBBB/RBBB), II/III-degree atrioventricular block, pre-excitation, or paced rhythm were excluded from the analysis, since they impeded the assessment of the ECG parameters under study. Heart rate, QRS duration, LV hypertrophy (LVH), delayed intrinsicoid deflection, QRS transition zone, frontal QRS-T angle, QTc interval, and Tpeak-to-Tend (TpTe) interval were analysed from the ECG. QTc interval >450 ms for men and >460 ms for women was considered prolonged.16 Detailed description of the ECG analysis is included in Supplementary material online, Methods.
Statistical analysis
Independent sample t-tests and Pearson’s χ2 tests were used for bivariate case-control comparisons of continuous and categorical variables, respectively. Heart rate, QRS duration, QRS-T angle, QT interval and TpTe interval were modelled separately as categorical and continuous variables; LVH, delayed intrinsicoid deflection and QRS transition zone were modelled only as categorical variables. In subsequent analyses, LV function was categorized as severely reduced (LVEF ≤35%) or not severely reduced (LVEF >35%).
Multivariable logistic regression analysis used to determine the association of multiple ECG risk markers with SCD risk is described in more detail in Supplementary material online, Methods. Model fit was evaluated with the Hosmer–Lemeshow goodness-of-fit test, and model discrimination with the C-statistic. Net reclassification improvement (NRI) was calculated comparing the baseline model including age, sex, hypertension, diabetes, and LVEF to the model including these and the ECG score. We calculated a category-based NRI with categories defined by predicted probability of SCD from the logistic regression model: <0.50 low, 0.50–0.69 intermediate, and ≥0.70 high. All statistical calculations were performed using SAS 9.3 (SAS Institute Inc, Cary, NC, USA). For all analyses, values of P ≤ 0.05 were considered statistically significant.
External validation in the Atherosclerosis Risk in Communities Study
A detailed description of the design of the Atherosclerosis Risk in Communities (ARIC) Study has been published previously.17 Briefly, ARIC is a prospective, multicentre general population cohort study of 15 792 participants (45% male, 74% white) aged 45–65, enrolled 1987–1989. The follow-up continued until 31 December 2002 including annual telephone calls, subsequent visits, local hospital surveillance, and searching the National Death Index. The outcome used for the present analysis was adjudicated out-of-hospital SCD,6 defined as a sudden pulseless condition in a previously stable individual without evidence of a non-cardiac cause of cardiac arrest.
Electrocardiograms from the baseline visit were independently evaluated for the six ECG risk markers that were independently associated with SCD in the Oregon SUDS population, using the same exclusion criteria, as described in Supplementary material online, Methods. Hazard ratios (HR) with 95% confidence intervals (CIs) were calculated using Cox proportional hazards model, with adjustments for age, sex, diabetes, and hypertension.
Results
Demographic and clinical characteristics
During the 13-year period of the Oregon SUDS, a total of 3361 SCD cases were enrolled, and 1089 (32%) of these had at least one pre-arrest ECG available. After excluding 136 subjects with only non-sinus rhythms such as atrial fibrillation/flutter, those with LBBB (n = 56), RBBB (n = 61), and additional 314 patients who were missing measurements of one or more of the parameters of the ECG risk score, the final analysis included 522 SCD cases with complete ECG data that were compared with 736 controls. Demographics and clinical history of the study subjects are presented in Table 1. No difference in age and sex was observed between cases and controls, but cases were less likely than controls to be of white European descent, and more likely to be current smokers, and to have diabetes and hypertension. Consistent with sampling of the control population, controls were more likely to have a prior history of known CAD than cases.
Table 1.
Demographics and clinical characteristics of sudden cardiac death cases and controls
| Demographics | Cases (n = 522) | Controls (n = 736) | P-value |
|---|---|---|---|
| Age, years | 65.3 ± 14.5 | 65.8 ± 11.5 | 0.57 |
| Male | 346 (66%) | 503 (68%) | 0.44 |
| Racea | <0.001 | ||
| White | 426 (82%) | 665 (92%) | |
| Black | 55 (11%) | 25 (3.5%) | |
| Hispanic | 10 (1.9%) | 10 (1.4%) | |
| Other | 27 (5.2%) | 24 (3.3%) | |
| Smokerb | <0.001 | ||
| Current | 165 (40%) | 124 (22%) | |
| Former | 132 (32%) | 237 (42%) | |
| Never | 113 (28%) | 209 (37%) | |
| Diabetes | 205 (39%) | 188 (26%) | <0.001 |
| Hypertension | 387 (74%) | 493 (67%) | 0.008 |
| History of coronary artery disease | 239 (46%) | 401 (54%) | 0.002 |
| Body mass index (kg/m2)c | 30.6 ± 9.8 | 29.8 ± 6.4 | 0.12 |
| LVEF ≤35%d | 51 (21%) | 34 (11%) | <0.001 |
Data are presented as mean ± SD or n(%).
SD, standard deviation; LVEF, left ventricular ejection fraction.
Race information missing for 4 cases and 12 controls.
Smoking history missing for 112 cases and 166 controls
Body mass index missing for 116 cases and 26 controls.
Left ventricular ejection fraction, missing for 279 cases and 418 controls.
Electrocardiographic findings in cases and controls
Table 2 summarizes the unadjusted ECG findings in SCD cases and controls. All ECG parameters studied differed between the two groups and were significantly associated with SCD in univariate analysis. Cases had higher heart rate (78 ± 18 vs. 67 ± 14 bpm; P < 0.001), wider QRS duration (95 ± 16 vs. 93 ± 15 ms; P = 0.003), longer QTc (453 ± 39 vs. 422 ± 32 ms; P < 0.001) and TpTe intervals (87 ± 18 vs. 81 ± 15 ms; P < 0.001), and wider QRS-T angle (61 ± 51 vs. 44 ± 41°; P < 0.001) than controls. Markedly delayed QRS transition, signs of LVH and delayed intrinsicoid deflection were also more prevalent among cases than controls. When all ECG parameters were entered together with age and sex in multivariable models, QRS duration and delayed intrinsicoid deflection lost statistical significance (P ≥ 0.20) and were omitted from further modelling. The final ECG risk model included elevated heart rate >75bpm, LVH (according to Sokolow–Lyon or Cornell criteria), delayed QRS transition zone ≥V5, wide frontal QRS-T angle >90°, prolonged QTc interval (>450 ms in men; >460 ms in women) and prolonged TpTe >89 ms.
Table 2.
Electrocardiographic characteristics of sudden cardiac death cases and controls, and unadjusted odds ratios for SCD associated with individual parameters
| ECG pattern | Cases (n = 522) | Controls (n = 736) | Odds ratio (95% CI) | P-value |
|---|---|---|---|---|
| Heart rate >75bpm | 266 (51%) | 167 (23%) | 3.5 (2.8–4.5) | <0.001 |
| QRSd >110 ms | 72 (14%) | 57 (8%) | 1.9 (1.3–2.8) | <0.001 |
| Prolonged QTca | 247 (47%) | 114 (15%) | 4.9 (3.8–6.4) | <0.001 |
| Tpeak-Tend >89 ms | 219 (42%) | 188 (26%) | 2.1 (1.7–2.8) | <0.001 |
| QRS-T angle >90° | 142 (27%) | 103 (14%) | 2.3 (1.7–3.1) | <0.001 |
| Delayed QRS transition zone | 147 (28%) | 123 (17%) | 2.0 (1.5–2.6) | <0.001 |
| Electrocardiographic LVH | 83 (16%) | 59 (8%) | 2.2 (1.5–3.1) | <0.001 |
| Delayed intrinsicoid deflection | 104 (20%) | 107 (15%) | 1.5 (1.1–2.0) | 0.01 |
Data are presented as n (%).
ECG, electrocardiogram; CI, confidence interval.
QTc >450 ms in men and >460 ms in women.
The cumulative number of these ECG abnormalities was significantly higher in cases than controls. Only 37% of SCD cases had a low ECG risk score (0–1 abnormalities), compared with 74% of the controls. In contrast, 16% of cases had a high ECG risk score of ≥4, while just 3% of controls presented with a high ECG score (P < 0.001) (Figure 1). As the ECG risk score increased, prevalence of cardiovascular risk factors and documented CAD increased among study subjects as demonstrated in Table 3.
Figure 1.

Prevalence of electrocardiogram (ECG) abnormalities in the Oregon SUDS, and risk of sudden cardiac death (SCD) associated with the ECG risk score. (A) Distribution of ECG abnormalities between SCD cases and controls. ECG parameters included in the model were elevated resting heart rate, ECG left ventricular hypertrophy, delayed QRS transition, QRS-T angle >90°, prolonged QTc, and prolonged TpTe. (B) Cumulative risk of SCD associated with the presence of multiple ECG abnormalities. Model adjusted for age, sex, hypertension, diabetes, and left ventricular function.
Table 3.
Demographic and clinical characteristics of Oregon SUDS subjects according to the electrocardiogram risk score
| Score 0 (n = 343) | Score 1 (n = 390) | Score 2 (n = 247) | Score 3 (n = 175) | Score ≥4 (n = 103) | P-value | |
|---|---|---|---|---|---|---|
| Age, years | 65.6 ± 11.5 | 65.3 ± 13.4 | 65.3 ± 12.8 | 65.6 ± 13.6 | 67.1 ± 13.9 | 0.44 |
| Male | 234 (68%) | 284 (73%) | 156 (63%) | 111 (63%) | 64 (62%) | 0.04 |
| Current smokera | 70 (25%) | 73 (25%) | 70 (38%) | 48 (34%) | 28 (35%) | 0.007 |
| Diabetes | 78 (23%) | 105 (27%) | 88 (36%) | 73 (42%) | 49 (48%) | <0.001 |
| Hypertension | 225 (66%) | 252 (65%) | 188 (76%) | 134 (77%) | 81 (79%) | <0.001 |
| History of coronary artery disease | 164 (48%) | 172 (44%) | 135 (55%) | 96 (55%) | 73 (71%) | <0.001 |
| Body mass index (kg/m2)b | 29.0 ± 7.1 | 30.3 ± 7.6 | 31.3 ± 8.3 | 30.3 ± 8.3 | 29.7 ± 8.7 | 0.09 |
ECG parameters in the ECG risk score were heart rate >75 bpm, LVH, delayed QRS transition, QRS-T angle >90°, prolonged QTc, and prolonged TpTe. Data are presented as mean ± SD or n (%).
SD, standard deviation; LVH, left ventricular hypertrophy; ECG, electrocardiogram.
Smoking history missing for 112 cases and 166 controls.
Body mass index missing for 116 cases and 26 controls.
Risk of sudden cardiac death associated with cumulative electrocardiogram abnormalities
In the presence of one or more ECG abnormalities, risk for SCD increased progressively (Figure 1). In the multivariable model, an ECG risk score of 1 was associated with an odds ratio (OR) of 2.2 (95% CI 1.2–4.1; P = 0.01), risk score of 2 with OR 4.0 (95% CI 2.2–7.5; P < 0.001) and risk score of 3 with OR 8.3 (4.3–16.1; P < 0.001) for SCD. With a high ECG risk score ≥4, risk of SCD was increased to OR 21.2 (95% CI 9.4–47.7; P < 0.001). The distribution of abnormal ECG markers was similar in survivors and non-survivors of cardiac arrest (P = 0.32), and the association of the ECG risk score with SCD was similar in survivors and non-survivors (see Supplementary material online, Table S1). In additional subgroup analyses, the association with SCD risk was not markedly different in men and women (see Supplementary material online, Table S2; P-value for gender interaction 0.25), or in elderly subjects ≥65 years compared with the younger age group (see Supplementary material online, Table S3; P-value for age interaction 0.51). When analysis was restricted to subjects with LVEF >35%, the ECG risk score was highly predictive of SCD, with OR 26.1 (95% CI 9.9–68.5; P < 0.001) with ≥4 ECG abnormalities (Table 4). In contrast, in the subgroup with LVEF ≤35%, increasing ECG risk score was not associated with SCD, but the small number of subjects precluded reliable estimates of effect size in this group (P-value for LVEF interaction 0.09).
Table 4.
Risk of SCD associated with the ECG risk score in the subgroup of patients with LVEF >35% (n = 476)
| Number of abnormal ECG markers | Cases (n = 192) | Controls (n = 284) | Odds ratio (95% CI)a | P-value |
|---|---|---|---|---|
| 0 | 17 | 95 | Reference | — |
| 1 | 43 | 100 | 2.3 (1.2–4.4) | 0.008 |
| 2 | 50 | 59 | 4.5 (2.4–8.5) | <0.001 |
| 3 | 46 | 23 | 10.4 (5.1–21.5) | <0.001 |
| ≥4 | 36 | 7 | 26.1 (9.9–68.5) | <0.001 |
ECG parameters included in the model were heart rate >75bpm, LVH, delayed QRS transition, QRS-T angle >90°, prolonged QTc and prolonged TpTe.
LVH, left ventricular hypertrophy; CI, confidence interval; ECG, electrocardiogram.
Models adjusted for age, sex, diabetes, and hypertension.
Addition of the ECG risk score to a model including LVEF and demographic/clinical factors resulted in significant improvement in the receiver operating characteristic curve. The C-index for the model with LVEF, age, sex, hypertension, and diabetes was 0.625, and addition of the ECG variables significantly improved model discrimination, with C-statistic of 0.753 (P < 0.001). Overall net reclassification improvement was 0.319 (P < 0.001). The event NRI was 35.4%, with 42.4% of cases appropriately reclassified into a higher risk group and 7.0% of cases inappropriately reclassified into a lower risk group. The non-event NRI was −3.5%, with 10.1% of controls appropriately reclassified into a lower risk group and 13.5% of controls inappropriately reclassified into a higher risk group. As a sensitivity analysis, an alternative risk score using different weights on the ECG parameters was calculated, as described in the Supplementary material online, Methods. This weighted ECG risk score performed similarly to the unweighted ECG risk score with C-statistic of 0.760 and NRI of 0.315.
Baseline characteristics and performance of the electrocardiogram risk markers in the ARIC cohort
Baseline characteristics of the ARIC cohort are presented in Supplementary material online, Table S4. Compared with Oregon SUDS participants, the ARIC participants were significantly younger, with fewer individuals having hypertension, diabetes and CAD. Only 1.1% of ARIC participants presented with ≥4 ECG abnormalities at the baseline visit, and those were more likely to have CAD and cardiovascular risk factors than the rest of the study population (see Supplementary material online, Table S5). During the median follow-up of 14.0 years, 260 SCDs occurred [incidence 1.43 (95% CI 1.26–1.61) per 1000 person-years], with a mean ± SD time from the baseline visit and ECG to SCD of 7.2 ± 3.6 years. As the number of abnormal ECG parameters increased from 0 to ≥4, cumulative SCD incidence increased from 0.95% to 6.67% (Figure 2). After adjustments for age, sex, hypertension, and diabetes, participants with ECG risk score of 1 had an HR for SCD of 1.41 (95% CI 0.94–2.13; P = 0.098), those with ECG risk score of 2 had an HR 2.65 (95% CI 1.73–4.07; P < 0.001), and those with ECG risk score of 3 had an HR of 3.86 (95% CI 2.32–6.43; P < 0.001) compared with ECG risk score of zero. Individuals with a high ECG risk score of ≥4 had HR of 4.84 for SCD (95% CI 2.34–9.99; P < 0.001). The C-statistic for the clinical variables (age, sex, hypertension, and diabetes) and ECG risk score together was significantly higher than for the clinical parameters alone (0.774 vs 0.759; P = 0.019).
Figure 2.
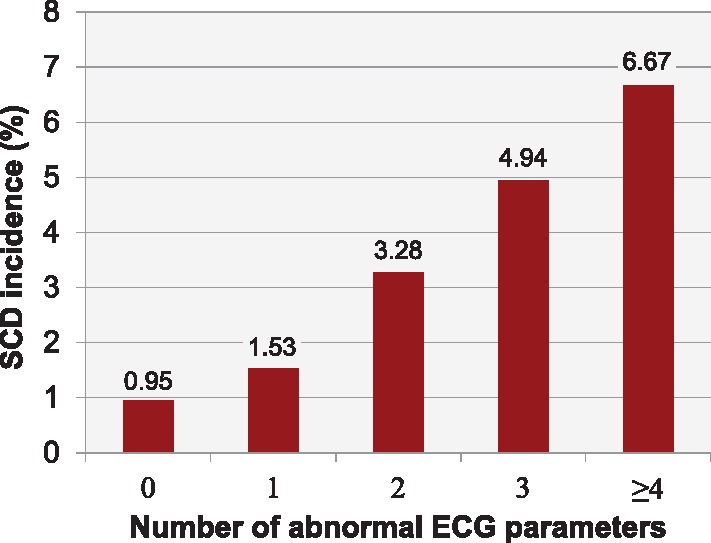
Incidence of sudden cardiac death (SCD) in the ARIC cohort. Observed cumulative incidence of SCD associated with the presence of multiple electrocardiogram (ECG) abnormalities in the ARIC validation cohort during the mean follow-up of 14 years.
Discussion
Our analysis from this large community-based study on SCD revealed several findings. First, we report that combining multiple ECG variables into a cumulative risk score resulted in significant additive improvement in SCD risk estimation. The ECG parameters that remained significant in the final model, namely resting heart rate, LVH, QRS transition zone, QTc interval, QRS-T angle, and Tpeak-to-Tend interval, are relatively easily obtained from the standard 12-lead ECG, making the ECG risk score relevant to clinical practice. Moreover, the ECG risk score remained associated with SCD independent of several known SCD risk factors. These results were replicated in the separate ARIC study, a cohort of community-dwelling adults. Finally, for the first time, this risk score could be evaluated in the context of the LVEF. The findings suggest that especially among subjects with preserved or only moderately reduced LVEF currently lacking effective means of SCD risk stratification, the cumulative effect of several ECG risk markers was a particularly strong predictor of future SCD.
Most of the individual ECG parameters included in the present study were independently associated with a doubling or tripling in odds of SCD. This magnitude of risk may be useful in estimating risk in the population and creating hypotheses for underlying mechanisms, but higher ORs are needed to predict risk in individual subjects. Since these are rarely obtained with a single, even powerful risk marker,18 assessing a combination of multiple risk markers represents a logical next step. In the Oregon SUDS, the presence of ≥4 abnormal ECG markers was associated with ORs of over 20 for SCD, the risk being independent of LV function and multiple clinical characteristics. The high ECG risk score ≥4 appears to be specific for SCD cases, being observed in 16% of SCD cases and only 3% of controls, and may extend SCD risk stratification beyond solely relying on LV function. Based on this study, a particularly interesting target for combining several ECG parameters would be cardiac patients with LVEF >35% who currently lack means of any effective SCD risk stratification. In this group, a high ECG risk score was associated with even greater risk of SCD, suggesting a potential utility of this approach for these patients. There are several potential mechanisms that could explain the relationship between high ECG risk score and SCD. The presence of multiple ECG abnormalities encompassing both depolarization and repolarization phases of the cardiac cycle may reflect more diffuse and complex arrhythmogenic substrates. Furthermore, increased heart rate and QTc prolongation, which carried the highest risk for SCD of the individual ECG parameters in the present study, may be manifestations of cardiac autonomic nervous system dysfunction predisposing to ventricular arrhythmias.9,19 In addition, besides being a general marker of underlying structural heart disease, prolonged QTc interval reflecting abnormally delayed ventricular repolarization is well established as a predictor of increased vulnerability to arrhythmias.11,12
Patients included in the Oregon SUDS were either cases who suffered cardiac arrest or controls that mostly had established, significant CAD. In contrast, the ARIC general population cohort used to independently evaluate the ECG risk score, was free of known heart disease at recruitment, and represented a younger and much lower-risk population; subsequently, multiple ECG abnormalities were observed less often. Furthermore, in the Oregon SUDS we analysed the ECG closest to the cardiac arrest event, in contrast to ARIC where we utilized the baseline recruitment ECG performed 5–10 years prior to the cardiac arrest event. These factors could explain the significant, but attenuated effect of the ECG risk score in ARIC. However, the observed 6.7% incidence of SCD in ARIC (not including survivors of cardiac arrest) associated with the presence of ≥4 abnormal ECG markers during the follow-up remains a significant finding. Taken together, these findings suggest that the ECG risk score is likely to be more useful if deployed among patients with established cardiovascular disease who are at intermediate risk.
Initially, our proposed ECG risk score model included eight ECG variables reflecting different phases of the cardiac electrical cycle. All of these variables have been independently associated with increased risk of SCD, reflecting the underlying myocardial structural and electrical arrhythmia substrate, neural influences or genetic predisposition to SCD.7,9,12,13,20–24 However, when these ECG parameters were combined into a single model, QRS duration and delayed intrinsicoid deflection lost significance and were thus omitted from the final cumulative ECG risk score. While a number of the remaining six ECG parameters were correlated with each other, none were so strongly correlated that they introduced potential multicollinearity into the multivariable model, and each remained associated with SCD. Distinctly abnormal ECG patterns suggestive of specific cardiac pathology such as Q-waves, bundle-branch blocks, ST-T elevation or depression, and atrial fibrillation or atrial flutter were not included in our ECG risk score, but in previous studies these major ECG abnormalities have been independently associated with cardiovascular morbidity and mortality.25,26
Due to the major public health implications of SCD, there has been particular interest in better identifying individuals at high risk before occurrence of the lethal arrhythmia. Most of these attempts to create a risk score for SCD, such as the MUSTT score,27 MADIT-II score,28 and MUSIC risk score,29 have focused on patients with severely reduced LV function or heart failure, who are already known to be at especially high risk of SCD. These risk scores have used a combination of clinical and demographic characteristics combined with imaging findings, some including ECG parameters such as ventricular conduction abnormalities and atrial fibrillation. However, many of these risk scores also predict non-SCD that cannot be prevented by implantable cardioverter-defibrillators, so there has been a search for more specific ways to identify individuals at high risk of ventricular tachyarrhythmias. A prior analysis from the combined cohorts of ARIC and Cardiovascular Health Studies suggested that, of the ECG patterns studied, increased heart rate, prolongation of QTc and T-wave abnormalities were stronger predictors of SCD risk compared with the risk of incident coronary heart disease.30 A recent publication from the same general population cohorts with 486 cases of SCD during the 14-year follow-up extended these observations by demonstrating that ECG markers of myocardial global electrical heterogeneity may be helpful in predicting risk of SCD. When these ECG markers (sum of absolute QRST integral, spatial QRS-T angle, and spatial ventricular gradient) were added to the clinical risk factors, risk prediction for SCD was improved, with an increase in the C-statistic from 0.777 to 0.790.6
Summarizing Figure.

Components of the multi-marker, cumulative electrocardiographic risk score for prediction of sudden cardiac death.
Limitations
Although prospective cohort studies can provide robust evaluation of risk predictors, the low annual incidence of SCD requires very large cohorts to acquire sufficient events, making these studies practically challenging. Additionally, LV function should be considered in any new risk prediction model, and many cohort studies do not provide this information. Consequently, the case-control design employed in the present study is a feasible way to obtain sufficient numbers for analysis. The strengths of the Oregon SUDS include the community-based design, prospective and well-documented ascertainment and adjudication of the SCD cases, detailed life-time clinical history from archived medical records obtained similarly for cases and controls, and the relative proximity of ECG recording to the SCD, which is rarely available in prospective cohort studies with a long follow-up. Although some of the ECG changes such as repolarization abnormalities may be dynamic, the fact that even a remotely obtained ECG risk score has prognostic significance increases the likelihood of meaningful contribution to non-invasive risk stratification well in advance of the SCD event. However, the case-control design of the discovery population has certain limitations. We were able to address some of these by validating the findings in a separate, independent population sample, also acknowledging that ORs from a case-control study cannot be directly compared with HRs obtained from a prospective cohort study. The present analysis was restricted to those with ECG available, leading to some bias in selecting patients at potentially higher risk. This is especially relevant for the subgroup with information on the LV function available. However, patients that are referred for cardiac evaluation represent a clinically attractive subgroup, in which an intervention based on the high ECG risk score would be practically feasible. Selecting appropriate controls is a crucial aspect of any case-control study and could lead to potential biases. In Oregon SUDS, controls were chosen from the same geographical area and had a similar cardiac risk profile as SCD cases, with further adjustments made for residual differences between the groups in the multivariate models; with the goal that any observed differences between the groups would be more specific to SCD.
Conclusions
Integrating multiple widely available ECG parameters into a cumulative risk score resulted in significantly improved SCD risk prediction beyond clinical characteristics and severely reduced LV systolic function. In this patient population with a high burden of cardiovascular risk factors, the presence of a high ECG risk score ≥4 increased odds of SCD by 20, and was particularly effective in the LVEF >35% subgroup where SCD risk stratification tools are currently lacking. When validated in a younger and healthier general population cohort (ARIC), the risk of SCD associated with a high ECG risk score was attenuated but remained highly significant. These results may contribute to improvements in clinical risk stratification for SCD, especially among patients with preserved LVEF. However, further prospective investigations using a combination of electrical as well as other clinical risk markers will be needed to determine an evidence-based approach to SCD prevention.
Supplementary material
Supplementary material is available at European Heart Journal online.
Supplementary Material
Acknowledgements
The authors thank American Medical Response, Portland/Gresham fire departments and the Oregon State Medical Examiner’s office, and the staff and participants of the Oregon SUDS and ARIC studies for their important contributions.
Funding
National Institutes of Health, National Heart Lung and Blood Institute (NHLBI) grants (R01HL122492 and R01HL126938 to S.S.C.). S.S.C. holds the Pauline and Harold Price Chair in Cardiac Electrophysiology at Cedars-Sinai, Los Angeles. A.L.A. is funded by grants from the Paavo Nurmi Foundation, the Finnish Foundation for Cardiovascular Research, the Orion Research Foundation and the Biomedicum Helsinki Foundation. L.G.T. was supported by R01HL118277. The ARIC Study is carried out as a collaborative study supported by NHLBI contracts (HHSN268201100005C, HHSN268201100006C, HHSN268201100007C, HHSN268201100008C, HHSN268201100009C, HHSN268201100010C, HHSN268201100011C, HHSN268201100012C).
Conflict of interest: none declared.
References
- 1. Mozaffarian D, Benjamin EJ, Go AS, Arnett DK, Blaha MJ, Cushman M, Das SR, de Ferranti S, Després J-P, Fullerton HJ, Howard VJ, Huffman MD, Isasi CR, Jiménez MC, Judd SE, Kissela BM, Lichtman JH, Lisabeth LD, Liu S, Mackey RH, Magid DJ, McGuire DK, Mohler ER, Moy CS, Muntner P, Mussolino ME, Nasir K, Neumar RW, Nichol G, Palaniappan L, Pandey DK, Reeves MJ, Rodriguez CJ, Rosamond W, Sorlie PD, Stein J, Towfighi A, Turan TN, Virani SS, Woo D, Yeh RW, Turner MB.. Heart disease and stroke statistics—2016 update: a report from the American Heart Association. Circulation 2016;133:e38–e360. [DOI] [PubMed] [Google Scholar]
- 2. Priori SG, Blomstrom-Lundqvist C, Mazzanti A, Blom N, Borggrefe M, Camm J, Elliott PM, Fitzsimons D, Hatala R, Hindricks G, Kirchhof P, Kjeldsen K, Kuck KH, Hernandez-Madrid A, Nikolaou N, Norekval TM, Spaulding C, Van Veldhuisen DJ; Authors/Task Force M, Document R. 2015 ESC guidelines for the management of patients with ventricular arrhythmias and the prevention of sudden cardiac death. Eur Heart J 2015;36:2793–2867. [DOI] [PubMed] [Google Scholar]
- 3. Chugh SS, Reinier K, Teodorescu C, Evanado A, Kehr E, Al Samara M, Mariani R, Gunson K, Jui J.. Epidemiology of sudden cardiac death: clinical and research implications. Prog Cardiovasc Dis 2008;51:213–228. [DOI] [PMC free article] [PubMed] [Google Scholar]
- 4. Deyell MW, Krahn AD, Goldberger JJ.. Sudden cardiac death risk stratification. Circ Res 2015;116:1907–1918. [DOI] [PMC free article] [PubMed] [Google Scholar]
- 5. Deo R, Norby FL, Katz R, Sotoodehnia N, Adabag S, DeFilippi CR, Kestenbaum B, Chen LY, Heckbert SR, Folsom AR, Kronmal RA, Konety S, Patton KK, Siscovick D, Shlipak MG, Alonso A.. Development and validation of a sudden cardiac death prediction model for the general population. Circulation 2016;134:806–816. [DOI] [PMC free article] [PubMed] [Google Scholar]
- 6. Waks JW, Sitlani CM, Soliman EZ, Kabir M, Ghafoori E, Biggs ML, Henrikson CA, Sotoodehnia N, Biering-Sorensen T, Agarwal SK, Siscovick DS, Post WS, Solomon SD, Buxton AE, Josephson ME, Tereshchenko LG.. Global electric heterogeneity risk score for prediction of sudden cardiac death in the general population: the Atherosclerosis Risk in Communities (ARIC) and Cardiovascular Health (CHS) Studies. Circulation 2016;133:2222–2234. [DOI] [PMC free article] [PubMed] [Google Scholar]
- 7. Wellens HJ, Schwartz PJ, Lindemans FW, Buxton AE, Goldberger JJ, Hohnloser SH, Huikuri HV, Kaab S, La Rovere MT, Malik M, Myerburg RJ, Simoons ML, Swedberg K, Tijssen J, Voors AA, Wilde AA.. Risk stratification for sudden cardiac death: current status and challenges for the future. Eur Heart J 2014;35:1642–1651. [DOI] [PMC free article] [PubMed] [Google Scholar]
- 8. Dyer AR, Persky V, Stamler J, Paul O, Shekelle RB, Berkson DM, Lepper M, Schoenberger JA, Lindberg HA.. Heart rate as a prognostic factor for coronary heart disease and mortality: findings in three Chicago epidemiologic studies. Am J Epidemiol 1980;112:736–749. [DOI] [PubMed] [Google Scholar]
- 9. Jouven X, Empana JP, Schwartz PJ, Desnos M, Courbon D, Ducimetiere P.. Heart-rate profile during exercise as a predictor of sudden death. New Engl J Med 2005;352:1951–1958. [DOI] [PubMed] [Google Scholar]
- 10. Aro AL, Huikuri HV.. Electrocardiographic predictors of sudden cardiac death from a large Finnish general population cohort. J Electrocardiol 2013;46:434–438. [DOI] [PubMed] [Google Scholar]
- 11. Schwartz PJ, Wolf S.. QT interval prolongation as predictor of sudden death in patients with myocardial infarction. Circulation 1978;57:1074–1077. [DOI] [PubMed] [Google Scholar]
- 12. Chugh SS, Reinier K, Singh T, Uy-Evanado A, Socoteanu C, Peters D, Mariani R, Gunson K, Jui J.. Determinants of prolonged QT interval and their contribution to sudden death risk in coronary artery disease: the Oregon Sudden Unexpected Death Study. Circulation 2009;119:663–670. [DOI] [PMC free article] [PubMed] [Google Scholar]
- 13. Panikkath R, Reinier K, Uy-Evanado A, Teodorescu C, Hattenhauer J, Mariani R, Gunson K, Jui J, Chugh SS.. Prolonged Tpeak-to-Tend interval on the resting ECG is associated with increased risk of sudden cardiac death. Circ Arrhythm Electrophysiol 2011;4:441–447. [DOI] [PMC free article] [PubMed] [Google Scholar]
- 14. Reinier K, Narayanan K, Uy-Evanado A, Teodorescu C, Chugh H, Mack WJ, Gunson K, Jui J, Chugh SS.. Electrocardiographic markers and the left ventricular ejection fraction have cumulative effects on risk of sudden cardiac death. JACC Clin Electrophysiol 2015;1:542–550. [DOI] [PMC free article] [PubMed] [Google Scholar]
- 15. Chugh SS, Jui J, Gunson K, Stecker EC, John BT, Thompson B, Ilias N, Vickers C, Dogra V, Daya M, Kron J, Zheng ZJ, Mensah G, McAnulty J.. Current burden of sudden cardiac death: multiple source surveillance versus retrospective death certificate-based review in a large U.S. Community. J Am Coll Cardiol 2004;44:1268–1275. [DOI] [PubMed] [Google Scholar]
- 16. Rautaharju PM, Surawicz B, Gettes LS, Bailey JJ, Childers R, Deal BJ, Gorgels A, Hancock EW, Josephson M, Kligfield P, Kors JA, Macfarlane P, Mason JW, Mirvis DM, Okin P, Pahlm O, van Herpen G, Wagner GS, Wellens H; American Heart Association E, Arrhythmias Committee CoCC, American College of Cardiology F, Heart Rhythm S. AHA/ACC/HRS recommendations for the standardization and interpretation of the electrocardiogram: Part IV: the ST segment, T and U waves, and the QT interval. J Am Coll Cardiol 2009;53:982–991. [DOI] [PubMed] [Google Scholar]
- 17. The Atherosclerosis Risk in Communities (ARIC) study: design and objectives. The ARIC investigators. Am J Epidemiol 1989;129:687–702. [PubMed] [Google Scholar]
- 18. Pepe MS, Janes H, Longton G, Leisenring W, Newcomb P.. Limitations of the odds ratio in gauging the performance of a diagnostic, prognostic, or screening marker. Am J Epidemiol 2004;159:882–890. [DOI] [PubMed] [Google Scholar]
- 19. Diedrich A, Jordan J, Shannon JR, Robertson D, Biaggioni I.. Modulation of QT interval during autonomic nervous system blockade in humans. Circulation 2002;106:2238–2243. [DOI] [PubMed] [Google Scholar]
- 20. Aro AL, Anttonen O, Tikkanen JT, Junttila MJ, Kerola T, Rissanen HA, Reunanen A, Huikuri HV.. Intraventricular conduction delay in a standard 12-lead electrocardiogram as a predictor of mortality in the general population. Circ Arrhythm Electrophysiol 2011;4:704–710. [DOI] [PubMed] [Google Scholar]
- 21. Aro AL, Huikuri HV, Tikkanen JT, Junttila MJ, Rissanen HA, Reunanen A, Anttonen O.. QRS-T angle as a predictor of sudden cardiac death in a middle-aged general population. Europace 2012;14:872–876. [DOI] [PubMed] [Google Scholar]
- 22. Darouian N, Narayanan K, Aro AL, Reinier K, Uy-Evanado A, Teodorescu C, Gunson K, Jui J, Chugh SS.. Delayed intrinsicoid deflection of the QRS complex is associated with sudden cardiac arrest. Heart Rhythm 2016;13:927–932. [DOI] [PMC free article] [PubMed] [Google Scholar]
- 23. Aro AL, Eranti A, Anttonen O, Kerola T, Rissanen HA, Knekt P, Porthan K, Tikkanen JT, Junttila MJ, Huikuri HV.. Delayed QRS transition in the precordial leads of an electrocardiogram as a predictor of sudden cardiac death in the general population. Heart Rhythm 2014;11:2254–2260. [DOI] [PubMed] [Google Scholar]
- 24. Aro AL, Phan D, Teodorescu C, Uy-Evanado A, Reinier K, Gunson K, Jui J, Huikuri HV, Chugh SS.. Cardiac structural and functional profile of patients with delayed QRS transition zone and sudden cardiac death. Europace 2017;19:629–635. [DOI] [PubMed] [Google Scholar]
- 25. Auer R, Bauer DC, Marques-Vidal P, Butler J, Min LJ, Cornuz J, Satterfield S, Newman AB, Vittinghoff E, Rodondi N, Health ABCS.. Association of major and minor ECG abnormalities with coronary heart disease events. JAMA 2012;307:1497–1505. [DOI] [PMC free article] [PubMed] [Google Scholar]
- 26. Jorgensen PG, Jensen JS, Marott JL, Jensen GB, Appleyard M, Mogelvang R.. Electrocardiographic changes improve risk prediction in asymptomatic persons age 65 years or above without cardiovascular disease. J Am Coll Cardiol 2014;64:898–906. [DOI] [PubMed] [Google Scholar]
- 27. Buxton AE, Lee KL, Hafley GE, Pires LA, Fisher JD, Gold MR, Josephson ME, Lehmann MH, Prystowsky EN; Investigators M. Limitations of ejection fraction for prediction of sudden death risk in patients with coronary artery disease: lessons from the MUSTT study. J Am Coll Cardiol 2007;50:1150–1157. [DOI] [PubMed] [Google Scholar]
- 28. Goldenberg I, Vyas AK, Hall WJ, Moss AJ, Wang H, He H, Zareba W, McNitt S, Andrews ML; Investigators M-I Risk stratification for primary implantation of a cardioverter-defibrillator in patients with ischemic left ventricular dysfunction. J Am Coll Cardiol 2008;51:288–296. [DOI] [PubMed] [Google Scholar]
- 29. Vazquez R, Bayes-Genis A, Cygankiewicz I, Pascual-Figal D, Grigorian-Shamagian L, Pavon R, Gonzalez-Juanatey JR, Cubero JM, Pastor L, Ordonez-Llanos J, Cinca J, de Luna AB; Investigators M. The MUSIC risk score: a simple method for predicting mortality in ambulatory patients with chronic heart failure. Eur Heart J 2009;30:1088–1096. [DOI] [PubMed] [Google Scholar]
- 30. Soliman EZ, Prineas RJ, Case LD, Russell G, Rosamond W, Rea T, Sotoodehnia N, Post WS, Siscovick D, Psaty BM, Burke GL.. Electrocardiographic and clinical predictors separating atherosclerotic sudden cardiac death from incident coronary heart disease. Heart 2011;97:1597–1601. [DOI] [PMC free article] [PubMed] [Google Scholar]
Associated Data
This section collects any data citations, data availability statements, or supplementary materials included in this article.