Abstract
While the interplay between neuronal excitability properties and global properties of network topology is known to affect network propensity for synchronization, it is not clear how detailed characteristics of these properties affect spatiotemporal pattern formation. Here we study mixed networks, composed of neurons having type I and/or type II phase response curves, with varying distributions of local and random connections and show that not only average network properties, but also the connectivity distribution statistics, significantly affect network synchrony. Namely, we study networks with fixed networkwide properties, but vary the number of random connections that nodes project. We show that varying node excitability (type I vs type II) influences network synchrony most dramatically for systems with long-tailed distributions of the number of random connections per node. This indicates that a cluster of even a few highly rewired cells with a high propensity for synchronization can alter the degree of synchrony in the network as a whole. We show this effect generally on a network of coupled Kuramoto oscillators and investigate the impact of this effect more thoroughly in pulse-coupled networks of biophysical neurons.
I. INTRODUCTION
Synchronization in complex networks has been studied extensively over the past two decades [1–5]. In the brain, synchronization of neuronal populations has been associated with many brain functions, including attention and memory formation [6–9]. On the other hand, aberrant synchrony is implicated in many pathologies of the brain, such as epilepsy [10], Parkinson’s disease [11,12], and schizophrenia [13], underscoring the need to better understand mechanisms that generate and promote synchronization of neuronal networks.
Generally, the emergence of synchronous spatiotemporal activity patterns may be explained by two broad classes of mechanisms: (i) excitability properties of individual network nodes and (ii) characteristics of network coupling statistics. Neuronal excitability falls into one of two categories, depending on the bifurcation structure observed in the neuron’s transition to firing. In type I neurons, repetitive spiking is initiated by a saddle node on an invariant cycle bifurcation. These neurons act as integrators, with firing frequency increasing sharply from the arbitrarily low levels observed at firing threshold, and they exhibit a low propensity for synchrony when coupled by excitation. Type II neurons transition to firing through an Andronov-Hopf bifurcation, leading to a discontinuous and shallow frequency-current curve, and higher propensity for synchronization when coupled together [14–17]. Generally, these excitability types result in different profiles of the neuronal phase response curve (PRC), which captures the neuronal response to brief stimulation [18–20]. Usually, type I cells exhibit exclusively phase advances in response to excitatory stimuli arriving at different times during the firing cycle, while type II cells display both phase delays and advances. Experimental results show that both of these cell types are present in the brain, with some neurons capable of switching types [21].
Different frameworks for network connectivity have been used to investigate the influence of network topology upon neuronal synchronization [22]. Among these frameworks, small-world and scale-free architectures have been widely used. The small-world regime is defined as having a high clustering coefficient and small path length [23–26]. The Watts-Strogatz model uses a single parameter, the rewiring probability, to transition between a locally connected network, through the small-world regime to a completely random network [23]. The scale-free architecture introduces highly interconnected neurons called hub cells, which have been shown to orchestrate synchrony in experimental models of epilepsy [27–29]. A derivative of the latter is the “rich club” structure [30–34] in which hub cells are interconnected among themselves. We have shown in previous work that feedback between neuronal excitability type and network structure dramatically influence network synchrony [35]. Namely, we showed that type II networks synchronize to much higher degree than their identical type I counterparts. Recently we have also shown that in scale-free networks with mixed type I and type II cells, synchronization is enhanced by placing type II cells (rather than type I cells) as hubs [36].
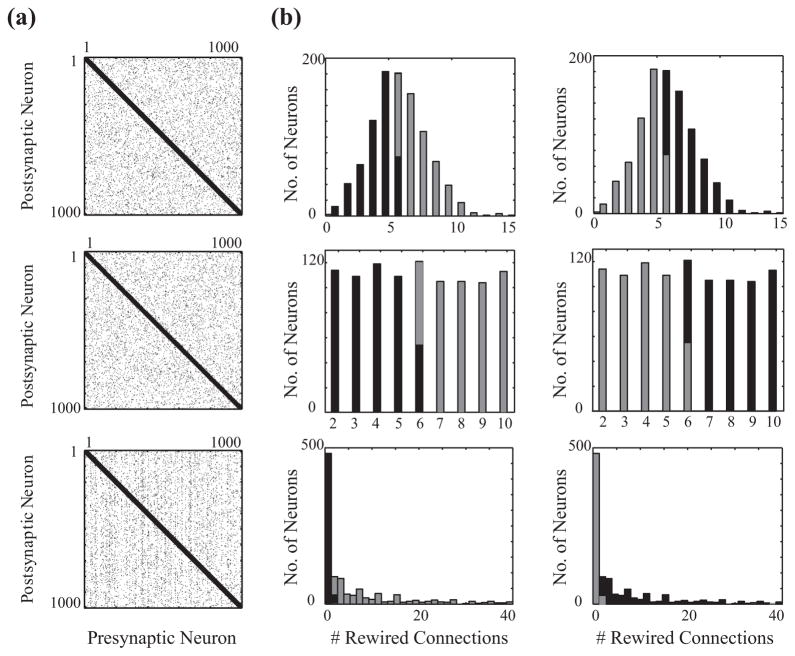
In the case of small-world connectivity, the network properties are assessed globally for the whole system, whether through estimation of mean path length and clustering coefficient or rewiring probability. Here we introduce a Watts-Strogatz type of small-world model having heterogeneous structure in which each cell is assigned an individual rewiring probability. We vary distribution statistics (i.e., we use exponential, Poisson, and uniform distributions) of these rewiring probabilities, but constrain the average networkwide rewiring probability to be constant (Fig. 1). We then compare the effect of interactions between placement of node excitability type and statistics of network connectivity structure. Namely, we compare the case in which highly rewired (HRW) nodes have type I excitability with the opposite case, in which highly rewired nodes are type II. We perform this comparison in a system of continuously coupled Kuramoto oscillators [37–39] and in networks of pulse coupled biophysical model neurons. Our results show that, generally, networks in which type II cells have a large number of rewired connections synchronize much better than those in which type I cells are highly rewired. However, the degree of synchronization depends on the distribution of rewired connections per cell. Specifically, we show that distributions with a relatively longer tail of rewired connections per cell, such as an exponential distribution in our case, can increase the propensity for network synchronization, depending on excitability type, indicating that a few highly rewired cells may drive synchrony in a network as a whole. Finally, we investigate the effect of forming clusters among the highly rewired cells, or rich clubs, and show that interconnecting the most highly rewired cells enhances synchronous dynamics when such cells are type II, but not when they are type I. These results indicate that the distribution of structural heterogeneities within the network is an important factor in spatiotemporal pattern formation and that relatively few preferentially connected nodes can drive networkwide synchrony.
FIG. 1.
(a) Examples of connectivity matrices for three different distributions of rewiring probability of individual cells. (b) Histograms of the number of neurons with a specific number of rewired connections for the standard Poisson (top row), uniform (middle row), and exponential (bottom row) rewiring distributions for type I (left column) and type II highly rewired scenarios (right column) for a mixed network of 50% type I and 50% type II cells. In the type I highly rewired scenario (left column), neurons with the higher number of rewired outgoing connections have type I excitability characteristics (light gray bars), while in the type II highly rewired scenario (right column) type II neurons have a higher number of rewired outgoing connections (black bars).
II. CONTINUOUSLY COUPLED KURAMOTO OSCILLATORS
We first investigate the impact of connectivity distributions and excitability type on spatiotemporal pattern formation in a system of continuously coupled Kuramoto oscillators. Here the phase dynamics are governed by
| (1) |
where ωi is the natural frequency of the ith oscillator, G is the connectivity matrix, and K denotes the phase coupling function. We modify the phase coupling to be able to continuously change the phase response curve:
| (2) |
Depending on the parameter u, oscillators continuously transition from type I to type II PRC.
The networks are composed of 1000 oscillators with 4% connectivity (40 outgoing connections per node), situated in a one-dimensional ring with periodic boundary conditions. In the standard Watts-Strogatz small-world connectivity paradigm, each synaptic connection is assigned the same rewiring probability, which determines whether its target will remain a neighboring cell or be rewired to a random target cell in the network (independent of their distance). This paradigm results in an approximately Poisson distribution for the number of rewired outgoing connections per neuron (Fig. 1, top row). Here we modify the standard Watts-Strogatz connectivity (where every connection in the network is rewired with predefined probability) by first specifying the global rewiring fraction within the network (P) and consequently the total number of rewired connections. We then employ a specified distribution to assign the number of rewired connections projecting from each individual neuron. We use three different distributions: (a) a no variance distribution, in which all neurons shared the same number of rewired connections, (b) a uniform distribution with a defined average and fixed variance (Fig. 1, middle row), and (c) an exponential distribution (Fig. 1, bottom row). We then compare these connectivity paradigms with conventional small-world topology, which has a Poisson distribution of rewired connections per cell.
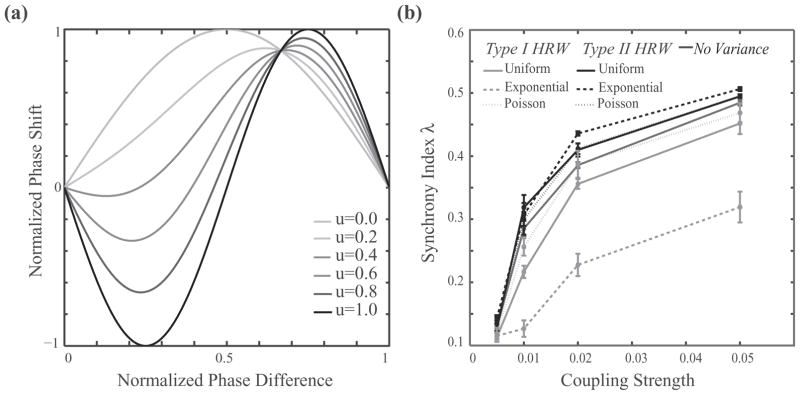
We define two equally sized populations of nodes having a type I PRC (u = 0.0) or a type II PRC (u = 1.0) [Fig. 2(a)] and subsequently study network spatiotemporal patterning for two cases: (i) when type I oscillators had highly rewired connections and (ii) when type II oscillators were highly rewired. We measure the change in synchrony for varying coupling strength A.
FIG. 2.
Synchrony in a heterogeneous network of type I and type II coupled Kuramoto oscillators (N = 1000). (a) Corresponding PRC for different values of the parameter u that switches the synchronization properties of the Kuramoto oscillators. (b) Synchrony index as a function of coupling strength for various distributions of rewiring probability of nodal connections: no variance (dark gray solid line), uniform distribution (solid lines), Poisson distribution (dotted lines), and exponential distribution (dashed lines). Type I highly rewired (type I HRW) nodes are shown in light gray, type II HRW in black. The average networkwide rewiring probability is p = 0.15.
We measure synchrony using the so-called synchrony index defined in [40]. The measure is based on the calculation of the mean population-averaged fluctuations over an extended period of time, normalized to the average of individual neurons’ fluctuations. In order to calculate the synchrony index λ from spike timings, they are convolved with a Gaussian (here we use a 2-ms width; the obtained results are not dependent on the Gaussian width), averaged across all neurons at each time point, and the variance across time is computed ( ). The variances of individual neuronal voltage traces across time are computed and then averaged over all neurons ( ). Namely, λ is then computed as
| (3) |
where λ is bounded between 0 and 1, zero for asynchronous dynamics and one for complete synchrony across the network.
We generally observe a change in degree of synchrony when type II nodes are highly rewired, with overall synchrony increasing with coupling strength [Fig. 2(b)]. However, by far, the largest change in the degree of synchrony is observed when the rewiring probabilities are drawn from an exponential distribution [Fig. 2(b), black (light gray) dashed line].
III. NETWORK OF PULSE COUPLED NEURONS
We next investigate the impact of this result in networks of pulse-coupled biophysical model neurons. We employ a Hodgkin-Huxley-type neuronal model with a fast inward Na+ current, a delayed rectifier K+ current, and a leakage current. Cholinergic modulation has been experimentally shown to switch the PRCs of cortical neurons from type II to type I [21]. This effect is known to be driven by a slow M-type K+ current (gated by gKs) responsible for spike frequency adaptation [41]. The equation governing neuronal dynamics is given by
| (4) |
where C = 1.0μF/cm2 and is the synaptic current. The synaptic current from neuron j to i is governed by
| (5) |
where tj is the spike time of neuron j, W is the synaptic strength that was kept constant for all the connections, and we fixed τ = 0.5 ms and Esyn = 0mV. In addition, I drive is an externally applied current that remains constant for each neuron within a simulation, but depending on the heterogeneity level needed for each simulation, the spread of external current across neurons is set appropriately. In all the simulations in this paper, except Fig. 7, the I drive is set to generate an average of 15 Hz with a frequency spread of 26.6% type I:I drive = 0.158 ± 0.038, type II:I drive = 1.22 ± 0.18. For the results presented in Fig. 7 the frequency spread changes from 0% (0Hz) to 52% (8 Hz): For type I, I drive = 0.158 ± 0.076, and for type II, I drive = 1.22 ± 0.37. The value of constant parameters used in this model are the same for both type I and type II neurons except gKs, which is gKs = 0.1 mS/cm2 for type I and gKs = 0.8mS/cm2 for type II neurons: gNa = 24.0mS/cm2, gKdr = 3.0mS/cm2, gL = 0.02mS/cm2, VNa = 55.0mV, VK = −90.0mV, and VL = −60.0mV.
FIG. 7.
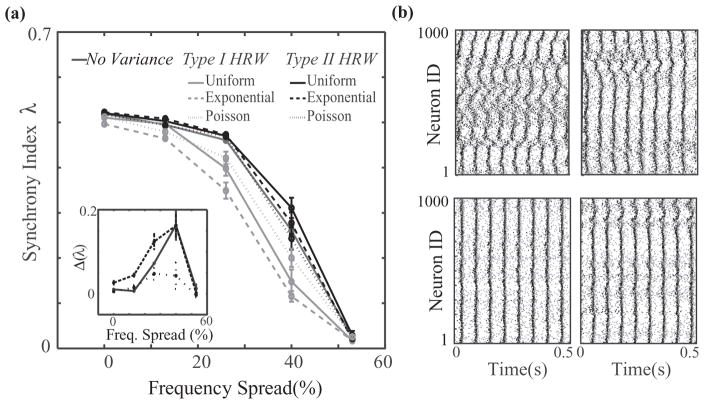
Synchrony as a function of heterogeneity in intrinsic neuron firing frequencies. (a) Synchrony of a mixed network of 50% type I and 50% type II neurons as a function of the percent spread around a mean neuronal firing frequency of 15 Hz for no variance and uniform, Poisson, and exponential rewiring distributions for type I HRW (light gray curves) and type II HRW (black curves) scenarios. These networks had a global rewiring fraction of P = 0.15 and synaptic weights of 0.01mS/cm2. The inset shows the difference between synchrony index values of type I and type II HRW scenarios (solid line, uniform distribution; dashed line, exponential distribution; dotted line, Poisson distribution). (b) Raster plots for type I HRW (top row) and type II HRW (bottom row) scenarios for exponential (left column) and Poisson (right column) rewiring distributions with a 40% frequency spread.
In Eq. (4) m∞ and h are responsible for activation and inactivation of the Na current and their dynamics are governed by m∞(V) = 1/(1 + e(−V −30.0)/9.5) and dh/dt = αh[h∞(V) − h]/τh(V), with h∞(V) = 1/(1 + e(V+53.0)/7.0) and τh(V) = 0.37 + 2.78/(1 + e(V+40.5)/6.0). The dynamics of the gating variable for the delayed rectifier potassium current is given by dn/dt = [n∞(V) − h]/τn(V), with n∞(V) = 1/(1 + e(−V−30.0)/10.0) and τn(V) = 0.37 + 1.85/(1 + e(V+27.0)/15.0). Finally, the gating variable for the slow M-type potassium current is governed by ds/dt = αs [s∞(V) − s]/75.0 and s∞(V) = 1/(1 + e(−V−39.0)/5.0). The parameter values are adopted from [41] and are established experimentally.
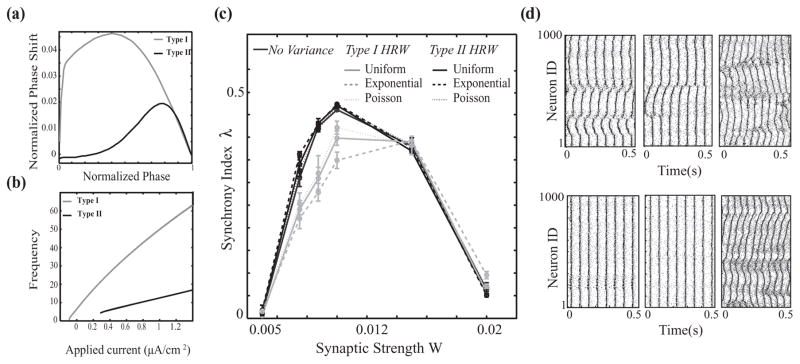
We model the acetylcholine-mediated change in the PRC by decreasing gKs from 0.8 to 0.1mS/cm2. This mimics the effect of acetylcholine in switching the neuronal PRC from type II to type I [21]. Figure 3(a) depicts the PRC for these two cases, calculated using the following equation:
| (6) |
where θ is the phase at which the input is received, Toriginal is the period of the unperturbed oscillator, Tperturbed is the duration of the spike cycle during which the input is received, and Δ can be positive (phase advance) or negative (phase delay).
FIG. 3.
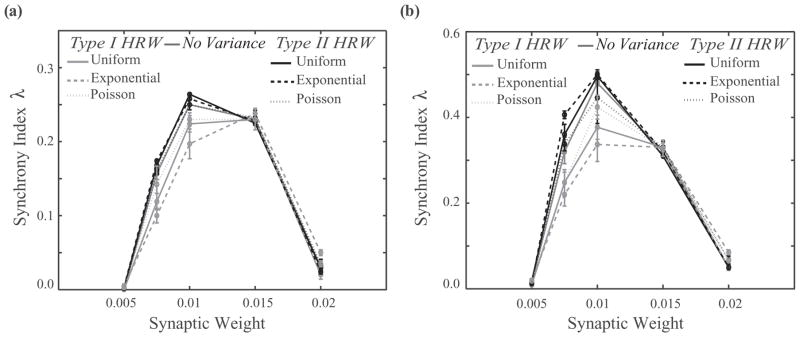
Network of pulse coupled neurons. (a) and (b) Phase response curves and frequency-current curves for type I (gKs = 0.1mS/cm2, light gray curves) and type II (gKs = 0.8mS/cm2, black curves) neurons. (c) Synchrony in a heterogeneous network of type I (50%) and type II (50%) neurons as a function of synaptic strength for no variance (dark gray solid line) and uniform (solid lines), Poisson (dotted lines), and exponential (dashed lines) distributions for the type I highly rewired (type I HRW, light gray curves) and type II highly rewired (type II HRW, black curves) scenarios. The networks in these simulations have a global rewiring fraction of P = 0.15 and cellular frequency distribution of 15 ± 2 Hz. (d) Examples of raster plots (light gray circles, type I neurons; black circles, type II neurons) for exponential distribution networks with synaptic strengths of (a) and (b) W = 0.0075mS/cm2, (c) W = 0.01 mS/cm2, and (d) W = 0.02mS/cm2 in the type I HRW (top row) and type II HRW (bottom row) scenarios.
We consider networks composed of 1000 excitatory cortical pyramidal cells with the same connectivity as in the coupled Kuramoto system described above. For the majority of our results, we set the total number of rewired connections, or global rewiring fraction P, to 15% (which essentially corresponds to a rewiring probability of p = 0.15 in the standard Watts-Strogatz connectivity paradigm). As before, we construct networks of excitatory cells with mixed 50%-50% type I and type II excitability properties.
As in the case of the Kuramoto network, to investigate the interplay between the statistics of network structure and cellular excitability in generating network dynamics, we compare two different regimes: (a) type I HRW, in which neurons with higher numbers of rewired connections are selectively assigned type I excitability and those with lower numbers of rewired connections are assigned type II excitability [Fig. 1(b), left column], and (b) type II HRW, in which neurons with higher numbers of rewired connections are selectively assigned type II excitability and those with fewer rewired connections are type I [Fig. 1(b), right column]. We first compare [Fig. 3(c)] network synchrony (using synchrony index as above) for each connectivity distribution for the two cases of type IHRW(light gray curves) and type II HRW (black curves), as a function of synaptic strength W. For all connectivity architectures, the type II HRW networks exhibit significantly higher synchrony in comparison with the type I HRW networks. However, the largest difference in synchrony for type II HRW versus type I HRW regimes occur for the exponential distribution, which has the widest range of ratios of rewired to local connections across cells. In this regime, the excitability type of the few neurons that have all or most of their connections rewired results in dramatically different network dynamics. As shown in the raster plots of Fig. 3(d) (left and middle columns), network synchrony is visibly increased when the highly rewired cells have type II excitability. Further, increases in the synaptic strength W drive both type I HRW and type II HRW networks out of synchrony [Fig. 3(d), right column]. This is primarily due to the mismatch of type I and type II firing responses to increased excitation, dictated by their disparate F–I curves, as well as a transition to bursting.
To check whether the observed increase in synchrony is solely due to higher synchronization only among the type II cells, we separately measure the synchrony index in each population for the two cases [Figs. 4(a) and 4(b)]. The increase of synchrony is more pronounced for the type II neurons when they are highly rewired [Fig. 4(b)], but is also observed for the type I neurons for the same case [Fig. 4(a)]. This indicates that type II neurons can lead both populations of neurons to synchronous activity, whereas if type I neurons have more long-distance connections, they attenuate the emergence of synchronous spatiotemporal patterns.
FIG. 4.
Synchronization characteristics of type I and type II subpopulations. (a) Synchrony in a heterogeneous network of type I (50%) and type II (50%) neurons within type I cell group. (b) Synchrony within type II cells as a function of synaptic weight. Synchrony increases within both populations when the type II population is highly rewired, indicating that type II cells mediate synchrony within the whole network. The networks in these simulations have a global rewiring fraction of P = 0.15 and cellular frequency distribution of 15 ± 2 Hz.
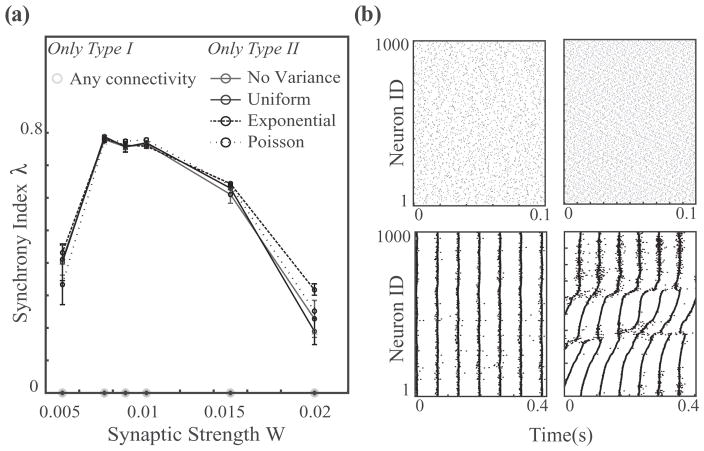
In contrast to these mixed cell networks, the dynamics of homogeneous networks composed solely of either type I or type II neurons (Fig. 5) are much less sensitive to variations in network connectivity architecture. Figure 5(a) displays the synchrony index for homogeneous networks of type I and type II neurons as a function of synaptic weight W for Poisson, uniform, exponential, and no variance rewiring distributions. The homogeneous type I networks show no signs of synchrony for any of the connectivity paradigms (light gray line along bottom axis). On the other hand, type II networks show a significant tendency to synchronize, and increasing coupling strength leads to highly synchronous dynamics in all connectivity frameworks. Again, an extreme increase in the synaptic weight drives the network dynamics out of synchrony, in agreement with previous results showing that increasing the firing rate of type II neurons leads to the disappearance of the phase delay region of the PRC, adversely affecting network synchrony [36].
FIG. 5.
Synchrony in homogeneous networks of type I and II neurons as a function of synaptic weight. (a) Type I networks display highly asynchronous dynamics for all connectivity paradigms and for synaptic weights as high as W = 0.02mS/cm2. Homogeneous networks of type II neurons, however, readily synchronize for small and intermediate synaptic strengths. (b) Raster plots of network activity for type I (top row) and type II (bottom row) networks with synaptic strengths of W = 0.0075mS/cm2 (left column) and W = 0.02 mS/cm2 (right column). Note the different time scales. Here the exponential connectivity paradigm was employed, with the same parameters for type I and type II simulations (P = 0.15 and intrinsic cell frequency 15 ± 2Hz).
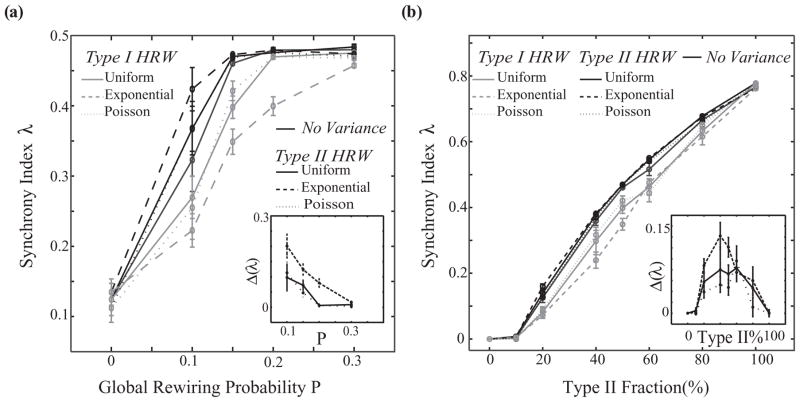
These divergent effects on network synchrony are due to the interplay between individual neuronal properties and network architecture and are robust for low values of global rewiring fraction P and for different fractions of cell types in the network. As illustrated in Fig. 6(a), the difference between type I HRW and type II HRW scenarios (inset) is greatest for small values of global rewiring fraction, namely, P = 0.1–0.2, which corresponds to the small-world network regime. As P increases further, synchrony increases overall and the differences across connectivity distributions decrease due to the introduction of many rewired connections. When the fraction of type II cells in the network is varied from 50% [Fig. 6(b)], differences in network synchronization remain between the type I and type IIHRW scenarios, with the greatest differences occurring when less than half of the cells are type II (inset).
FIG. 6.
Synchrony as a function of global rewiring fraction and type II fraction. (a) Synchrony of a mixed network of 50% type I and 50% type II neurons as a function of global rewiring fraction P for no variance and uniform, Poisson, and exponential distributions for both type I HRW (light gray curves) and type II HRW (black curves) scenarios. (b) Synchrony for a mixed network of type I and type II neurons, for different fractions of type II neurons, where 0% type II is a homogeneous type I network and 100% is a homogeneous type II network (P = 0.15). (a) and (b) Insets show the differences between synchrony index values for type II HRW and type I HRW scenarios in the different rewiring distributions (solid line, uniform; dashed line, exponential; dotted line, Poisson). In all these simulations the intrinsic cell frequency was 15 ± 2Hz, with synaptic weight W = 0.01 mS/cm2.
We also examine the influence of heterogeneity in intrinsic cellular firing frequency on the difference in network synchrony between the type II HRW and type I HRW scenarios (Fig. 7). While the mean neuronal firing frequency remains 15 Hz, we vary its spread around that value. When heterogeneity is low, networks tend to synchronize regardless of their connectivity structure, but by increasing the heterogeneity, type II HRW networks maintain synchronization, while it quickly degrades in type I HRW networks. The greatest difference between scenarios occurs for a range of 12–18 Hz (spread of 40%) in intrinsic cellular frequencies for networks with the exponential and Poisson rewiring distributions, as shown in the raster plots in Fig. 7(b). For larger heterogeneity in firing frequencies, networks in either the type I or type II HRW scenarios are not able to synchronize.
IV. SYNCHRONY IN NETWORKS WITH HIGH CONNECTIVITY CLUSTERS
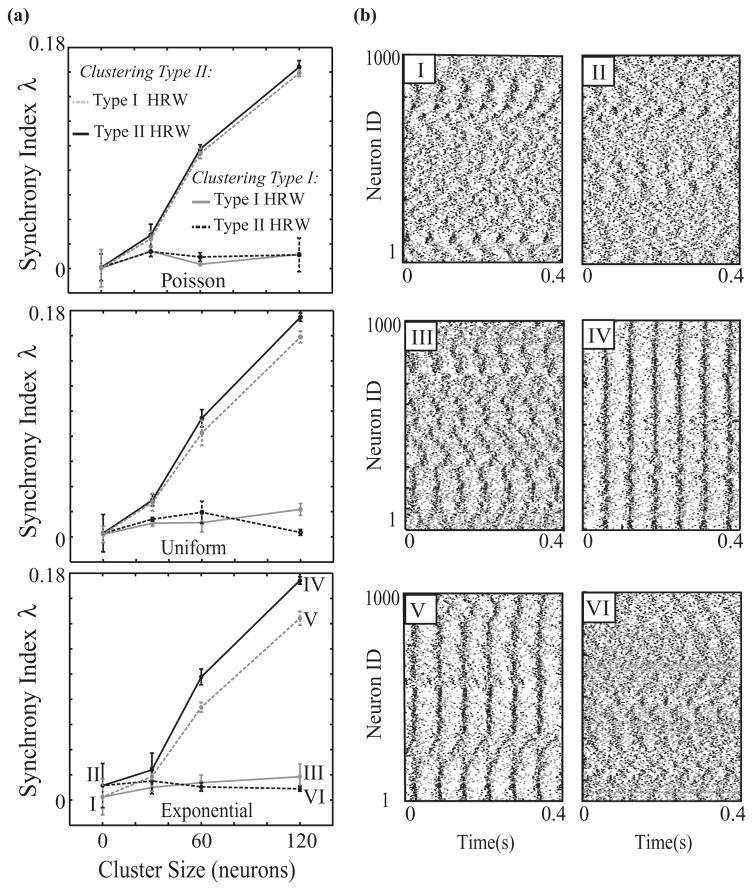
We also investigate the effects on network synchrony when clusters among either highly rewired type I cells or highly rewired type II cells are formed (Fig. 8). We create clusters among the top fractions of highly rewired neurons by interconnecting all neurons within that group. Here we set the synaptic strength to be such that both types of networks, type I HRW and type II HRW, do not show significant synchrony (W = 0.005mS/cm2 [Fig. 8(b), panels I and II]). We then add connections between different fractions of the most highly rewired neurons. In type I HRW networks, interconnecting up to 12% of the most highly rewired cells does not appreciably change the degree of synchrony in the system [Fig. 8(a), light gray curves, and Fig. 8(b), panel III]. In type II HRW networks, however, even a small fraction of additional connections among the most rewired cells increases network synchronization [Fig. 8(a), black curves, and Fig. 8(b), panel IV]. Thus, these results indicate that a cluster consisting of a few type II neurons with long-distance connections can drive network dynamics toward synchrony, while a similar connectivity structure involving type I neurons does not facilitate the emergence of synchronous activity. To explore whether the emergence of synchrony is due to interconnecting type II neurons, regardless of their connectivity, or whether their long-range connections make a difference, we perform simulations in which we form clusters among type II or type I neurons with the lowest number of rewired connections [Fig. 8(a), green and purple curves, respectively]. Synchronization increases with the formation of clusters among type II cells in the uniform distribution networks and particularly in the exponential distribution networks, but higher synchronization is exhibited when the clustered cells are highly rewired. In particular, in the exponential distribution networks, forming a cluster of minimally rewired type II neurons results in the formation of domains of local synchronous activity [Fig. 8(b), panel V], but the overall level of synchrony is lower as compared to the case when the most highly rewired type II neurons form a cluster [Fig. 8(b), panel IV]. Interconnecting minimally rewired Type I neurons in a cluster does not affect synchrony [Fig. 8(a), purple curves], as expected from the lack of effect of clusters of highly rewired type I neurons. These results show that the excitability type of the neurons within a cluster and the statistics of their connectivity play an important role in facilitating the emergence of global synchrony.
FIG. 8.
Synchrony in networks with high connectivity clusters. (a) Synchronization of mixed networks of 50% type I and 50% type II cells with P = 0.15 and W = 0.005mS/cm2. Here we interconnected a fraction of the most highly rewired or least rewired neurons to form connected clusters in the Poisson (top panel), uniform (middle panel), and exponential (bottom panel) distributions for the type I HRW and type II HRW cases. (b) Example raster plots for exponential distribution networks in the type I HRW (left column) and type II HRW (right column) scenarios before the cluster is formed (top row), with a cluster consisting of the top 12% of highly rewired neurons (middle row), and with a cluster consisting of the lowest 12% of rewired neurons (bottom row) (panel numbers I–VI correspond to labeled points on curves in bottom panel of (a).
V. DISCUSSION
In this study we have explored the interaction between excitability properties and local connectivity characteristics of individual nodes in affecting network synchronization. Namely, we investigated how the effects of structural network heterogeneities coupled with varying nodal dynamics can lead to modifications in network-wide activity patterns. We studied this phenomenon for a system of continuously coupled Kuramoto oscillators and investigated its impact in networks of pulse-coupled biophysical model neurons. For Kuramoto oscillators, we modified the phase coupling to model a continuous switch from type I to type II coupling responses. In the neuronal networks, we varied activation of the muscarinic receptor, which is known to mediate the transition between type I and type II PRCs. The results are largely the same for both systems. The nodes in the network were allowed to have varying numbers of rewired connections, while at the same time their excitability exhibited type I or type II characteristics. We varied the network distributions of rewired connections per node among Poisson, uniform, and exponential distributions. We showed that highly rewired nodes of type II excitability facilitate increased levels of networkwide synchrony. They form a distributed backbone in the network, driving other nodes toward synchrony. This effect was exacerbated in the rewiring distribution having the longest tail (namely, the exponential distribution). This distribution exhibited the greatest change in synchrony when the excitability type of the nodes with the highest numbers of rewired connections was changed from type I to type II. This indicates that relatively few highly rewired type II cells can significantly increase the level of networkwide synchrony. However, increased synchronization is not realized when these highly rewired nodes have type I excitability.
In the neuronal networks, the effect of a small population of highly rewired type II cells on synchrony was further exacerbated when we allowed these highly rewired type II cells to form connected clusters. In this case even a small type II cluster, irrespective of whether it was formed from highly rewired cells or minimally rewired cells, drove a significant increase in networkwide synchrony. For exponential distribution networks, the difference in improved synchronization induced by clusters of highly rewired compared to minimally rewired type II cells was greatest, reflecting the large differential in the number of rewired connections per cell at either end of the distribution.
Thus, our results indicate that heterogeneity in cellular connectivity and subsequently not only the first moment but also the second moment of connectivity statistics are important for spatiotemporal pattern formation in the network. This result may have significant implications for characterizing real-world network connectivity patterns, since often connectivity statistics are known only for a few identified cells. We have shown that relatively few cells of specific dynamical and connectivity properties can significantly change spatiotemporal patterning.
We note that our neuronal networks were limited only to excitatory cells. We have previously shown, however, that general differences between type I and type II network synchronizability remain unchanged with the addition of inhibitory cells to the network [35]. The one-dimensional topology on which we base our networks is also clearly unrealistic, but again the general synchrony results are known to hold for higher-dimensional systems. Furthermore, the addition of connection shortcuts makes the notion of initial dimensionality largely irrelevant.
The results of this study may be pertinent for the modulation of neuronal excitability in the brain during sleep and wake states. It has been shown that the intrinsic excitability of neurons can be modulated by acetylcholine levels [21]: High levels of acetylcholine (ACh), during waking and rapid eye movement sleep, drive neuronal excitability towards type I behavior, while the absence of ACh during slow wave sleep pushes excitability towards type II. We show that relatively few neurons expressing receptors that are sensitive to ACh levels can dramatically change networkwide dynamics.
The synchronizing role of the type II clusters maybe also be important to understanding pathological brain activity. It has been shown that upon an injury to the dentate gyrus, its circuits undergo architectural rearrangements, which include formation of recurrent connections among excitatory granule cells. These changes make its circuit hyperexcitable and prone to generating epileptic seizures [42–44]. Morgan and Soltesz showed that even by keeping the number of connections constant throughout the network while assigning more connections to a few granule cells and interconnecting these hubs can create a circuit with hyperexcitable characteristics prone to generating seizure like activity [45]. Our results suggest that seizure promotion by this mechanism would be strengthened if the interconnected cells had type II excitability properties.
Acknowledgments
This work was supported in part by NIH NIBIB Grant No. EB018297 (M.R.Z. and V.B.), NSF Grant No. PoLS 1058034 (M.R.Z.), NSF Grant No. DMS-1412119 (V.B.), and NIH NINDS Grant No. R01-NS094399 (C.F.).
References
- 1.Boccaletti S, Latora V, Moreno Y, Chavez M, Hwang DU. Phys Rep. 2006;424:175. [Google Scholar]
- 2.Assenza S, Gutiérrez R, Gómez-Gardeñes J, Latora V, Boccaletti S. Sci Rep. 2011;1:99. doi: 10.1038/srep00099. [DOI] [PMC free article] [PubMed] [Google Scholar]
- 3.Yu S, Huang D, Singer W, Nikolić D. Cereb Cortex. 2008;18:2891. doi: 10.1093/cercor/bhn047. [DOI] [PMC free article] [PubMed] [Google Scholar]
- 4.Uhlhaas PJ, Singer W. Neuron. 2006;52:155. doi: 10.1016/j.neuron.2006.09.020. [DOI] [PubMed] [Google Scholar]
- 5.Arenas A, Diaz-Guilera A, Kurths J, Moreno Y, Zhou C. Phys Rep. 2008;469:93. [Google Scholar]
- 6.Steinmetz PN, Roy A, Fitzgerald PJ, Hsiao SS, Johnson KO, Niebur E. Nature (London) 2000;404:187. doi: 10.1038/35004588. [DOI] [PubMed] [Google Scholar]
- 7.Fries P, Reynolds JH, Rorie AE, Desimone R. Science. 2001;291:1560. doi: 10.1126/science.1055465. [DOI] [PubMed] [Google Scholar]
- 8.Fell J, Klaver P, Lehnertz K, Grunwald T, Schaller C, Elger CE, Fernández G. Nat Neurosci. 2001;4:1259. doi: 10.1038/nn759. [DOI] [PubMed] [Google Scholar]
- 9.Rutishauser U, Ross IB, Mamelak AN, Schuman EM. Nature (London) 2010;464:903. doi: 10.1038/nature08860. [DOI] [PubMed] [Google Scholar]
- 10.Jiruska P, de Curtis M, Jefferys JGR, Schevon CA, Schiff SJ, Schindler K. J Physiol. 2013;591:787. doi: 10.1113/jphysiol.2012.239590. [DOI] [PMC free article] [PubMed] [Google Scholar]
- 11.Goldberg JA, Rokni U, Boraud T, Vaadia E, Bergman H. J Neurosci. 2004;24:6003. doi: 10.1523/JNEUROSCI.4848-03.2004. [DOI] [PMC free article] [PubMed] [Google Scholar]
- 12.Wichmann T, Delong MR, Guridi J, Obeso JA. Movement Disord. 2011;26:1032. doi: 10.1002/mds.23695. [DOI] [PMC free article] [PubMed] [Google Scholar]
- 13.Uhlhaas PJ, Singer W. Nat Rev Neurosci. 2010;11:100. doi: 10.1038/nrn2774. [DOI] [PubMed] [Google Scholar]
- 14.Izhikevich EM. Dynamical Systems in Neuroscience. MIT Press; Cambridge: 2007. [Google Scholar]
- 15.Fink CG, Booth V, Zochowski M. PLoS Comput Biol. 2011;7:1. doi: 10.1371/journal.pcbi.1002062. [DOI] [PMC free article] [PubMed] [Google Scholar]
- 16.Marella S, Ermentrout GB. Phys Rev E. 2008;77:041918. doi: 10.1103/PhysRevE.77.041918. [DOI] [PubMed] [Google Scholar]
- 17.Achuthan S, Canavier CC. J Neurosci. 2009;29:5218. doi: 10.1523/JNEUROSCI.0426-09.2009. [DOI] [PMC free article] [PubMed] [Google Scholar]
- 18.Ermentrout GB. Neural Comput. 1996;8:979. doi: 10.1162/neco.1996.8.5.979. [DOI] [PubMed] [Google Scholar]
- 19.Rinzel J, Ermentrout GB. In: Methods Neuronal Modelling: From Synapses to Networks. Koch C, Segev I, editors. MIT Press; Cambridge: 1989. p. 251. [Google Scholar]
- 20.Gutkin BS, Ermentrout GB, Reyes AD. J Neurophysiol. 2005;94:1623. doi: 10.1152/jn.00359.2004. [DOI] [PubMed] [Google Scholar]
- 21.Stiefel KM, Gutkin BS, Sejnowski TJ. PLoS ONE. 2008;3:e3947. doi: 10.1371/journal.pone.0003947. [DOI] [PMC free article] [PubMed] [Google Scholar]
- 22.Papo D, Buldú JM, Boccaletti S, Bullmore ET. Complex network theory and the brain. Phil Trans R Soc B. 2014;369:20130520. doi: 10.1098/rstb.2013.0520. [DOI] [PMC free article] [PubMed] [Google Scholar]
- 23.Watts DJ, Strogatz SH. Nature (London) 1998;393:440. doi: 10.1038/30918. [DOI] [PubMed] [Google Scholar]
- 24.Li C, Chen G. Phys Rev E. 2003;68:052901. doi: 10.1103/PhysRevE.68.052901. [DOI] [PubMed] [Google Scholar]
- 25.Yuan WJ, Luo XS, Yang RH. Chin Phys Lett. 2007;24:3. [Google Scholar]
- 26.Fang H, Qi-Shao L, Marian W, Quan-Bao J. Chin Phys B. 2009;18:482. [Google Scholar]
- 27.Barabási AL, Albert R. Science. 1999;286:509. doi: 10.1126/science.286.5439.509. [DOI] [PubMed] [Google Scholar]
- 28.Bonifazi P, Goldin M, Picardo MA, Jorquera I, Cattani A, Bianconi G, Represa A, Ben-Ari Y, Cossart R. Science. 2009;326:1419. doi: 10.1126/science.1175509. [DOI] [PubMed] [Google Scholar]
- 29.Beggs JM, Plenz D. J Neurosci. 2003;23:11167. doi: 10.1523/JNEUROSCI.23-35-11167.2003. [DOI] [PMC free article] [PubMed] [Google Scholar]
- 30.van den Heuvel MP, Sporns O. J Neurosci. 2011;31:15775. doi: 10.1523/JNEUROSCI.3539-11.2011. [DOI] [PMC free article] [PubMed] [Google Scholar]
- 31.Crossley NA, Mechelli A, Vértes PE, Winton-Brown TT, Patel AX, Ginestet CE, McGuire P, Bullmore ET. Proc Natl Acad Sci USA. 2013;110:11583. doi: 10.1073/pnas.1220826110. [DOI] [PMC free article] [PubMed] [Google Scholar]
- 32.de Reus MA, van den Heuvel MP. J Neurosci. 2013;33:12929. doi: 10.1523/JNEUROSCI.1448-13.2013. [DOI] [PMC free article] [PubMed] [Google Scholar]
- 33.Towlson EK, Vértes PE, Ahnert SE, Schafer WR, Bullmore ET. J Neurosci. 2013;33:6380. doi: 10.1523/JNEUROSCI.3784-12.2013. [DOI] [PMC free article] [PubMed] [Google Scholar]
- 34.van den Heuvel MP, Kahn RS, Goñi J, Sporns O. Proc Natl Acad Sci USA. 2012;109:11372. doi: 10.1073/pnas.1203593109. [DOI] [PMC free article] [PubMed] [Google Scholar]
- 35.Bogaard A, Parent J, Zochowski M, Booth V. J Neurosci. 2009;29:1677. doi: 10.1523/JNEUROSCI.5218-08.2009. [DOI] [PMC free article] [PubMed] [Google Scholar]
- 36.Leone MJ, Schurter BN, Letson B, Booth V, Zochowski M, Fink CG. Phys Rev E. 2015;91:032813. doi: 10.1103/PhysRevE.91.032813. [DOI] [PMC free article] [PubMed] [Google Scholar]
- 37.Kuramoto Y. Chemical Oscillations, Waves, and Turbulence. Springer; Berlin: 1984. [Google Scholar]
- 38.Acebr JA, Gradenigo V, Matematica D. Rev Mod Phys. 2005;77:1. [Google Scholar]
- 39.Strogatz SH. Physica D. 2000;143:1. [Google Scholar]
- 40.Golomb D, Rinzel J. Physica D. 1994;72:259. [Google Scholar]
- 41.Stiefel KM, Gutkin BS, Sejnowski TJ. J Comput Neurosci. 2009;26:289. doi: 10.1007/s10827-008-0111-9. [DOI] [PMC free article] [PubMed] [Google Scholar]
- 42.Dyhrfjeld-Johnsen J, Santhakumar V, Morgan RJ, Huerta R, Tsimring L, Soltesz I. J Neurophysiol. 2007;97:1566. doi: 10.1152/jn.00950.2006. [DOI] [PubMed] [Google Scholar]
- 43.Buckmaster PS, Jongen-Rêlo AL. J Neurosci. 1999;19:9519. doi: 10.1523/JNEUROSCI.19-21-09519.1999. [DOI] [PMC free article] [PubMed] [Google Scholar]
- 44.Santhakumar V, Aradi I, Soltesz I. J Neurophysiol. 2005;93:437. doi: 10.1152/jn.00777.2004. [DOI] [PubMed] [Google Scholar]
- 45.Morgan RJ, Soltesz I. Proc Natl Acad Sci USA. 2008;105:6179. doi: 10.1073/pnas.0801372105. [DOI] [PMC free article] [PubMed] [Google Scholar]


