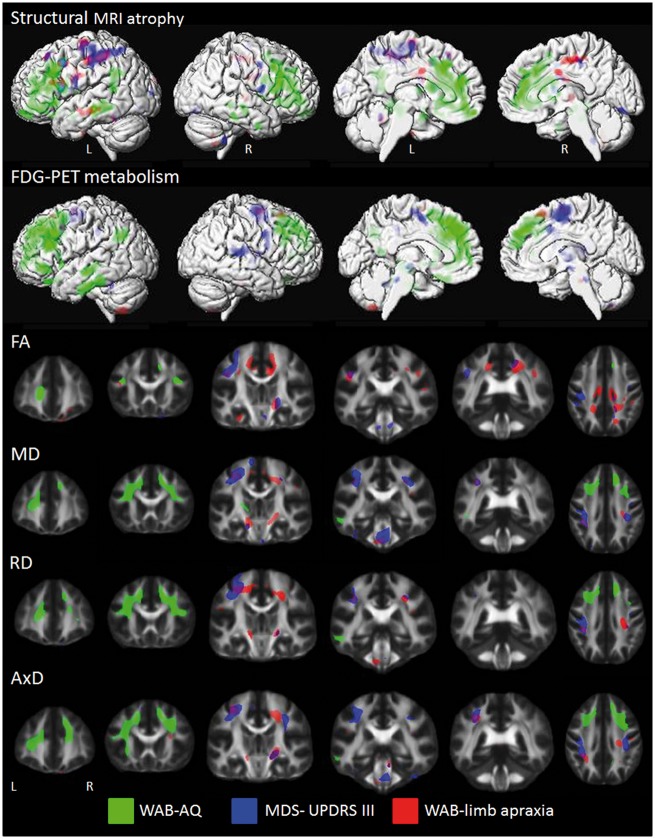
Figure 4.
Correlations between rate of change in neuroimaging and clinical measures. Structural MRI results represent regions where faster rates of atrophy correlate with faster worsening of the clinical measures. FDG-PET results represent regions where faster decline in metabolism correlate with faster worsening of the clinical measures. Fractional anisotropy (FA) results represent regions where faster rates of fractional anisotropy decline correlate with faster worsening of the clinical measures. Mean diffusivity (MD), radial diffusivity (RD) and axial diffusivity (AxD) results represent regions where faster rates of increase correlate with faster worsening of the clinical measures. Structural MRI results are shown on three-dimensional surface renderings, while DTI results are shown on a group fractional anisotropy template. Results were generated using the whole cohort and shown uncorrected at P < 0.001. AQ = aphasia quotient; L = left; MDS-UPDRS = Movement Disorder Society sponsored revision of the Unified Parkinson's Disease rating scale; R = right; WAB = Western Aphasia Battery.

