

Fragile X Syndrome (FXS) often also presents with autism spectrum disorder (ASD). Boland et al. reveal consistent disease-associated phenotypes during neuronal differentiation of induced pluripotent stem cells from multiple patients diagnosed with FXS. FMR1- cells showed altered expression and epigenetic regulation of genes associated with ASD, suggesting common disease mechanisms.
Keywords: autism spectrum disorder, fragile X syndrome, neurogenesis, brain development, stem cells
Abstract
New research suggests that common pathways are altered in many neurodevelopmental disorders including autism spectrum disorder; however, little is known about early molecular events that contribute to the pathology of these diseases. The study of monogenic, neurodevelopmental disorders with a high incidence of autistic behaviours, such as fragile X syndrome, has the potential to identify genes and pathways that are dysregulated in autism spectrum disorder as well as fragile X syndrome. In vitro generation of human disease-relevant cell types provides the ability to investigate aspects of disease that are impossible to study in patients or animal models. Differentiation of human pluripotent stem cells recapitulates development of the neocortex, an area affected in both fragile X syndrome and autism spectrum disorder. We have generated induced human pluripotent stem cells from several individuals clinically diagnosed with fragile X syndrome and autism spectrum disorder. When differentiated to dorsal forebrain cell fates, our fragile X syndrome human pluripotent stem cell lines exhibited reproducible aberrant neurogenic phenotypes. Using global gene expression and DNA methylation profiling, we have analysed the early stages of neurogenesis in fragile X syndrome human pluripotent stem cells. We discovered aberrant DNA methylation patterns at specific genomic regions in fragile X syndrome cells, and identified dysregulated gene- and network-level correlates of fragile X syndrome that are associated with developmental signalling, cell migration, and neuronal maturation. Integration of our gene expression and epigenetic analysis identified altered epigenetic-mediated transcriptional regulation of a distinct set of genes in fragile X syndrome. These fragile X syndrome-aberrant networks are significantly enriched for genes associated with autism spectrum disorder, giving support to the idea that underlying similarities exist among these neurodevelopmental diseases.
Introduction
Fragile X syndrome (FXS) is the most common form of inherited intellectual disability and is frequently associated with autism spectrum disorder (ASD) (McLennan et al., 2011). In addition to cognitive impairment, individuals with FXS often exhibit seizures and autistic behaviours as well as attention deficits, social anxiety, obsessive-compulsive disorder, and stereotypic repetitive motions. Expansion of a CGG trinucleotide repeat within the 5’-UTR of the FMR1 gene, located on chromosome X, results in epigenetic silencing and loss of the fragile X mental retardation protein (FMRP). FMRP binds to RNA and negatively regulates translation of ∼1400 mRNA targets (Brown et al., 2001; Miyashiro et al., 2003; Darnell et al., 2011). It is highly expressed in neurons, where it plays a role in the regulation of dendritic spine morphology and synaptogenesis (Irwin et al., 2000; Huber et al., 2002). The focus of FXS research has been mainly on the role of FMRP in neurons and its effects on synaptogenesis and circuit maturation.
In spite of a lack of direct experimental data, genomic analysis studies of autism suggest that molecular and network dysfunction in ASD may occur earlier in development than was previously thought. A list of genes known to be associated with ASD and ASD risk is maintained by The Simons Foundation Autism Research Initiative (SFARI) database. Many of the mutated or dysregulated genes in the SFARI database are FMRP targets (Iossifov et al., 2012; Parikshak et al., 2013) and genes implicated in ASD are often temporally co-expressed during human corticogenesis (Parikshak et al., 2013). Furthermore, some ASD-associated genes are involved in cortical lamina specification and synaptic development during mid-gestation (Willsey et al., 2013).
Due to an inaccessibility of human tissue, there have been few studies that have examined the role FMRP plays during human brain development and during the early developmental stages of FXS. Growing evidence demonstrates aspects of human development and disease can be accurately modelled in vitro using human pluripotent stem cells (hPSCs) (Passier et al., 2016). Studies involving human FXS embryonic stem cell lines (derived from FXS embryos identified by pre-implantation diagnosis) have demonstrated neurodevelopmental and synaptic defects (Sheridan et al., 2011; Telias et al., 2013, 2014, 2015; Doers et al., 2014) and a wide variability in the timing of FMR1 epigenetic silencing during neuronal differentiation (Telias et al., 2013; Colak et al., 2014). But the earlier stages of neurogenesis have not been examined.
Unlike most of the epigenome, the epigenetic marks that result in FMR1 silencing remain refractory to reprogramming (Urbach et al., 2010). Although genome editing has been used to de-repress the silenced FMR1 locus in human induced pluripotent stem cells (hiPSCs) (Park et al., 2015), hiPSCs derived from patients with FXS generally act as FMR1 knockouts. The goal of our study was to develop a map of the dynamic transcriptomic and epigenetic changes during neocorticogenesis in the presence and absence of FMR1 expression. We generated neuronal progenitor cells (NPCs) and neurons from hiPSCs derived from several male individuals clinically diagnosed with FXS and ASD. Examination of different temporal stages of neurogenesis revealed novel disease-specific defects that appear early in dorsal forebrain development. Global gene expression and DNA methylation profiling indicated that FXS cells exhibit defects in developmental signalling, extracellular matrix rearrangement, cell migration, and neuronal maturation.
Materials and methods
Human induced pluripotent stem cell derivation and maintenance
These studies were performed according to approved IRB guidelines, with patient or guardian consent, and approved under the University of California – San Diego Embryonic Stem Cell Research Oversight (ESCRO) committee application #130336ZO. Each FXS subject was evaluated for ASD at the Fragile X Research and Treatment Center (University of California, Davis) using the Autism Diagnostic Observation Schedule (ADOS) and the Autism Diagnostic Interview – Revised (ADI-R). Specifically, each subject was evaluated and scored for (i) language and communications; (ii) reciprocal social interactions; and (iii) restrictive, repetitive, and stereotyped behaviours and interests.
Dermal biopsies were collected from five male subjects: four diagnosed with FXS and ASD (identified as Patients SC105, SC128, SC133, SC215), and one non-disease subject (Subject 713). All biopsies were dissociated using collagenase B, plated on fibronectin (10 µg/ml), and maintained in Dulbecco’s modified Eagle medium (DMEM) + 10% foetal bovine serum (FBS), penicillin/streptomycin and primocin. Human dermal fibroblasts from Patients SC105 (passage 5), SC128 (passage 10), SC133 (passage 8), and 713 (passage 5) were transduced with pMX POU5F1(OCT4), SOX2, KLF4, and MYCL retroviral particles as previously described (Nazor et al., 2012). Human dermal fibroblasts from Patient SC215 (passage 4) were transduced with Sendai virus (CytoTune iPS Sendai Reprogramming Kit, Invitrogen) using a 2:1 multiplicity of infection ratio of OCT4/KLF4 virus to SOX2/C-MYC virus, respectively. Colonies exhibiting hiPSC morphology were picked and expanded on mitotically-inactivated mouse embryonic fibroblasts in DMEM/F12, 20% knockout serum replacement (Life Technologies), GlutaMax™ (Life Technologies), MEM non-essential amino acids (Life Technologies), 0.1 mM 2-mercaptoethanol (Life Technologies), 12.5 ng/ml FGF2. HPSC lines were adapted to feeder-independent growth on Geltrex® (Life Technologies, 1:200 dilution) and maintained in TeSR-E8 medium (Stem Cell Technologies). Two hiPSC lines from each FXS patient (Patients SC128, SC1233, SC105 and SC215), the non-disease hiPSC line (Subject 713), and a non-disease hESC line (SAB1-13D, a kind gift from S. Fisher, UCSF) were used for profiling and differentiation. Together these lines (nine hiPSC and one hESC) comprise the 10 hPSC lines used in this study. hPSCs at ≥15 passages were used for profiling and differentiation experiments.
All of the FXS hiPSC lines used in this study are available through the National Institute of Mental Health (NIMH) coordinated Rutgers University Cell and DNA Repository (RUCDR).
Single nucleotide polymorphism genotyping
All cell lines were single nucleotide polymorphism (SNP) genotyped at the Rutgers DNA and Cell Repository using the Fluidigm SNP Trace panel of 96-SNPs. DNA samples analysed from each cell line were the same Day 0 samples used for methylation profiling.
FMR1 characterization and FMRP immunoblotting
FMR1 CGG repeats were amplified from genomic DNA using the AmplideX® FMR1 PCR Kit (Asuragen) according to the manufacturer’s instructions, followed by capillary electrophoresis for length determination. For FMR1 reverse transcription quantitative polymerase chain reaction (RT-qPCR), first-strand cDNA synthesis was performed using the QuantiTect® cDNA synthesis kit (Qiagen) and 200 ng total RNA. FMR1 and GAPDH were multiplex amplified with TaqMan® probes FAM-Hs00924547_m1 and VIC-Hs99999905_m1 (ABI, Life Technologies), respectively, on a CFX96 Real-Time System (Bio-Rad). FMR1 expression was normalized to GAPDH expression in each sample. Immunoblotting: whole cell extracts were prepared in RIPA buffer (1% NP-40, 0.5% deoxycholate, 1% SDS) with protease inhibitor cocktail (CalBiochem). Twenty micrograms of whole cell extract per line was subjected to sodium dodecyl sulphate polyacrylamide gel electrophoresis (SDS-PAGE) (4–20%), transferred to nitrocellulose, and immunoblotted with antibodies against FMRP (Abcam ab17722, 1:200) and ACTB (β-actin) (Sigma, 1:10 000).
Neuronal differentiation
Human PSC lines were differentiated using dual SMAD inhibition using a modification of a published protocol (Chambers et al., 2009). Specifically, high-density (>80% confluence) feeder-independent hPSCs (two non-disease, four FXS FMR1+ and four FXS FMR1−) were induced to differentiate to NPCs in 20% KSR medium (without FGF2) containing 5 µM dorsomorphin (Stemgent) and 10 µM SB431542 (Stemgent). On differentiation Day 7, medium was changed to a 1:1 mixture of KSR medium and N2 medium [DMEM/F12, N2 supplement (Life Technologies), GlutaMax™, MEM-NEAA] containing 5 µM dorsomorphin and 10 µM SB431542. On differentiation Day 9, medium was changed to 1:3 KSR:N2 medium, respectively, containing 5 µM dorsomorphin and 10 µM SB431542. On Day 11, medium was changed to N2 medium containing 5 µM dorsomorphin and 10 µM SB431542. To generate mature neurons, beginning at differentiation Day 13 cultures were maintained in maturation medium consisting of Neurobasal® medium (Life Technologies), B27 supplement (Life Technologies), 20 ng/ml BDNF (R&D Systems), 20 ng/ml GDNF (R&D Systems), 0.2 mM ascorbic acid (Sigma). On differentiation Day 30, cultures were dissociated with papain (Worthington Biochemical, PAP2) and plated at ∼1.5 × 10⁵ cells/cm2 on poly-d-lysine (50 µg/ml)/laminin (1 µg/ml) coated coverslips in Neurobasal®/B27, 2% FBS. The following day cells were switched to maturation medium + 10 µM DAPT and maintained in this medium for the duration of the experiment. For Day 12 phenotype analysis: eight hPSC lines: one non-disease (SAB1-13D), three FXS FMR1+ (SC128iPS2, SC128iPS5, SC133iPS3), and four FXS FMR1− lines (SC105iPS6, SC105iPS7, SC215iPS1, SC215iPS2) were randomly coded, seeded on replicate coverslips, differentiated and immunostained on differentiation Day 12 by M.J.B. Imaging was performed in a blinded fashion by H.T.T. on an Inverted IX51 Olympus fluorescent microscope. Three regions of interest per replicate coverslips were used for cell counts in ImageJ. Neurite tracing was performed with the FUJI Neurite Tracer plugin for ImageJ.
Immunocytochemistry
Cells were fixed with 4% paraformaldehyde, stained in a PBS solution containing 5% donkey serum, 1% BSA, 0.2% Triton™ X-100, and mounted in ProLong® Gold Antifade with DAPI (Life Technologies). Antibodies used in neuronal differentiation experiments were: TFAP2α (Developmental Studies Hybridoma Bank 3B5, 1:100), NESTIN (Millipore MAB5326, 1:1000), PAX6 (Covance PRB-728P, 1:100), TUBB3 (Tuj1) (Covance PRB-435P, 1:1000), MAP2 (Sigma M4403, 1:500), SYNAPSIN (Sigma S193, 1:1000). Species-specific secondary antibodies were conjugated with either Alexa Fluor® 488 or Alexa Fluor® 555 (Life Technologies, 1:1000). Images were recorded on either an Inverted Olympus IX51 fluorescence microscope or a Zeiss 710 LSM NLO Laser Point Scanning Confocal microscope with 405, 488 and 555 nm filters. Greyscale images were pseudocoloured using Adobe Photoshop CS6.
Electrophysiology
Coverslips containing D85-90 neuronal cultures from FXS FMR1+ (Patient SC128iPS2) and FXS FMR1− (Patient SC105iPS6) were placed in a perfusion chamber mounted on a Nikon Eclipse FN microscope. Spontaneous activity and evoked responses were recorded at 33°C under whole-cell conditions. The membrane potential and transmembrane current were measured using a MultiClamp700B amplifier (Molecular Devices) and sampled at 20 kHz using the data acquisition software DASYLab v.11 (National Instruments). Patch pipettes were pulled from standard borosilicate glass of 1.5 mm OD (Warner Instruments) and had input resistances of 6–8 MΩ. The composition of the bath solution (artificial CSF) was: NaCl 125 mM, KCl 2.5 mM, CaCl2 2 mM, MgCl2 1 mM, NaH2PO4 1.25 mM, NaHCO3 26 mM, glucose 25 mM. For recording action potentials and voltage-gated currents, patch electrodes were filled with the following intracellular solution: K-gluconate 120 mM, KCl 10 mM, HEPES 10 mM, EGTA 10 mM, MgATP 2 mM, Na3GTP 0.3 mM; pH 7.3. To record voltage responses, we used incrementing levels of current steps of 350 ms duration. Neurons were stimulated with constant current steps starting from −50 pA and incremented by 5 pA up to a level of +25 pA. Analysis of the evoked responses was performed using software developed by A. Szücs (IVAnalyzer). A number of parameters including the resting membrane potential, rheobase, input resistance at rest, and spike amplitude were recorded. In voltage clamp experiments the cells membrane potential was held at −60 mV and spontaneous excitatory/inhibitory postsynaptic current were recorded at 20 kHz sampling rate. The amplitude threshold for EPSC detection was set to 3.4 pA below which events were not distinguishable from noise. Arrival time and amplitude of each EPSC event was determined and mean EPSC frequency and amplitude were calculated from recordings.
Gene expression profiling
Approximately 106 cells were used for each biological replicate. See Supplementary Fig. 1 for total numbers of samples and cell line information used for gene expression and DNA methylation. Total RNA was extracted (Ambion® mirVana™ Kit, Life Technologies) according to the manufacturer’s protocol. RNA quantity (Qubit® RNA BR Assay Kit, Life Technologies) and quality (RNA6000 Nano Kit and Bioanalyzer 2100, Agilent) were quantified for each sample prior to further processing. Samples with RIN scores ≥ 9.0 were further processed. Two hundred nanograms of RNA per sample was amplified with the TotalPrep™ RNA Amplification Kit (Illumina) according to manufacturer’s protocol, and quantified as above. Seven hundred and fifty nanograms of labelled RNA per sample was hybridized to HT-12v4 Expression BeadChips (Illumina) and scanned with an iScan (Illumina). In GenomeStudio, probes were filtered for those detected at P < 0.01 in at least one sample and exported for robust spline normalization (RSN) in R using the lummi package.
PluriTest
To determine the pluripotent status of each cell line, global gene expression profiles were generated from each undifferentiated cell line using Illumina HT12v4 gene expression microarray as above. IDAT files from biological replicates were uploaded to www.pluritest.org.
DNA methylation profiling
Approximately 106 cells were used for each biological replicate. DNA was extracted using the DNeasy® kit (Qiagen) according to the manufacturer’s recommendations and quantified using a Qubit® and dsDNA BR Reagent (Life Technologies). Bisulphite conversion was performed using the EZ DNA Methylation™ Kit (Zymo Research) according to the manufacturer’s instructions. Whole genome amplification, fragmentation, and preparation of the DNA for hybridization were performed using the Infinium HumanMethylation450 BeadChip kit (Illumina) as described in the manufacturer’s protocol. Using the minfi Bioconductor package, Illumina IDATS were read directly into R and normalized using the Subset-quantile within array normalization (SWAN) for Infinium HumanMethylation450 BeadChips (Maksimovic et al., 2012).
Autism spectrum disorder gene annotations
ASD-associated genes were downloaded from the Human Gene Module of the SFARI database (https://gene.sfari.org/autdb/HG_Home.do) (Basu et al., 2009). Of the 827 genes downloaded from the SFARI, we analysed 1090 probes for 707 SFARI genes using Ht12v4 Illumina Gene Expression Microarrays. Additionally, 1172 probes for 742 genes were annotated as being targets of FMRP according to (Darnell et al., 2011). Supplementary Table 4 summarizes the SFARI and FMRP target gene lists.
Statistics
Differential gene expression analysis
The time course neuronal differentiation data were analysed using limma (Smyth, 2004). As described in Supplementary Fig. 1, cell lines were first grouped into three bins according to their specific characteristics of interest: (i) non-disease: two non-disease cell lines (expressing FMRP and lacking trinucleotide expansion); (ii) FMR1neg: four iPSC FXS FMR1− lines derived from Patients SC105 and SC215 (cell lines lacking FMRP expression); and (iii) FXS: the FXS FMR1− lines and four FXS FMR1+ iPSC lines derived from Patients SC128 and SC133 (cell lines carrying the FXS trinucleotide expansion in FMR1). In the first set of differential expression analyses, ‘Contrasts 1–3’, we set out to identify genes that were dynamic during differentiation within each of these three groups by identifying genes that had a fold-change ≥ 2.0 with a false discovery rate (FDR) ≤ 0.05 between successive differentiation stages (d0 versus d3, d3 versus d6,… d65 versus d80). The Benjamini and Hochberg procedure was used to calculate FDR-adjusted P-values for both differentially expressed genes and for differentially methylated cytosines (Reiner et al., 2003). ‘Contrast 4’, identified which genes had significantly distinct patterned variation during differentiation between non-disease lines versus FMR1neg lines by identifying genes that had an FDR ≤ 0.05 [i.e. (FMR1neg.d0 versus FMR1neg.d3) versus (non-disease.d0 versus non-disease.d3)]. In addition to the above FDR cut-off, a probe was only called significant in Contrast 4 if there was at least a 1.5-fold difference between groups at the same differentiation stage [i.e. (FMR1neg_d0 versus non-disease_d0)]. Contrast 5 mirrored that of Contrast 4, with the FXS group used in place of the FMR1neg group in all comparisons. In the final set of contrasts, Contrasts 6–7, we set out to identify genes with static differences either between non-disease versus FMR1neg cell lines, or non-disease versus FXS cell lines. In this comparison, averages were calculated for all samples in a group, independent of differentiation stage, with significant comparisons called at a fold difference ≥ 1.5 and an FDR ≤ 0.05. Significant genes from Contrasts 4–7 were annotated as FXS GEX-Candidates. Complete commented code for the analysis of gene expression is included in the Supplementary material.
Differential methylation analysis
DNA methylation data were generated from biological replicate samples for all differentiation Day 0–12 samples analysed via gene expression and were analysed in an analogous manner. Probes were called significant in all contrasts at FDR (determined by the Benjamini and Hochberg procedure) ≤ 0.05 and the difference in β-values > 0.25. Significant loci from Contrasts 4–7 were annotated as FXS differentially methylated cytosine (DMC) candidates. Complete commented code for the analysis of DNA methylation is included in the Supplementary material.
Weighted gene correlation network analysis
Weighted gene correlation network analysis (WGCNA) was performed in R using replicate level input data for both gene expression and DNA methylation. Briefly, ‘signed’ networks were constructed with minimum module sizes of 20 and 75 for gene expression and DNA methylation data, respectively. Probes were assigned to modules when R(probe:module eigengene) ≥ 0.5 at a significance level of P ≤ 0.05. Each probe was exclusively assigned to whichever module it was most highly and significantly correlated. Complete commented code for WGCNA analyses is included in the Supplementary material.
Functional enrichments
All functional enrichments were performed using the Genomic Regions Enrichment of Annotations Tool (GREAT) (McLean et al., 2010) using UCSC hg19 genome coordinates provided in Supplementary Table 5. For gene expression, the initial set of 22 063 probes with detectable expression was used as ‘Background Regions’ and the ‘Association Rule’ was set to ‘single nearest gene’ including curated regulatory domains. Only enrichment terms with at least three input genes were reported. For DNA methylation, default Association Rule settings were used with the ‘whole genome’ option selected for Background Regions. Chi-squared contingency table tests were performed using the chisq.test function in the default ‘stats’ package in R. Complete commented code for all statistical analyses are provided in the Supplementary material.
Integration of DNA methylation and gene expression results
Gene expression probes were associated with individual methylated cytosine probes according to the default Association Rule settings in GREAT. Pearson correlations were calculated using data averaged by cell line and differentiation stage. Significant negative and positive correlations were called via identification of inflection points in the trimodal distribution of calculated correlation values, with significant negative correlations at R ≤ −0.36 and significant positive correlations at R ≥ 0.37.
Results
Generation and characterization of FXS human induced pluripotent stem cell lines
HiPSCs were derived from four males clinically diagnosed with FXS and ASD at the Fragile X Research and Treatment Center (MIND Institute, University of California, Davis) using the Autism Diagnostic Observation Schedule (ADOS) and the Autism Diagnostic Interview – Revised (ADI-R). Detailed patient information as well as ADOS and ADI-R scores for each subject are listed in Supplementary Table 1. Because FXS is an X-linked disorder, we used male hiPSCs to avoid potential problems associated with erosion of X-chromosome inactivation resulting in unbalanced X-linked gene dosage in female hPSCs (Mekhoubad et al., 2012; Nazor et al., 2012).
In this study we compared two hiPSC lines from each of the four FXS patients (Patients SC105, SC128, SC133, and SC215) to a hiPSC line generated from a ‘normal’ male (Subject 713) and a male human embryonic stem cell (hESC) line (SAB1-13D), which are referred to as non-disease hPSC lines. Figure 1A lists the 10 cell lines used in this study. Each undifferentiated line was determined to be pluripotent based on global gene expression signatures when compared to other established hPSC lines (Muller et al., 2011) (Supplementary Fig. 2A). Furthermore, each hPSC line was genetically barcoded by SNP genotyping (Supplementary Table 2).
Figure 1.

Pluripotent stem cell lines used in this study. (A) Schematic depicting the 10 hPSC lines (one hESC, nine hiPSC) used in this study. Non-disease hiPSC (Subject 713) and hESC lines are shaded green, FXS FMR1+ hiPSC lines (derived from FXS Patients SC128 and SC133, yet retain FMR1 expression) are shaded grey, FXS FMR1− hiPSC lines (derived from FXS Patients SC105 and SC215) are shaded black. (B) Immunoblot analysis for FMRP in undifferentiated hPSCs. (C) Top: RT-qPCR analysis of FMR1 expression in each cell line at differentiation Days (D)0, D3, D6, D9, and D12 of neuronal differentiation. Bottom: Array analysis of DNA methylation levels at the FMR1 locus in each cell at D0, D3, D6, D9, and D12 of neuronal differentiation. Error bar indicate SEM.
FMR1 CGG repeat length is mosaic in cell populations from FXS patients (Nolin et al., 1994; Pretto et al., 2014). Therefore, we characterized each FXS hiPSC line by determining (i) the number of FMR1 CGG repeats; (ii) the expression of FMR1 mRNA and FMRP; and (iii) the DNA methylation profile of the FMR1 locus. Generally, full mutation FXS is associated with >200 CGG repeats in the 5’-UTR of FMR1. All FXS hiPSC lines possessed >200 repeats except line SC128iPS2, which had 150 repeats (Supplementary Table 3). Next, we determined the FMR1 expression status for each line. Lines from Patients 105 and 215 did not express either FMRP (encoded by FMR1) or FMR1 transcript (Fig. 1B and C). Interestingly, although lines SC128iPS5, SC133iPS2, and SC133iPS3 harboured a full mutation allele (250, 210 and 210 repeats, respectively), they all expressed FMR1 mRNA (Fig. 1C), and low levels of FMRP compared to non-disease lines (Fig. 1B). These lines, which retain FMR1 expression but are derived from patients diagnosed with FXS and ASD, are referred to as FXS FMR1+ lines. The cell lines included in this study were grouped as: non-disease, FXS FMR1+, and FXS FMR1−, and are colour-coded as green, grey and black, respectively (Fig. 1A).
Analysis of DNA methylation patterns at the FMR1 locus demonstrated that, similar to non-disease lines, each of the undifferentiated FXS FMR1+ lines lacked DNA methylation (i.e. were hypomethylated), whereas the FXS FMR1− lines had a hypermethylated signature at the FMR1 locus (Fig. 1B). Importantly, FXS FMR1+ lines remained hypomethylated and did not silence the FMR1 locus during differentiation to NPCs. Conversely, FXS FMR1− lines remained hypermethylated and the FMR1 locus remained silenced during differentiation (Fig. 1B). These data show that the DNA methylation status at the FMR1 locus was faithfully maintained during differentiation and DNA methylation of FMR1 was negatively correlated with expression of the gene.
Neurogenic defects of FXS FMR1− human induced pluripotent stem cells
One of the brain regions affected in FXS and ASD is the cortex. Monolayer differentiation of hPSCs by dual SMAD inhibition has been shown to mimic endogenous corticogenesis (Chambers et al., 2009; Shi et al., 2012). Therefore, we used monolayer dual SMAD inhibition for neuronal differentiation (Supplementary Fig. 2B). As expected, by Day 12 of differentiation, all hPSC lines primarily generated NPCs (PAX6+, NESTIN+) as well as a smaller population of early neural crest derivatives that expressed TFAP2α (Supplementary Fig. 2C). Furthermore, in agreement with our immunocytochemistry results, Day 12 cell populations highly expressed genes consistent with neuroepithelial or early radial glial cells (PAX6, NES, LHX2, HES5), and to a lesser extent genes indicative of early neural crest (B3GAT1, TFAP2A, NGFR). At this time point we observed low to no expression of ventral forebrain genes (ASCL1, DLX1, NKX2-1), or EOMES which marks intermediate progenitors in the developing neocortex (Supplementary Fig. 2D).
When characterizing the early stages of neuronal differentiation, we determined that FXS FMR1− lines generated fewer immature neurons [βIII tubulin (Tuj1)+/NESTIN−) at differentiation Day 12 compared to the FMR1+ hPSC lines (both non-disease and FXS FMR1+ lines) (Fig. 2A and B). In addition, early neurons generated by the FXS FMR1− lines possessed longer primary neurites relative to immature neurons from FMR1+ hPSC lines (Fig. 2A and C). Interestingly, the number of βIII tubulin+ immature neurons was no longer significantly different at differentiation Day 15, suggesting a slight neurodevelopmental delay in the FXS FMR1− lines (Supplementary Fig. 3).
Figure 2.
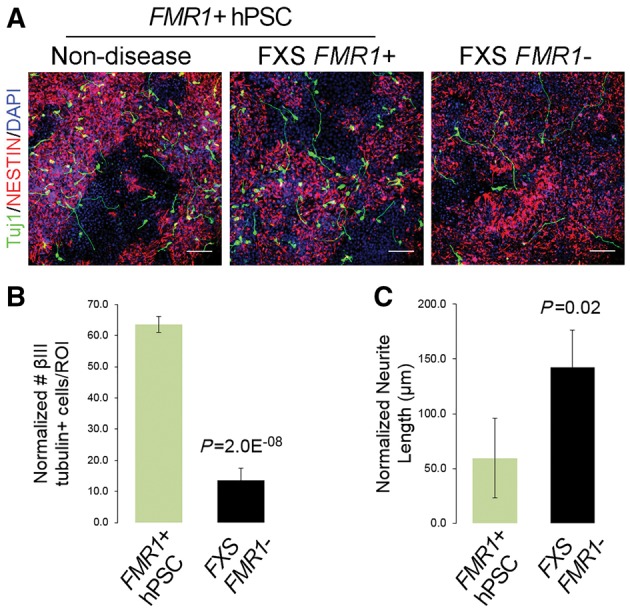
FXS FMR1− lines exhibit aberrant neurogenic phenotypes. (A) Representative images of non-disease, FXS FMR1+ and FXS FMR1− cultures at Day 12 of differentiation. FXS FMR1− hiPSCs generate fewer βIII tubulin+ (Tuj1) immature neurons that have longer primary neurites relative to non-disease and FXS FMR1+ lines. Scale bar = 100 µm. (B) Quantitation of the number of βIII tubulin+ cells produced at D12 by combined FMR1+ hPSC, and FXS FMR1− hiPSCs. Normalized to total number of cells. P = 2.0 × 10⁻⁸. (C) Quantitation of neurite length at D12 by combined FMR1+ hPSC, and FXS FMR1− hiPSCs. Normalized to number of βIII tubulin+ cells. P = 0.02. For quantitation in B and C, n = 3 region of interest each from biological replicates of four FMR1+ hPSC lines (one non-disease, three FXS FMR1+ lines) compared to four FXS FMR1− lines. Error bars indicate SEM.
Synaptic network defects in FXS FMR1− neurons
Because of the line-to-line reproducibility observed during the early stages of differentiation, we differentiated one cell line from each group for 85 days, and collected samples for gene expression profiling on differentiation Days 50, 65, and 80 (see below). At these later time points, all neurons expressed the dendritic marker, MAP2, as well as synaptic markers, and gene expression profiles were similar among non-disease, FXS FMR1+ and FXS FMR1− lines (Supplementary Fig. 4A and B). As expected, gene expression profiling suggested that the primary neuronal subtype produced was neocortical glutamatergic neurons (Supplementary Fig. 4B).
To determine whether hiPSC-derived neurons exhibit properties similar to mature cortical neurons, we performed current and voltage clamp experiments under whole-cell conditions on Day 85 FXS FMR1+ and FMR1− neurons. All neurons displayed mature resting membrane potentials and over half of the neurons from each group tested showed voltage responses similar to those of mature cortical neurons. (Supplementary Fig. 4C and D). Resting input resistance was high in both groups, often exceeding 1.3 GΩ, which indicated a low level of voltage-gated membrane conductance activated at or below the resting membrane potential (Supplementary Fig. 4E). Consistent with high input resistance, regular firing type cells had a low rheobase (Supplementary Fig. 4F). FXS FMR1+ neurons exhibited abundant excitatory postsynaptic potentials (EPSPs) suggesting the presence of excitatory chemical synapses. Also, voltage clamp recordings revealed excitatory postsynaptic current transients ranging from 3 to 100 pA in amplitude (Supplementary Fig. 4G). FXS FMR1+ cells intermittently received bursts of EPSPs as well as a few inhibitory postsynaptic potentials. In contrast, FXS FMR1− neurons received significantly less synaptic input and virtually no inhibitory input (Supplementary Fig. 4H). The average frequency of synaptic inputs of FXS FMR1− cells was only 17% of that of FXS FMR1+ neurons. Together these data suggest that, at this early developmental stage, neurons derived from FXS FMR1+ hiPSCs formed networks with robust synaptic connectivity, while FXS FMR1− neurons had more immature synaptic networks by comparison. This conclusion is consistent with an analysis of FXS hESCs (Telias et al., 2015), which further confirms that our FMR1− neurons possess identifiable FXS phenotypes.
Modelling molecular dynamics in the neuronal differentiation of FXS human induced pluripotent stem cells
To identify epigenetic and transcriptomic aberrations during neuronal differentiation of FXS hiPSCs, we generated global DNA methylation and gene expression data from biological replicates of multiple non-disease, FXS FMR1+, and FXS FMR1− lines at differentiation Days 0, 3, 6, 9, and 12 of cortical differentiation. Additionally, replicate gene expression data were generated at differentiation Days 50, 65, and 80 from one cell line from each of these groups (Supplementary Fig. 1). Using these data, our goal was to identify dynamic processes that were involved in neuronal differentiation irrespective of FXS, as well as those having patterns attributable to FXS. We reasoned that many of the molecular dynamics during neuronal differentiation would be maintained between FXS and non-disease cell lines and that these ‘normal’ processes would provide context to better understand how aberrations specific to FXS may affect biological processes at a network level. In a cursory analysis of global DNA methylation patterns, we observed that FXS FMR1+ lines in some ways resembled non-disease lines, and in other ways resembled FXS FMR1− lines (data not shown). The shared aberrations of FXS FMR1+ cells and FXS FMR1− cells may be associated with trinucleotide repeat expansion or some other unidentified aspect of FXS, while similarities shared between FXS FMR1+ lines and non-disease lines may derive from retention of FMRP expression. For these reasons, we set up statistical tests to identify FXS aberrations that were either associated with loss of FMR1 expression (FXS FMR1−), or with trinucleotide repeat expansion (FXS FMR1− and FXS FMR1+).
Gene expression analysis indicates deficits in FXS neuronal maturation and cell migration
In a set of tests (Contrasts 1–3) we compared successive stages of differentiation independently for non-disease cell lines, FXS FMR1− cell lines, and all FXS cell lines (FXS FMR1− and FXS FMR1+). The expression of these genes changed significantly during differentiation (fold-change ≥ 2.0, FDR adjusted P < 0.05), but not in a manner that was directly attributable to FXS. A second set of comparisons identified genes having dynamic gene expression patterns that were attributable to FXS via loss of FMR1 expression (Contrast 4) as well as trinucleotide repeat expansion (Contrast 5). In a final set of comparisons, we identified genes with static differences between non-disease lines and FXS FMR1− lines (Contrast 6), and between non-disease and all FXS lines (Contrast 7). In total, we identified 4748 genes in these analyses, of which 1403 genes were significantly different in Contrasts 4–7 (fold-change ≥ 1.5, FDR adjusted P < 0.05) and were identified as FXS candidates. Figure 3A and B show temporal heat maps of the top 50 most significantly aberrantly up- and downregulated genes in FXS FMR1− cells (relative to non-disease), respectively. Refer to Supplementary Table 5B, for complete searchable differentially expressed gene lists.
Figure 3.

Temporal FXS FMR1− gene expression signature. (A) Temporal heat maps showing the 50 most significantly aberrantly upregulated FXS candidate genes during early [NPC specification, Days (D)0–D12] and late (neuron, D50–D58) differentiation, respectively. (B) Temporal heat maps showing the 50 most significantly aberrantly downregulated FXS candidate genes during early (NPC specification, D0–D12) and late (neuron, D50–D58) differentiation, respectively. For both A and B; fold-change is ≥ 1.5 (FDR-adjusted P < 0.05) of FXS FMR1− cells relative to non-disease cells. FMRP target genes and SFARI genes are indicated by red bars to the right of each heat map. (C) FMRP target genes and SFARI genes were significantly enriched in the candidate gene set as determined using chi square tests.
Among the dysregulated genes are genes that suggest that FXS FMR1− cells possess defects in signalling (WNT: BAMBI, CPZ, DKK1; and BMP: BMP7, RGMB) as well as defects in cell migration (CHCHD2, BAMBI), cell adhesion (CDH7, CDH12), extracellular matrix (FBLN1) and cytoskeletal (KATNAL2) reorganization, and neuronal maturation (UNC5A). CHCHD2 was originally identified in a screen for migration defects (Seo et al., 2010) and is downregulated or mutated in other neuropsychiatric disorders (Feyeux et al., 2012; Funayama et al., 2015). BAMBI stimulates WNT signalling by inhibiting TGFβ and activin signalling, and is involved in cell migration and metastasis (Onichtchouk et al., 1999; Fritzmann et al., 2009; McLennan et al., 2015). Together, these data suggest that FXS FMR1− cells have defects in developmental signalling, cell migration, and extracellular matrix (ECM) remodelling. Notably, members of the SLITRK gene family were dysregulated at both early and later stages of differentiation; SLITRK4 was down-regulated in FXS FMR1− NPCs but not neurons, whereas SLITRK2 was downregulated in FXS FMR1− neurons but not NPCs (Fig. 3B). SLITRK proteins have been reported to suppress neurite outgrowth (Aruga and Mikoshiba, 2003), which may help explain the aberrant/precocious neurite outgrowth observed at differentiation Day 12 in the FXS FMR1− lines (Fig. 2).
To determine whether any of the FXS candidate genes have been implicated in ASD, we compared our FXS candidate gene list to the extensively curated list of ASD-associated genes from the Simons Foundation for Autism Research Initiative (SFARI). We found that 6.27% of FXS candidates were associated with ASD (88 of 1403) (Fig. 3A, B and Supplementary Table 5). Furthermore, 110 FXS candidates were previously identified as mRNA targets of FMRP (Darnell et al., 2011). FXS candidate genes were significantly enriched for both FMRP target genes (P = 3.15 × 10⁻¹¹) and SFARI genes (P = 2.03 × 10⁻⁴) (Fig. 3C). Annotated lists of SFARI genes can be found in Supplementary Table 4A and B, respectively.
Gene network analysis
We used WGCNA to identify gene sets that coordinately varied during the course of neuronal differentiation. See Supplementary Table 5B, for complete, searchable gene expression WGCNA results. Eleven covariant gene modules were associated with the temporal progression of neuronal differentiation (GEX-Purple–Turquoise) and one module was associated with FXS-disease status (GEX-Grey module) (Fig. 4A). Chi-square tests were performed to determine whether any of the modules were enriched for FXS candidates. GEX-modules associated with undifferentiated pluripotent stem cells (differentiation Day 0) (Green), NPCs (differentiation Days 6–12) (Pink, Magenta, Black), neurons (differentiation Days 50–80) (Turquoise) and FXS-disease status (Grey) were all enriched for FXS candidates (Fig. 4B). Interestingly, GEX-Purple, which was strongly correlated with differentiation Day 0, was rapidly downregulated during NPC specification and then upregulated at later stages of differentiation (differentiation Days 50–80), was also enriched for FXS candidates.
Figure 4.

Network analysis of FXS. (A) WGCNA identified 11 modules of covariant gene sets correlated with differentiation (GEX-Purple – Turquoise), and one module correlated with FXS disease status (GEX-Grey). Note that some GEX modules are most strongly correlated with a specific day of differentiation (Green, D0; Pink, D3; Black, D12; Turquoise, D50–80). (B) Chi square distribution of FXS candidate gene enrichment per module. Red diamonds depict the expected level of FXS gene enrichment based on the number of genes in each module. Bars represent observed values. The GEX modules Purple, Pink, Magenta, Black and Turquoise are significantly enriched for FXS candidates. (C) GREAT was used to assess functional enrichments for each module. The three most significant GO terms for each module are shown. FE = fold enrichment.
The Genomic Regions Enrichment Annotation Tool (GREAT) (McLean et al., 2010) was used to assign function to the list of FXS candidates and the GEX-modules identified by WGCNA (Fig. 4C). Refer to Supplementary Table 5B and D, for complete, searchable information regarding GEX WGCNA and GREAT enrichments, respectively. The three most highly significant gene ontology (GO) terms among the FXS candidate genes were associated with neuron projection development and morphogenesis, and axon development (Fig. 4C). Undifferentiated PSCs (differentiation Day 0) and differentiation Day 3 cells were strongly correlated with gene sets involved in various metabolic processes, brain development, and mitosis (Green – Pink modules). On Days 6 and 9 of differentiation, genes involved in mitosis, microtubule cytoskeletal organization, WNT-signalling, and the actin cytoskeleton were upregulated (Blue – Yellow modules). On Days 9 and 12 of differentiation, GEX-modules Brown and Black predominated, which contain genes involved in extracellular matrix reorganization, locomotion, and organogenesis. The Turquoise module (correlated with the later stages of neuronal differentiation) (Fig. 4A), was composed of genes regulating axonogenesis, polarized growth, growth cone establishment, synaptic vesicles, and membrane transporters (Fig. 4C).
Among the candidates enriched in NPCs (differentiation Days 0–12) and neurons (differentiation Days 50–80) were a number of neural transcription factors (FEZF1, HHEX, NEUROG2, SIX3, METRNL), cell adhesion molecules (CD9, FBLN1, VCAM1, PCDH7), genes associated with signalling during CNS development (TDGF1, NQO2, GPR78, GPR98, SPRY1, DKK1, C8orf4, ARRB1), ECM/cytoskeletal remodelling (KATNAL2, TGLN, FABP7, LEPREL1, KANK4), and axon guidance (FABP7, RGMB, UNC5A). Furthermore, the neuron-specific GEX-Turquoise module contained a greater proportion of FXS candidates relative to the NPC-associated Magenta and Black modules (Fig. 4B). Together, these results suggest that the dysregulation of gene expression in our FXS hiPSC model begins during the specification of dorsal forebrain NPCs and is further enhanced in differentiated neurons.
Aberrant DNA methylation patterns in FXS cells
Profound changes to global genomic methylation patterns occur during the early stages of hPSC differentiation (Nazor et al., 2012). The FMR1 epigenetic silencing that occurs in FXS prompted us to ask whether this heterochromatin event had only localized effects on the X chromosome or might perturb DNA methylation patterns on a more global scale. We profiled global DNA methylation patterns in non-disease, FXS FMR1+ and FXS FMR1− cells at Days 0, 3, 6, 9, and 12 of neuronal differentiation. Using statistical analyses similar to those used to identify dysregulated genes, we identified 4640 DMCs that either gained or lost methylation during differentiation, 1603 of which were specific to FXS cells and are referred to as FXS candidate DMCs, (Supplementary Table 5C). Both gains and losses of methylation were observed in FXS FMR1− lines relative to non-disease lines (Fig. 5A). As discussed above, there were methylation patterns shared by both types of FXS cells (FMR1+ and FMR1−) that differed from non-disease cells, and at some loci FXS FMR1+ cells exhibited an intermediate global methylation pattern compared to non-disease and FXS FMR1− cells (Fig. 5A). We also observed both DNA hypomethylation and hypermethylation that was specific to FXS FMR1− cell lines. Surprisingly, only 5.6% (90 of 1603) of candidate DMCs occurred on the X chromosome, while the vast majority (93.9%, 1506 of 1603) were located on autosomes; this demonstrates that DNA methylation abnormalities in FXS FMR1− cells are not restricted to the X chromosome. Not surprisingly, candidate DMCs found on the X chromosome were located at, or near, the FMR1 locus (Supplementary Table 5C). Finally, we assessed DMC enrichment in relation to CpG density by determining whether they were preferentially enriched in CpG islands (CGI), shores or shelfs (Fig. 5B). Chi square distribution showed non-candidate DMCs were significantly enriched in areas of low CpG density whereas candidate DMCs exhibited a bias toward regions of increased CpG density, and were particularity enriched in CpG islands over shores and shelfs (island > shore > shelf) (Fig. 5C).
Figure 5.

Aberrant DNA methylation patterns at CpG rich genomic regions in FMR1− cells. (A) DNA methylation heat map of the static DMCs identified via Contrast 6, which is described in the ‘Materials and methods’ section. Each day of differentiation (D0, D3, D6, D9, D12) for each group is depicted across the x-axis. β-values were averaged for each group. Red = hypermethylation; blue = hypomethylation. (B) Schematic depicting CpG density relative to CpG island (CGI), shore, shelf. CpG density decreases with distance away from islands. (C) Candidate DMCs are preferentially enriched at CpG-dense regions.
We also performed WGCNA on the methylation data, which identified 15 covariant sets of DMCs associated with differentiation or FXS disease state (see ‘Materials and methods’ section, Fig. 6A and Supplementary Table 5C). Among these were strongly correlated sets of cytosines that were highly methylated in undifferentiated hPSCs, which progressively lost methylation over time (Fig. 6A; DMC-Blue, Pink, Magenta modules). GREAT analysis indicated that these modules contained functional enrichments related to cell proliferation and developmental signalling involved in neuralization (Fig. 6C and Supplementary Table 5E). Conversely, the DMCs of the Green module were unmethylated in hPSCs, gained methylation beginning at differentiated Day 6, and were associated with genes involved in forebrain development and regionalization (Fig. 6C). Nine modules (DMC-Grey – Purple) were robustly correlated with disease state (Fig. 6A). Methylation within many of these modules exhibited an inverse pattern in non-disease lines relative to FXS FMR1− lines. For example, modules containing methylated DMCs in FXS FMR1− cells lacked methylation in non-disease cells (DMC-Grey60 – Purple) and vice versa (DMC-Grey – Cyan). Chi square distribution demonstrated that FXS candidate DMCs were enriched within modules associated with disease state rather than day of differentiation (Fig. 6B). The majority of the cell group-specific modules lacked GREAT functional enrichments; however, modules DMC-Grey, Black, Grey60, and Midnightblue were all significantly enriched for the GO terms ‘MHC class II protein complex’ and ‘integral to luminal side of endoplasmic reticulum membrane’ (Fig. 6C).
Figure 6.

DNA methylation patterns are robust indicators of disease state. (A) WGCNA analysis identified four modules of covariant DMCs correlated with neuronal differentiation (DMC-Blue – Green) and 11 modules correlated with disease state (DMC-Grey – Purple). Modules associated with disease state exhibit inverse patterns between non-disease and FXS FMR1− lines. (B) Chi square distribution of FXS candidate DMC enrichment per DNA methylation module. Red diamonds depict the expected level of candidate DMC enrichment based on module size (i.e. number of DMCs). Bars represent observed values. (C) GREAT was used to assess functional enrichments for each module. The three most significant GO terms for each module are shown. See Supplementary Table 5E for all GO terms for each module. FE = fold enrichment.
Integrated analyses identify epigenetic-mediated dysregulation of gene expression in FXS
We performed several analyses in order to examine whether methylation dynamics of candidate DMCs affects FXS candidate gene expression. First, we calculated Pearson correlations for all significant DNA methylation and gene expression probes that could be associated using GREAT. The distribution of correlation values among all DMCs and gene expression showed a trimodal distribution, wherein DMCs were either positively correlated, negatively correlated, or weakly correlated with expression (Fig. 7A). Replotting the distribution of correlation values for all DMCs according to CpG island proximity showed that DMCs in regions with high CpG density had less of an effect on gene expression compared to those in with low CpG density (Fig. 7B).
Figure 7.
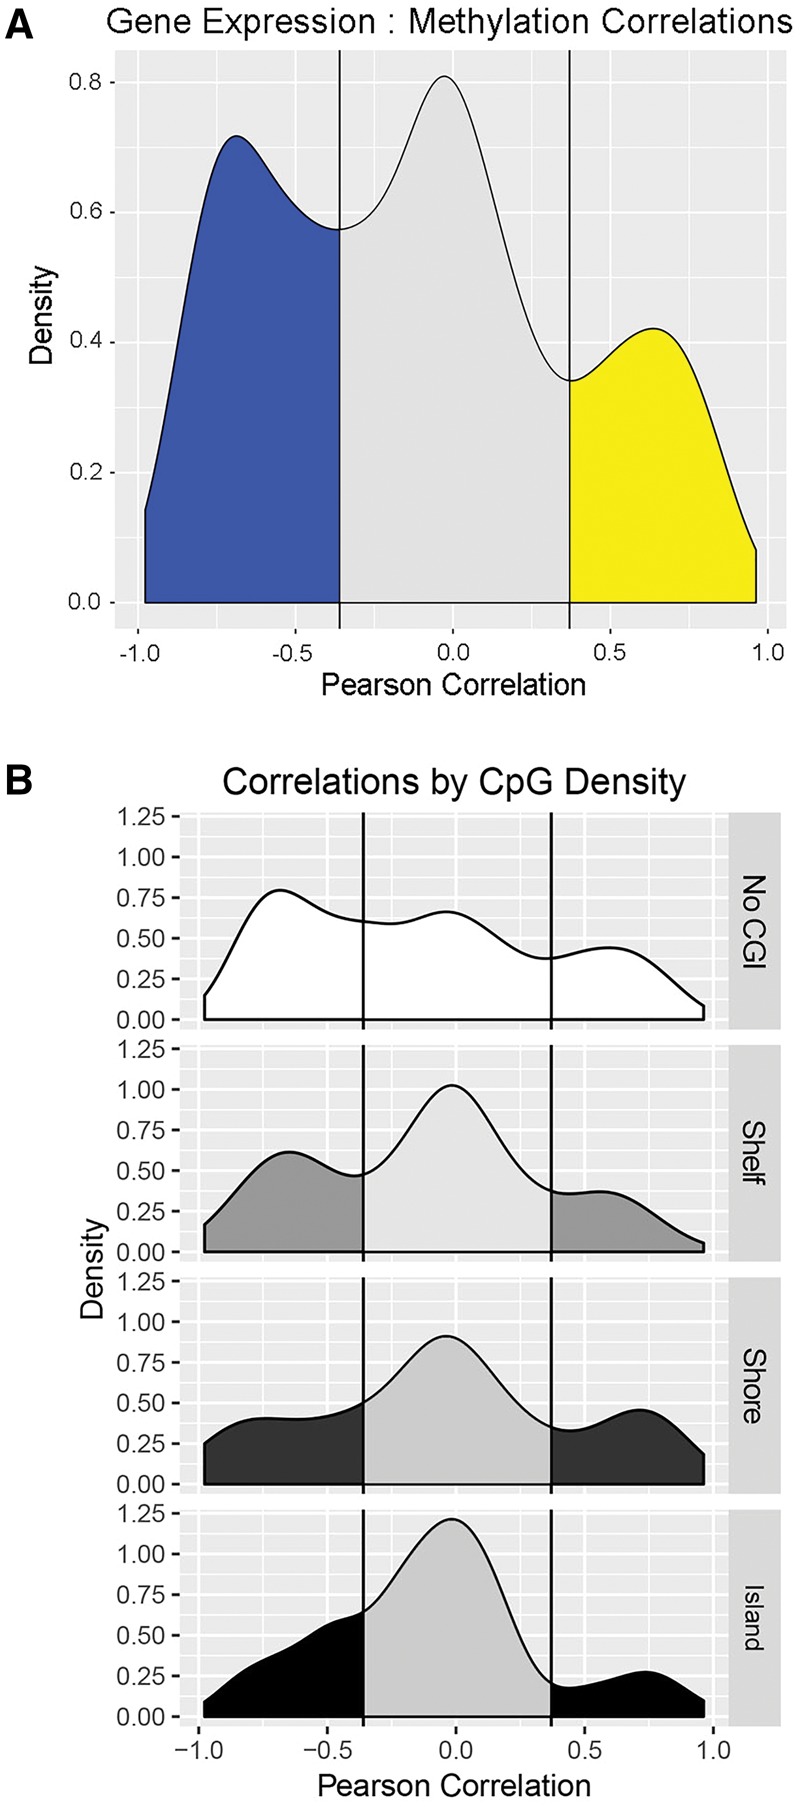
Integration of gene expression and DNA methylation during neuronal differentiation. (A) Distribution of correlation indicated DMCs are negatively (blue, R ≤ −0.36), positively (yellow, R ≥ 0.37), or not (grey) correlated with gene expression. (B) Correlations of gene expression and DMCs by CpG density. DMC in Shelf regions tended to be negatively associated with expression, whereas DMCs in Shores showed a slight positive correlation with gene expression. CpG islands were largely not correlated (or negatively correlated) with expression.
We filtered the set of associated DNA methylation and gene expression probes by identifying those beyond the inflection points in the trimodal distribution. Therein, we identified 824 genes that met significance criteria in the analysis of both gene expression and DNA methylation (Supplementary Table 6), of which 32 genes were independently identified as FXS candidates according to patterned gene expression and DNA methylation (Table 1). Three of these genes are FMRP targets (RIMBP2, PEG3, MYT1L) and four are SFARI genes (DPP6, GAP43, HLA-DRB1, MYT1L). Interestingly, five of these genes, CHCHD2, ERC1, MYOM2, HLA-DRB5, COL22A1 (Table 1), exhibited both positive and negative correlation with expression indicating cyclical expression during differentiation. Also, it should be noted that two of the genes (PEG3, NNAT) are paternally-expressed imprinted genes that are known to exhibit highly variable methylation patterns across hPSC lines (Nazor et al., 2012).
Table 1.
Differentially expressed FXS candidate genes correlated with candidate DMCs
| Gene | Correlation (average) | DMC count | FMRP | SFARI | GEX module | DMC module |
|---|---|---|---|---|---|---|
| Genes with negative correlation of expression | ||||||
| RIMBP2 | −0.88 | 1 | Yes | No | Turquoise | Pink |
| CHCHD2 | −0.84 | 2 | No | No | Grey | Lightcyan |
| MAGEH1 | −0.83 | 7 | No | No | Turquoise | Black |
| ZNF248 | −0.83 | 10 | No | No | None | Salmon |
| COMT | −0.82 | 2 | No | No | None | Greenyellow |
| TYW3 | −0.80 | 12 | No | No | Red | Brown |
| PEG3 | −0.79 | 1 | Yes | No | None | Grey60 |
| CRYZ | −0.77 | 12 | No | No | Blue | Brown |
| ERC1 | −0.75 | 1 | No | No | Turquoise | Purple |
| RGS10 | −0.70 | 1 | No | No | Turquoise | Greenyellow |
| MYOM2 | −0.67 | 13 | No | No | Turquoise | Tan |
| SORCS1 | −0.66 | 2 | No | No | Turquoise | NONE |
| SLITRK4 | −0.66 | 3 | No | No | Turquoise | Purple |
| ARMCX1 | −0.65 | 3 | No | No | Turquoise | Brown |
| NNAT | −0.62 | 3 | No | No | Turquoise | Grey |
| HLA-DRB5 | −0.62 | 3 | No | No | None | Grey |
| TXNRD2 | −0.53 | 2 | No | No | Red | Greenyellow |
| COL22A1 | −0.52 | 17 | No | No | Black | Midnightblue |
| DPP6 | −0.52 | 10 | No | Yes | Turquoise | Black |
| PHACTR3 | −0.49 | 1 | No | No | Turquoise | Black |
| GABRA2 | −0.44 | 15 | No | No | Turquoise | Lightcyan |
| LY6H | −0.42 | 2 | No | No | Turquoise | Brown |
| GAP43 | −0.38 | 1 | No | Yes | Turquoise | Grey60 |
| Genes with positive correlation of expression | ||||||
| ERC1 | 0.70 | 1 | No | No | Turquoise | Brown |
| HLA-DRB1 | 0.62 | 14 | No | Yes | None | Black |
| HLA-DRB5 | 0.62 | 19 | No | No | None | Black |
| GALNT9 | 0.59 | 1 | No | No | Turquoise | Pink |
| COL22A1 | 0.54 | 1 | No | No | Black | Cyan |
| MGAT5 | 0.54 | 1 | No | No | Turquoise | Greenyellow |
| CHCHD2 | 0.45 | 2 | No | No | Grey | Grey |
| MYOM2 | 0.45 | 2 | No | No | Turquoise | Greenyellow |
| USP36 | 0.45 | 1 | No | No | Yellow | Grey60 |
| MYT1L | 0.44 | 1 | Yes | Yes | Turquoise | Brown |
| SLITRK2 | 0.42 | 1 | No | No | Turquoise | Brown |
| ABCC8 | 0.41 | 1 | No | No | Turquoise | Grey |
| YAP1 | 0.39 | 1 | No | No | Yellow | Purple |
| TM2D3 | 0.37 | 1 | No | No | Turquoise | Greenyellow |
Correlation values for each DMC are shown as averages (Correlation average), the number of candidate DMCs associated with each gene are indicated (DMC count). Also indicated are whether the gene is an FMRP target or SFARI gene, and which WGCNA module the candidate gene or candidate DMC belongs to. Genes highlighted in bold exhibit cyclical expression (i.e. show both positive and negative expression correlation).
Discussion
We have identified a differential gene expression profile in FXS FMR1− cells relative to FXS FMR1+ and non-disease cells. Several of these genes were constitutively dysregulated throughout differentiation, implicating the encoded protein FMRP in the regulation of their expression. Furthermore, aberrant expression of genes such as BAMBI, BMP7, DKK1, and TDGBI (among others) indicated abnormal developmental signalling on loss of FMRP.
During embryogenesis, the timing of developmental events is crucial to normal development. We observed delayed neurodevelopment in our FXS FMR1− lines, in agreement with studies of differentiation of FXS hESCs (Telias et al., 2013). Aberrant signalling during differentiation and/or cell migration defects may cause or contribute to this phenotype. It is also possible that the dual SMAD differentiation conditions used here may amplify otherwise subtle FXS FMR1− phenotypes.
Our results point to temporal defects in ECM and actin/cytoskeletal remodelling, implicating defective migration in human FMR1− cells. Defective cell migration has recently become a recognized abnormality in a number of neuropsychiatric disorders, including ASD, epilepsy, and schizophrenia (Pinto et al., 2010; Peñagarikano et al., 2011; Brennand et al., 2015). Moreover, studies have shown that neuronal progenitor cells of Fmr1 knockout mice exhibit aberrant migration and differentiation (Castren et al., 2005; Tervonen et al., 2009; Saffary and Xie, 2011).
In contrast to a recent report that examined neurons derived from FXS hiPSCs (Doers et al., 2014), we observed enhanced neurite lengthening in the first immature FXS FMR1− neurons born relative to neurons derived from hPSCs expressing FMR1. Apparent discrepancies between these studies are likely attributable to the age of the neurons examined [early (this study) versus relatively mature (Doers et al., 2014)]. Enhanced neurite extension in our early FXS FMR1− neurons is potentially attributable to downregulation of SLITRK4 during NPC differentiation, a finding indirectly supported by studies in the mouse that show that loss of FMRP results in enhanced growth cone extension and reduced motility (Antar et al., 2006; Li et al., 2009). Furthermore, Benvenisty and colleagues have recently shown dysregulated expression of ROBO, SLIT, and REST targets genes in neurons derived from FXS hiPSCs (Halevy et al., 2015). We identified dysregulation of ROBO (ROBO2), SLIT (SLITRK2 and 4) and the REST target, TSPAN7, all of which regulate axon guidance, neurite extension and cell motility. Additionally, our data show that several regulators of axon guidance and/or neurite length (SPAST, RGMB, SEMA3C, SLITRK2) are downregulated in FXS FMR1− neurons, suggesting that delayed neuronal/synaptic maturation may contribute to the reduced synaptic activity we observed in late stage (D85) FXS FMR1− neurons.
Recently, FMRP has been associated with epigenetic regulation (i.e. nucleosome remodelling and post-translational histone methylation) (Parikshak et al., 2013). Aberrant DNA methylation patterns at CpG-dense regions in FXS FMR1− cells suggests that FMRP may play a role (either directly or indirectly) in the regulation of DNA methylation at specific genomic sequences. Our integrative analysis also provides evidence that, in the absence of FMRP, aberrant DNA methylation patterns affect gene expression during differentiation. To our knowledge this is a novel, but not entirely unexpected, feature of FMRP given the large number of genes it regulates. While we did not pinpoint the exact role of FMRP in epigenetic or transcriptional regulation, this function is likely mediated via modulation of the expression of epigenetic regulators, and it is intriguing that this may occur in a cell type-specific manner during brain development.
Interestingly, we observed a constitutive downregulation of AZIN1 expression in all FXS FMR1− cells relative to non-disease. AZIN1 (antizyme inhibitor 1) is involved in the regulation of polyamine biosynthesis, which has been shown to have effects on DNA methylation in embryonic-like cells (Heby, 1995; Frostesjo et al., 1997). While a link between polyamine levels and FXS remains uninvestigated, aberrant polyamine synthesis has been attributed to Snyder-Robinson syndrome; an X-linked disorder also characterized by facial abnormalities, delayed development and intellectual disability (Lauren Cason et al., 2003; de Alencastro et al., 2008).
The results reported here contribute to a more detailed understanding of events underlying neuronal dysfunction in FXS and ASD. Specifically, they indicate that gene expression and DNA methylation patterns begin to show abnormalities very early during neurogenesis. It will be interesting to determine whether these characteristics are shared by multiple neurodevelopmental diseases, which would provide insight into common interventions that might mitigate the neuropathology in these diseases.
Supplementary Material
Acknowledgements
The male human ESC line, SAB113D, was a gift from Ana Krtolica (StemLifeLine Inc.). Funding for experiments using this cell line came from the California Institute for Regenerative Medicine. We wish to thank for J. Darnell (Rockefeller) for advice on FMRP antibodies as well as A. Zhang, A. Bratt-Leal, and other members of the Loring laboratory for suggestions and insights.
Funding
This research was supported by funding from CIRM (CL1-00502, TR01250, RM1-01717, and TR3-05603) to J.F.L., the National Institute of Mental Health R33MH087925-04 (J.F.L.), the National Institute on Drug Abuse R21DA032975-01 (P.P.S, J.F.L.), the Hungarian Brain Research Program KTIA_NAP_13-2014-0018 (A.Sz.), and NICHD HD02274 and NIH GM113929 (F.T.). K.L.N. was supported by an Autism Speaks Fellowship.
Supplementary material
Supplementary material is available at Brain online.
Glossary
Abbreviations
- ASD
autism spectrum disorder
- DMC
differentially methylated cytosine
- FMRP
fragile X mental retardation protein
- FXS
fragile X syndrome
- h(i)PSC
human (induced) pluripotent stem cell
- NPC
neuronal progenitor cell
- SNP
single nucleotide polymorphism
- WGCNA
weighted gene correlation network analysis
References
- Antar LN, Li C, Zhang H, Carroll RC, Bassell GJ. Local functions for FMRP in axon growth cone motility and activity-dependent regulation of filopodia and spine synapses. Mol Cell Neurosci 2006; 32: 37–48. [DOI] [PubMed] [Google Scholar]
- Aruga J, Mikoshiba K. Identification and characterization of Slitrk, a novel neuronal transmembrane protein family controlling neurite outgrowth. Mol Cell Neurosci 2003; 24: 117–29. [DOI] [PubMed] [Google Scholar]
- Basu SN, Kollu R, Banerjee-Basu S. AutDB: a gene reference resource for autism research. Nucleic Acids Res 2009; 37: D832–6. [DOI] [PMC free article] [PubMed] [Google Scholar]
- Brennand K, Savas JN, Kim Y, Tran N, Simone A, Hashimoto-Torii K. et al. Phenotypic differences in hiPSC NPCs derived from patients with schizophrenia. Mol Psychiatry 2015; 20: 361–8. [DOI] [PMC free article] [PubMed] [Google Scholar]
- Brown V, Jin P, Ceman S, Darnell JC, O'Donnell WT, Tenenbaum SA. et al. Microarray identification of FMRP-associated brain mRNAs and altered mRNA translational profiles in fragile X syndrome. Cell 2001; 107: 477–87. [DOI] [PubMed] [Google Scholar]
- Castren M, Tervonen T, Karkkainen V, Heinonen S, Castren E, Larsson K. et al. Altered differentiation of neural stem cells in fragile X syndrome. Proc Natl Acad Sci USA 2005; 102: 17834–9. [DOI] [PMC free article] [PubMed] [Google Scholar]
- Chambers SM, Fasano CA, Papapetrou EP, Tomishima M, Sadelain M, Studer L. Highly efficient neural conversion of human ES and iPS cells by dual inhibition of SMAD signaling. Nat Biotechnol 2009; 27: 275–80. [DOI] [PMC free article] [PubMed] [Google Scholar]
- Colak D, Zaninovic N, Cohen MS, Rosenwaks Z, Yang WY, Gerhardt J. et al. Promoter-bound trinucleotide repeat mRNA drives epigenetic silencing in fragile X syndrome. Science (New York, NY) 2014; 343: 1002–5. [DOI] [PMC free article] [PubMed] [Google Scholar]
- Darnell JC, Van Driesche SJ, Zhang C, Hung KY, Mele A, Fraser CE. et al. FMRP stalls ribosomal translocation on mRNAs linked to synaptic function and autism. Cell 2011; 146: 247–61. [DOI] [PMC free article] [PubMed] [Google Scholar]
- de Alencastro G, McCloskey DE, Kliemann SE, Maranduba CM, Pegg AE, Wang X. et al. New SMS mutation leads to a striking reduction in spermine synthase protein function and a severe form of Snyder-Robinson X-linked recessive mental retardation syndrome. J Med Genet 2008; 45: 539–43. [DOI] [PubMed] [Google Scholar]
- Doers ME, Musser MT, Nichol R, Berndt ER, Baker M, Gomez TM. et al. iPSC-derived forebrain neurons from FXS individuals show defects in initial neurite outgrowth. Stem Cells Dev 2014; 23: 1777–87. [DOI] [PMC free article] [PubMed] [Google Scholar]
- Feyeux M, Bourgois-Rocha F, Redfern A, Giles P, Lefort N, Aubert S. et al. Early transcriptional changes linked to naturally occurring Huntington's disease mutations in neural derivatives of human embryonic stem cells. Hum Mol Genet 2012; 21: 3883–95. [DOI] [PubMed] [Google Scholar]
- Fritzmann J, Morkel M, Besser D, Budczies J, Kosel F, Brembeck FH. et al. A colorectal cancer expression profile that includes transforming growth factor β inhibitor BAMBI predicts metastatic potential. Gastroenterology 2009; 137: 165–75. [DOI] [PubMed] [Google Scholar]
- Frostesjo L, Holm I, Grahn B, Page AW, Bestor TH, Heby O. Interference with DNA methyltransferase activity and genome methylation during F9 teratocarcinoma stem cell differentiation induced by polyamine depletion. J Biol Chem 1997; 272: 4359–66. [DOI] [PubMed] [Google Scholar]
- Funayama M, Ohe K, Amo T, Furuya N, Yamaguchi J, Saiki S. et al. CHCHD2 mutations in autosomal dominant late-onset Parkinson's disease: a genome-wide linkage and sequencing study. Lancet Neurol 2015; 14: 274–82. [DOI] [PubMed] [Google Scholar]
- Halevy T, Czech C, Benvenisty N. Molecular mechanisms regulating the defects in fragile X syndrome neurons derived from human pluripotent stem cells. Stem Cell Rep 2015; 4: 37–46. [DOI] [PMC free article] [PubMed] [Google Scholar]
- Heby O. DNA methylation and polyamines in embryonic development and cancer. Int J Dev Biol 1995; 39: 737–57. [PubMed] [Google Scholar]
- Huber KM, Gallagher SM, Warren ST, Bear MF. Altered synaptic plasticity in a mouse model of fragile X mental retardation. Proc Natl Acad Sci USA 2002; 99: 7746–50. [DOI] [PMC free article] [PubMed] [Google Scholar]
- Iossifov I, Ronemus M, Levy D, Wang Z, Hakker I, Rosenbaum J. et al. De novo gene disruptions in children on the autistic spectrum. Neuron 2012; 74: 285–99. [DOI] [PMC free article] [PubMed] [Google Scholar]
- Irwin SA, Galvez R, Greenough WT. Dendritic spine structural anomalies in fragile-X mental retardation syndrome. Cerebral Cortex 2000; 10: 1038–44. [DOI] [PubMed] [Google Scholar]
- Lauren Cason A, Ikeguchi Y, Skinner C, Wood TC, Holden KR, Lubs HA. et al. X-linked spermine synthase gene (SMS) defect: the first polyamine deficiency syndrome. Eur J Hum Genet 2003; 11: 937–44. [DOI] [PubMed] [Google Scholar]
- Li C, Bassell GJ, Sasaki Y. Fragile X mental retardation protein is involved in protein synthesis-dependent collapse of growth cones induced by Semaphorin-3A. Front Neural Circuits 2009; 3: 11. [DOI] [PMC free article] [PubMed] [Google Scholar]
- Maksimovic J, Gordon L, Oshlack A. SWAN: subset-quantile within array normalization for illumina infinium HumanMethylation450 BeadChips. Genome Biol 2012; 13: R44. [DOI] [PMC free article] [PubMed] [Google Scholar]
- McLean CY, Bristor D, Hiller M, Clarke SL, Schaar BT, Lowe CB. et al. GREAT improves functional interpretation of cis-regulatory regions. Nat Biotechnol 2010; 28: 495–501. [DOI] [PMC free article] [PubMed] [Google Scholar]
- McLennan R, Schumacher LJ, Morrison JA, Teddy JM, Ridenour DA, Box AC. et al. Neural crest migration is driven by a few trailblazer cells with a unique molecular signature narrowly confined to the invasive front. Development 2015; 142: 2014–25. [DOI] [PubMed] [Google Scholar]
- McLennan Y, Polussa J, Tassone F, Hagerman R. Fragile X syndrome. Curr Genomics 2011; 12: 216–24. [DOI] [PMC free article] [PubMed] [Google Scholar]
- Mekhoubad S, Bock C, de Boer AS, Kiskinis E, Meissner A, Eggan K. Erosion of dosage compensation impacts human iPSC disease modeling. Cell Stem Cell 2012; 10: 595–609. [DOI] [PMC free article] [PubMed] [Google Scholar]
- Miyashiro KY, Beckel-Mitchener A, Purk TP, Becker KG, Barret T, Liu L. et al. RNA cargoes associating with FMRP reveal deficits in cellular functioning in Fmr1 null mice. Neuron 2003; 37: 417–31. [DOI] [PubMed] [Google Scholar]
- Muller FJ, Schuldt BM, Williams R, Mason D, Altun G, Papapetrou EP. et al. A bioinformatic assay for pluripotency in human cells. Nat Methods 2011; 8: 315–17. [DOI] [PMC free article] [PubMed] [Google Scholar]
- Nazor KL, Altun G, Lynch C, Tran H, Harness JV, Slavin I. et al. Recurrent variations in DNA methylation in human pluripotent stem cells and their differentiated derivatives. Cell Stem Cell 2012; 10: 620–34. [DOI] [PMC free article] [PubMed] [Google Scholar]
- Nolin SL, Glicksman A, Houck GE, Brown WT, Dobkin CS. Mosaicism in fragile X affected males. Am J Med Genet 1994; 51: 509–12. [DOI] [PubMed] [Google Scholar]
- Onichtchouk D, Chen Y-G, Dosch R, Gawantka V, Delius H, Massague J. et al. Silencing of TGF-[beta] signalling by the pseudoreceptor BAMBI. Nature 1999; 401: 480–5. [DOI] [PubMed] [Google Scholar]
- Parikshak NN, Luo R, Zhang A, Won H, Lowe JK, Chandran V. et al. Integrative functional genomic analyses implicate specific molecular pathways and circuits in autism. Cell 2013; 155: 1008–21. [DOI] [PMC free article] [PubMed] [Google Scholar]
- Park CY, Halevy T, Lee DR, Sung JJ, Lee JS, Yanuka O. et al. Reversion of FMR1 methylation and silencing by editing the triplet repeats in fragile X iPSC-derived neurons. Cell Rep 2015; 13: 234–41. [DOI] [PubMed] [Google Scholar]
- Passier R, Orlova V, Mummery C. Complex tissue and disease modeling using hiPSCs. Cell Stem Cell 2016; 18: 309–21. [DOI] [PubMed] [Google Scholar]
- Peñagarikano O, Abrahams Brett S, Herman Edward I, Winden Kellen D, Gdalyahu A, Dong H. et al. Absence of CNTNAP2 leads to epilepsy, neuronal migration abnormalities, and core autism-related deficits. Cell 2011; 147: 235–46. [DOI] [PMC free article] [PubMed] [Google Scholar]
- Pinto D, Pagnamenta AT, Klei L, Anney R, Merico D, Regan R. et al. Functional impact of global rare copy number variation in autism spectrum disorders. Nature 2010; 466: 368–72. [DOI] [PMC free article] [PubMed] [Google Scholar]
- Pretto D, Yrigollen CM, Tang HT, Williamson J, Espinal G, Iwahashi CK. et al. Clinical and molecular implications of mosaicism in FMR1 full mutations. Front Genet 2014; 5: 318. [DOI] [PMC free article] [PubMed] [Google Scholar]
- Reiner A, Yekutieli D, Benjamini Y. Identifying differentially expressed genes using false discovery rate controlling procedures. Bioinformatics (Oxford, England) 2003; 19: 368–75. [DOI] [PubMed] [Google Scholar]
- Saffary R, Xie Z. FMRP regulates the transition from radial glial cells to intermediate progenitor cells during neocortical development. J Neurosci 2011; 31: 1427–39. [DOI] [PMC free article] [PubMed] [Google Scholar]
- Seo M, Lee WH, Suk K. Identification of novel cell migration-promoting genes by a functional genetic screen. FASEB J 2010; 24: 464–78. [DOI] [PubMed] [Google Scholar]
- Sheridan SD, Theriault KM, Reis SA, Zhou F, Madison JM, Daheron L. et al. Epigenetic characterization of the FMR1 gene and aberrant neurodevelopment in human induced pluripotent stem cell models of fragile X syndrome. PLoS One 2011; 6: e26203. [DOI] [PMC free article] [PubMed] [Google Scholar]
- Shi Y, Kirwan P, Smith J, Robinson HP, Livesey FJ. Human cerebral cortex development from pluripotent stem cells to functional excitatory synapses. Nat Neurosci 2012; 15: 477–86, S1. [DOI] [PMC free article] [PubMed] [Google Scholar]
- Smyth GK. Linear models and empirical bayes methods for assessing differential expression in microarray experiments. Stat Appl Genet Mol Biol 2004; 3: Article3. [DOI] [PubMed] [Google Scholar]
- Telias M, Kuznitsov-Yanovsky L, Segal M, Ben-Yosef D. Functional Deficiencies in Fragile X Neurons Derived from Human Embryonic Stem Cells. J Neurosci 2015; 35: 15295–306. [DOI] [PMC free article] [PubMed] [Google Scholar]
- Telias M, Segal M, Ben-Yosef D. Neural differentiation of fragile X human Embryonic Stem Cells reveals abnormal patterns of development despite successful neurogenesis. Dev Biol 2013; 374: 32–45. [DOI] [PubMed] [Google Scholar]
- Telias M, Segal M, Ben-Yosef D. Electrical maturation of neurons derived from human embryonic stem cells. F1000Res 2014; 3: 196. [DOI] [PMC free article] [PubMed] [Google Scholar]
- Tervonen TA, Louhivuori V, Sun X, Hokkanen ME, Kratochwil CF, Zebryk P. et al. Aberrant differentiation of glutamatergic cells in neocortex of mouse model for fragile X syndrome. Neurobiol Dis 2009; 33: 250–9. [DOI] [PubMed] [Google Scholar]
- Urbach A, Bar-Nur O, Daley GQ, Benvenisty N. Differential modeling of fragile X syndrome by human embryonic stem cells and induced pluripotent stem cells. Cell Stem Cell 2010; 6: 407–11. [DOI] [PMC free article] [PubMed] [Google Scholar]
- Willsey AJ, Sanders SJ, Li M, Dong S, Tebbenkamp AT, Muhle RA. et al. Coexpression networks implicate human midfetal deep cortical projection neurons in the pathogenesis of autism. Cell 2013; 155: 997–1007. [DOI] [PMC free article] [PubMed] [Google Scholar]
Associated Data
This section collects any data citations, data availability statements, or supplementary materials included in this article.