Abstract
Fibrates and their receptor, namely peroxisome proliferator-activated receptor α (PPARα), have been reported to regulate bile acid (BA) synthesis and transport. However, the effect of fibrate treatment and PPARα activation on BA homeostasis remains controversial. In this study, both wild-type (WT) and PPARα-null male mice were treated with clofibrate (CLOF) for 4 days to evaluate the effects of short-term PPARα activation on BA homeostasis. Although a decrease in total BAs (ΣBAs) was observed in livers of CLOF-treated WT mice, it was not observed in PPARα-null mice. CLOF-mediated decrease in ΣBAs in the liver was not likely due to the reduction in BA synthesis or BA uptake, as evidenced by an increase in the BA synthetic enzyme (Cyp7a1) and 2 BA uptake transporters (Na (+)-taurocholate cotransporting polypeptide [Ntcp] and organic anion transporting polypeptide [Oatp]1b2). Instead, the decrease in liver BAs by CLOF is largely a result of increased biliary excretion of BAs, which was associated with a significant induction of the canalicular efflux transporter (bile salt export pump [Bsep]) in the liver. The PPARα-mediated increase in Cyp7a1 in CLOF-treated WT mice was not due to farnesoid X receptor (Fxr)-small heterodimer partner (Shp) signaling in the liver, but due to suppression of Fxr- fibroblast growth factor15 signaling in the ileum. Additionally, CLOF also suppressed intestinal BA transporters (apical sodium-dependent bile acid transporter and organic solute transporterβ) and cholesterol efflux transporters (Abcg5 and Abcg8) in a PPARα-dependent manner. In summary, this study provides the first comprehensive analysis on the effect of a short-term CLOF treatment on BA homeostasis, and revealed an essential role of PPARα in regulating BA synthesis, transport and signaling.
Keywords: biliary excretion, PPARα, bile acids
For decades fibrates have been widely used as hypolipidemic drugs to efficiently reduce plasma triglyceride levels (Schoonjans et al., 1996). The finding that fibrates lower serum alkaline phosphate (ALP) initiated numerous clinical studies to explore the efficacy of fibrates to treat cholestasis, a condition characterized with impaired bile flow in patients with primary biliary cirrhosis and primary sclerosing cholangitis (Day et al., 1993; Honda et al., 2013). These therapeutic effects of fibrates are mainly the result of activation of the peroxisome proliferator-activated receptor alpha (PPARα), a nuclear receptor most highly expressed in liver, which regulates hepatic pathways for energy homeostasis, hepatic detoxification, inflammatory response, and hepatocellular carcinogenesis (Rakhshandehroo et al., 2010).
The synthesis of bile acids (BAs) from cholesterol is the predominant mechanism to eliminate cholesterol from the body. The detergent properties make BAs not only an effective emulsifier to promote intestinal nutrient absorption and solubilize biliary cholesterol, but also are cytotoxic chemicals at high concentrations (Hofmann, 2009a). Individual BAs have distinct structures dependent on the number and position of hydroxyl groups, as well as conjugation with taurine and glycine. The structural diversity of BAs confers different hydrophobicity and thus various capabilities to solubilize cholesterol and to cause hepatotoxicity (Heuman, 1989). For this reason, the synthesis, transport, and metabolism of BAs are tightly regulated to achieve their normal physiological functions (Hofmann, 2009a,b).
Although the hypocholesterolemic effect of fibrates has been partially attributed to their effect on BA metabolism, controversial results have been reported on the in vitro and in vivo role of fibrates and PPARα in regulating BA synthesis. In liver, BAs are synthesized predominantly in the classic pathway, and to a less extent the alternative pathway. Cyp7a1 is the rate-limiting enzyme in the classic pathway of BA synthesis, and Cyp8b1 determines the ratio of cholic acid (CA) to chenodeoxycholic acid (CDCA). Both fatty acids (endogenous PPARα ligands) and Wy14643 (a potent PPARα agonist) activate murine and human CYP7A1 promoters through PPARα in transfected rat hepatoma cells (Cheema and Agellon, 2000). This is contradictory to 2 previous studies that PPARα and Wy14643 repress both human and rat CYP7A1 promoters in a human liver cell line (Marrapodi and Chiang, 2000; Patel et al., 2000). Cyp8b1 mRNA was increased by both 1 week of Wy14643 (2-fold increase) and 24-h fasting (>4-fold increase), which is PPARα-dependent (Hunt et al., 2000). Cyp7a1 mRNA was not altered by one week of Wy14643, but increased about 2-fold by 24-h fasting in a PPARα-dependent manner. In contrast, both 17 days of ciprofibrate and 12 months of bezafibrate in mice were shown to reduce Cyp7a1 about 78% and 92%, respectively (Hays et al., 2005; Post et al., 2001). These studies demonstrate a contradictory role of PPARα in regulating BA synthesis, with PPARα being involved in ciprofibrate-mediated Cyp7a1 suppression, but not in bezafibrate-mediated effects. Thus, significant gaps remain in our understanding of the effect of fibrate treatments and PPARα activation on BA homeostasis.
Despite a variety of studies addressing the effects of fibrates on BAs, comprehensive analysis of PPARα-mediated effects on BA profile, synthesis, transport and signaling is surprisingly limited. Previous studies frequently involved long term feeding of fibrates to investigate the effects of PPARα activation on BA synthesis. In such circumstances, the exact role of PPARα is easily obscured by secondary and indirect effects following fibrate treatment. For this reason, this study aimed to systematically investigate the effects of short-term PPARα activation on BA homeostasis. Clofibrate (CLOF) was chosen for this study due to its 10-fold higher selectivity for PPARα over other PPAR isoforms, as well as its wide use as an experimental PPARα agonist in rodents (Dreyer et al., 1993). Both wild-type (WT) and PPARα-null male mice were treated with CLOF for 4 days, and the PPARα-dependent effects of CLOF on liver and bile BA profiles, as well as the major pathways of BA regulation, synthesis, and transport were investigated.
MATERIALS AND METHODS
Chemicals and reagents
BA standards used in this study were purchased from either Steraloids, Inc. (Newport, Rhode Island) or Sigma-Aldrich (St Louis, Missouri). Clofibric acid (CLOF) was purchased from Sigma-Aldrich Co. Chloroform, agarose, and ethidium bromide were purchased from AMRESCO Inc. (Solon, Ohio). RNA-Bee was purchased from TelTest Inc. (Friendswood, Texas). All other chemicals, unless indicated, were purchased from Sigma-Aldrich Co.
Animals and treatment
Adult male C57BL/6 mice were purchased from Charles River Laboratories Inc. (Wilmington, Massachusetts). PPARα-null mice were provided by the laboratory of Dr Frank J. Gonzalez (Lee et al., 1995). All animal studies were approved by the Institutional Animal Care and Use Committee at the University of Kansas Medical Center. All mice were housed in an Association for Assessment and Accreditation of Laboratory Animal Care-accredited facility with a 12:12-h light:dark cycle and provided chow (Teklad Rodent Diet No. 8604, Harlan Teklad, Madison, WI) and water ad libitum. In this study, corn oil (CO) or CLOF (300 mg/kg in CO) in a volume of 5 ml/kg was administered (i.p.) daily for 4 consecutive days to male WT and PPARα-null mice. This CLOF treatment regimen has been shown to activate PPARα and induce PPARα target genes in livers of mice (Petrick and Klaassen, 2007).
Sample collection
At 24 h after the fourth dose of CLOF, male WT and PPARα-null mice (n = 6–8/group) were anesthetized using ketamine (100 mg/kg, i.p.)/midazolam (5 mg/kg, i.p.) and the common bile duct of each mouse was cannulated with a 30-gauge needle attached to PE-10 tubing. Bile was collected from the cannula for 40 min in pre-weighed tubes on ice. The volumes of bile were determined gravimetrically, using 1.0 for specific gravity.
Another group of mice (n = 6–8/group) was anesthetized with 50 mg/kg of pentobarbital at 24 h after the last dose, blood was collected from the retro-orbital sinus, and serum was obtained by centrifuging blood at 6000 × g for 15 min. Livers, with gallbladders removed, and ileum segments were harvested from the same animals, washed, frozen in liquid nitrogen, and stored at −80 °C.
BA quantification
Sample extraction and quantification of individual BAs were performed according to an ultraperformance liquid chromatography-tandem mass spectrometry (UPLC-MS/MS) method described previously in Zhang and Klaassen (2010).
Total RNA isolation
Total RNA was isolated using RNA-Bee reagent (Tel-Test Inc., Friendswood, Texas) according to the manufacturer’s protocol. Total RNA concentrations were quantified spectrophotometrically at 260 nm. Integrity of RNA samples was determined by formaldehyde-agarose gel electrophoresis with visualization by ethidium bromide fluorescence under ultraviolet light.
Multiplex suspension array
The mRNAs were quantified using mutiplex suspension arrays (Panomics/Affymetrix, Fremont, California). Individual gene accession numbers can be viewed at www.panomics.com (sets No. 21330 and No. 21383). Samples were analyzed using a Bio-Plex 200 System Array reader with Luminex 100 xMAP technology, and the data were acquired using Bio-Plex Data Manager version 5.0 (Bio-Rad, Hercules, California). Assays were performed according to the manufacturer’s protocol. The mRNA data were normalized to Rpl13a mRNA and presented as relative fold change to the control group.
Statistical analysis
Data were analyzed with Student’s t test. Statistical significance was set at p < .05. Bars represent mean ± SEM (n > 5 per group).
RESULTS
CLOF Decreased BA Concentrations in Livers of WT But Not PPARα-Null Mice
Although long-term treatment with PPARα agonists (ciprofibrate and bezafibrate) have been shown to suppress BA biosynthesis in mice (Hays et al., 2005; Post et al., 2001), the effect of short-term PPARα activation on liver BA profile in mice remains unclear. As shown in Figure 1A, CLOF decreased the concentrations of most BAs in livers of WT mice, resulting in a 41% decrease in total BA (ΣBA)concentration. This decrease was not specific for a certain type of BAs, because both conjugated and unconjugated BAs, primary and secondary BAs, as well as 12α-OH and non12α-OH BAs, were all decreased or tended to be decreased. In CLOF-treated WT mice, statistically significant decreases were observed for TCDCA (39%↓), Tα + β muricholic acid (MCA) (44%↓), TUDCA (54%↓), CA (63%↓) and βMCA (63%↓). Despite decreases in individual BAs in livers of CLOF-treated WT mice, the percentages of the major BA categories were minimally changed (Figure 1B). In contrast, CLOF did not change either individual BAs or ΣBAs in livers of PPARα-null mice. To conclude, CLOF decreased the concentrations of ΣBAs in livers of WT mice, which is dependent on PPARα.
Figure 1.
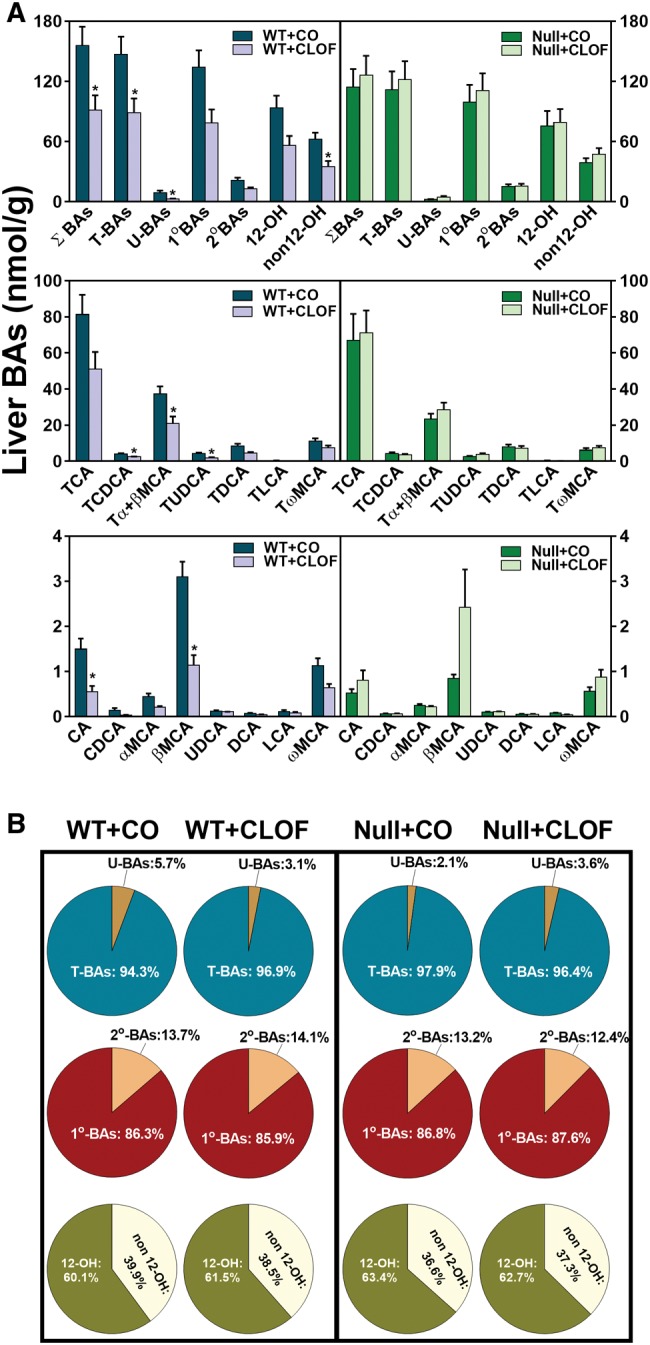
Effect of CLOF on concentrations of BAs in livers of male WT and PPARα-null mice. CO or CLOF (300 mg/kg) was administered daily (i.p.) for 4 consecutive days to male WT and PPARα-null mice (n = 6–8 per treatment group). A, Concentrations of ΣBAs and individual BAs were quantified by UPLC-MS/MS. Data represent means ± SEM (n > 5 per group). *p < .05 versus vehicle treatment group. B, The compositions of major BA categories were calculated as the percentage of ΣBAs. Data represent means (n > 5 per group).
CLOF Slightly Increased Liver Weight and Bile Flow Relative to Body Weight in WT Mice, But Not in PPARα-Null Mice
Administration of fibrates has been shown to produce hepatomegaly and hepatic peroxisome proliferation (Gonzalez et al., 1998). In this study, treatment with 300 mg/kg CLOF for 4 consecutive days was chosen to activate PPARα, which was confirmed by a marked increase in the mRNA expression of the PPARα target gene Cyp4a14 in livers of WT but not PPARα-null mice (Zhang et al., 2012). As shown in Figure 2, CLOF slightly increased liver weight (LW) per body weight (BW) (approximately 10%↑) in WT mice. Additionally, CLOF also produced a statistically significant increase in bile flow, whether calculated per unit LW (17%↑) or per unit BW (20%↑). In contrast, CLOF had an opposite effect on the LW (about 15%↓) in PPARα-null mice. Although CLOF also increased bile flow of PPARα-null mice when calculated per unit LW, this was likely due to the decrease in LW, because no change was observed in bile flow of PPARα-null mice when it was normalized to BW. Therefore, the current data suggest that PPARα activation is involved in CLOF-mediated increase in LW and bile flow in male WT mice.
Figure 2.
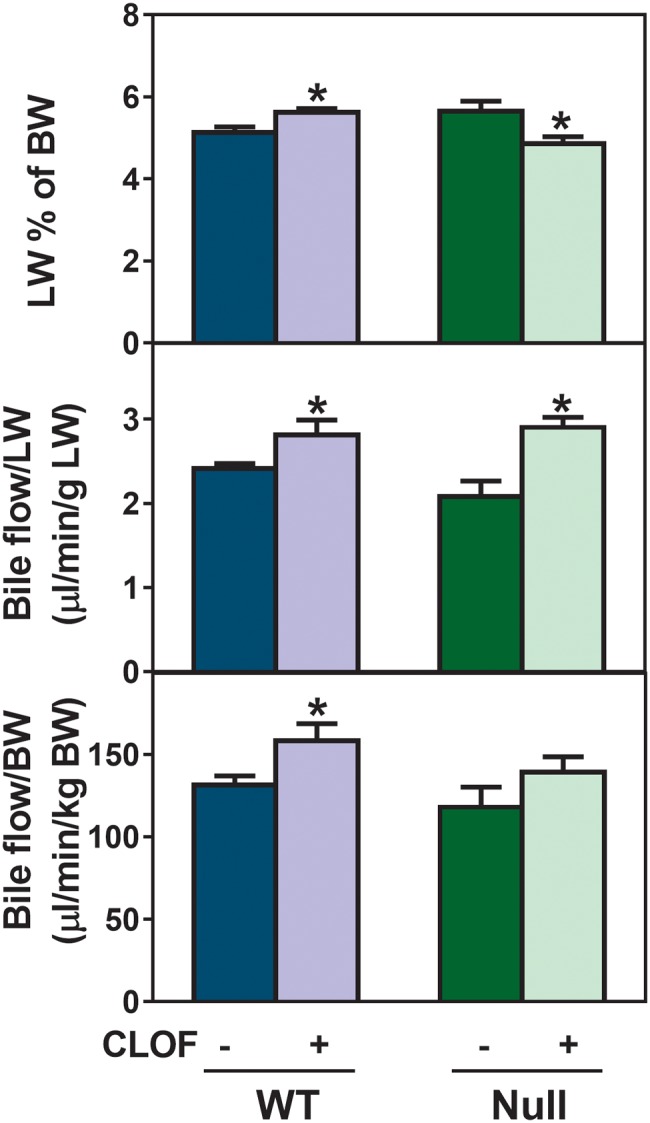
Effect of CLOF on LW and bile flow in WT and PPARα-null mice. CO or CLOF (300 mg/kg) was administered daily (i.p.) for 4 consecutive days to male WT and PPARα-null mice (n = 6-8 per treatment group). On day 5, mice were anesthetized and bile was collected for 40 minutes. LW is expressed as a percent of BW. (A) Bile flow rates were normalized to LW (B) and BW (C). Data represent means ± SEM. Asterisks (*) denote statistically different from vehicle control (p < .05).
CLOF Increased the Biliary Excretion of BAs in WT But Not in PPARα-Null Mice
BAs are the major determinant of bile flow. In this study, individual BA concentrations in the bile of WT and PPARα-null mice were quantified, and the biliary excretion of individual BAs was calculated per unit BW (Figure 3A). CLOF increased the biliary excretion of ΣBAs (1-fold ↑) in WT mice, with significant increases in total non12α-OH BAs (76%↑), TCA (1.2-fold ↑), TαMCA (1-fold %↑), TωMCA (1.3-fold ↑), and TUDCA (1-fold ↑). In contrast, alterations in the biliary excretion of BAs in PPARα-null mice were resistant to CLOF treatment, except for an increase in TωMCA (59%↑). BA composition is critical for cholesterol solubility in the bile and lipid absorption in the intestine. As shown in Figure 3B, the majority of BAs in bile were conjugated primary BAs. CLOF had little effect on the percentages of major categories of BAs in bile of WT mice (Figure 3B). Although the total concentration of non12-hydroxylated bile acid (12-OH) BAs was increased in CLOF-treated WT mice, the percentage of non12-OH BAs tended to decrease. To summarize, PPARα activation by CLOF mediates the increased biliary excretion of BAs by CLOF treatment in WT mice, with little effect on the percentage of major BA categories in the bile.
Figure 3.
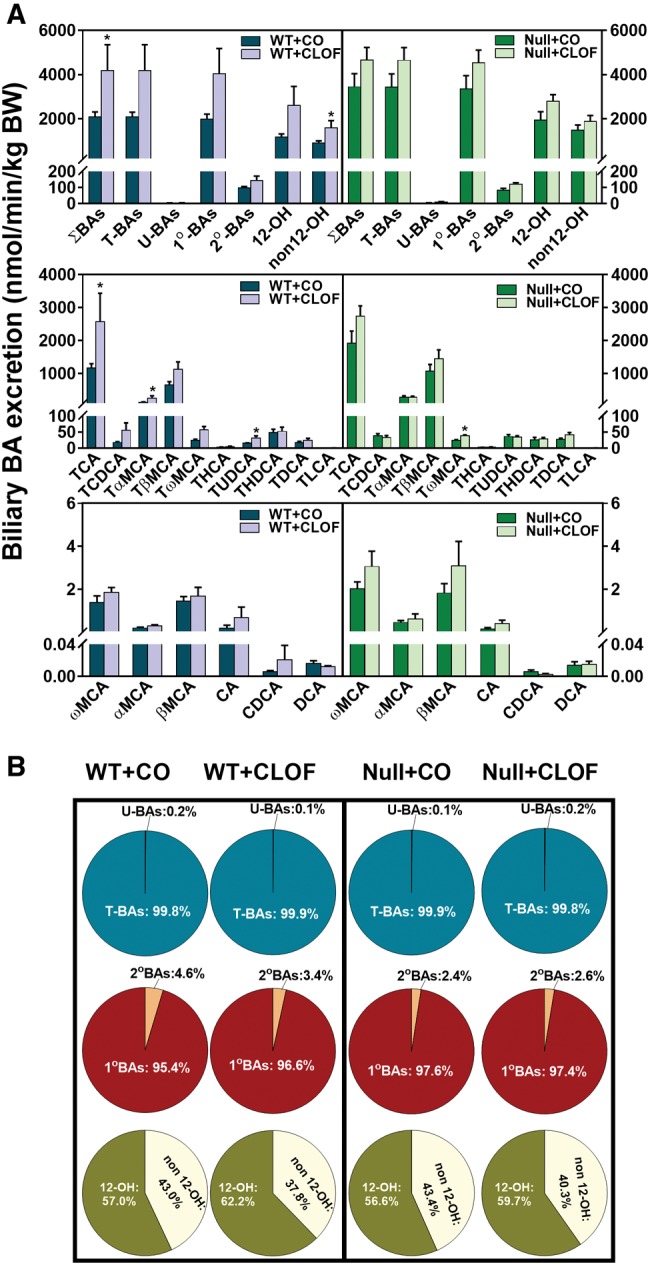
Effect of CLOF on biliary excretion of BAs in WT and PPARα-null mice. CO or CLOF (300 mg/kg) was administered daily (i.p.) for 4 consecutive days to male WT and PPARα-null mice (n = 6–8 per treatment group). A, BA concentrations in the bile were quantified by UPLC-MS/MS, and the excretion rate was normalized to BW. The biliary excretion of ΣBAs, total conjugated BAs, and total unconjugated BAs, calculated by summation of corresponding BAs. Data represent means ± SEM *p < .05 versus vehicle treatment group. B, The composition of major BA categories were calculated as the percentage of ΣBAs.
CLOF Decreased Serum BA Concentrations in WT and PPARα-Null Mice
When compared with liver, only small quantities of BAs are found in the peripheral circulation. As shown in Figure 4A, CLOF decreased the concentration of ΣBAs in serum of WT mice (approximately 48%↓), and surprisingly they were also significantly decreased in PPARα-null mice (50%↓). It should be noted that the concentration of ΣBAs in serum was about 44% higher in WT mice than in PPARα-null mice. Significant decreases were observed for TUDCA (98%↓), TDCA (83%↓), TωMCA (46%↓), and CA (53%↓) in the serum of CLOF-treated WT mice, as well as TCA (68%↓), Tα + βMCA (66%↓) ,and TωMCA (58%↓) in the serum of CLOF-treated PPARα-null mice. As a result, CLOF decreased the percentages of total conjugated BAs, total primary BAs, and total CA-derived BAs (12-OH BAs) in both WT and PPARα-null mice (Figure 4B). To summarize, CLOF caused a suppressive effect on BA concentrations in serum of WT and PPARα-null mice.
Figure 4.
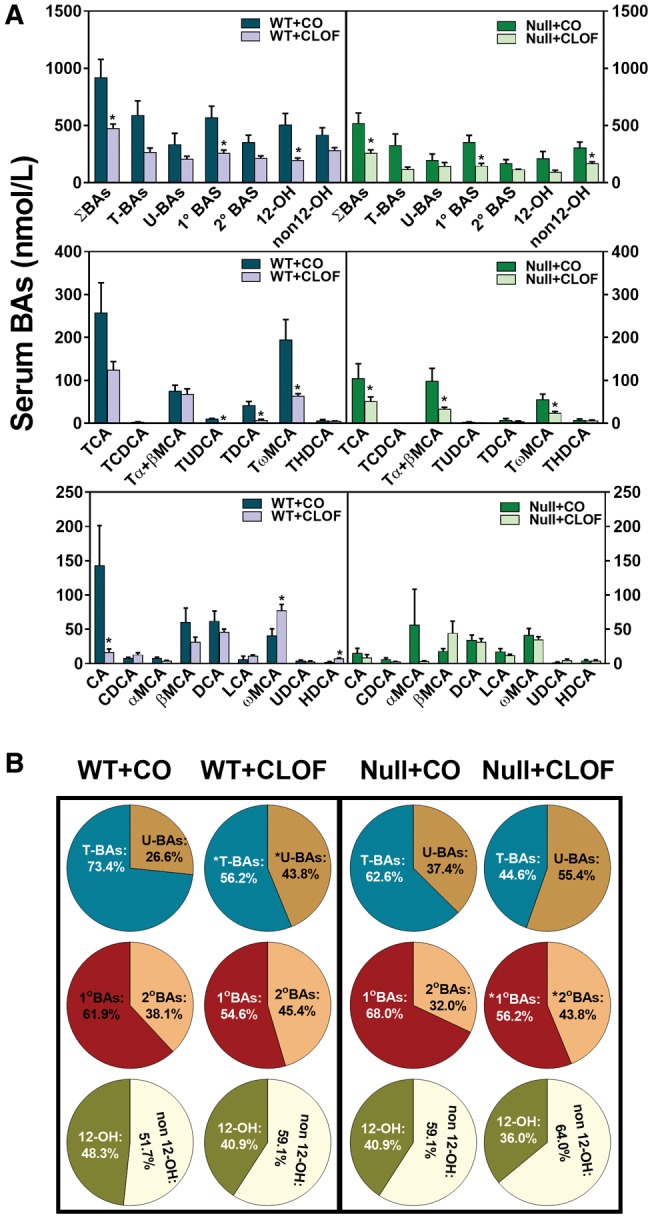
Effect of CLOF on concentrations of BAs in serum of male WT and PPARα-null mice. CO or CLOF (300 mg/kg) was administered daily (i.p.) for 4 consecutive days to male WT and PPARα-null mice (n = 6–8 per treatment group). A, Concentrations of ΣBAs and individual BAs were quantified by UPLC-MS/MS. B, The composition of major BA categories were calculated as the percentage of ΣBAs. Data represent means ± SEM (n > 5 per group). *p < .05 versus vehicle treatment group.
CLOF Influenced Hepatic Expression of BA-Synthetic Enzymes and Transporters in WT But Not in PPARα-Null Mice
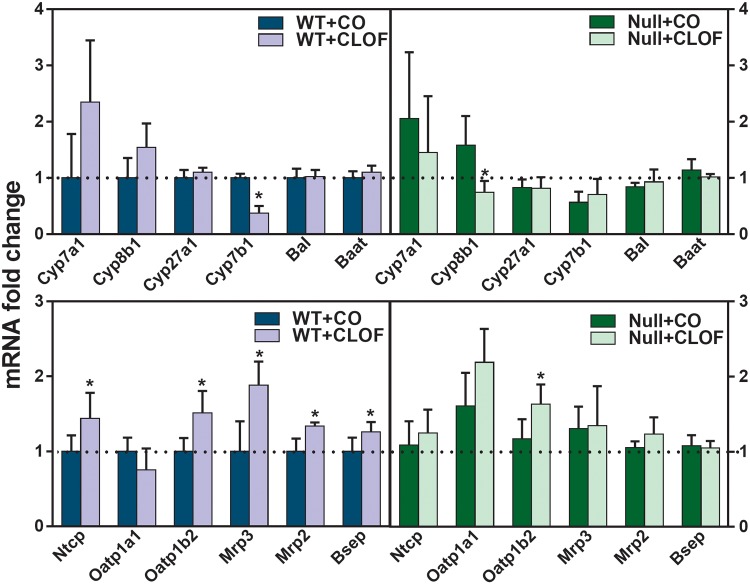
As shown in Figure 5, CLOF in WT mice tended to, but not significantly, produce a 134% increase in Cyp7a1 mRNA expression. In contrast, CLOF significantly decreased Cyp7b1 (63%↓). CLOF also significantly induced the BA uptake transporters (Na (+)-taurocholate cotransporting polypeptide [Ntcp] 43%↑; organic anion transporting polypeptide [Oatp]1b2 51%↑) and 3 efflux transporters (Mrp3 88%↑; Mrp2 34%↑; bile salt export pump [Bsep] 26%↑) in livers of WT mice. In contrast, CLOF given to PPARα-null mice had minimal effects on the hepatic expression of genes involved in BA synthesis and transport, except for a decrease in Cyp8b1 (53%↓) and an increase in Oatp1b2 (39%↑). Overall, CLOF showed an inductive effect on BA synthetic enzymes and transporters in livers of WT mice, and PPARα appears to be involved in CLOF-mediated regulation of BA-related genes.
Figure 5.
Effect of CLOF on mRNA of BA synthetic enzymes and transporters in livers of male WT and PPARα-null mice. CO or CLOF (300 mg/kg) was administered daily (i.p.) for 4 consecutive days to male WT and PPARα-null mice (n = 6–8 per treatment group). QuantiGene Plex 2.0 Assay was performed to measure the gene expression of BA-synthetic enzymes (Cyp7a1, Cyp8b1, Cyp27a1, Cyp7b1, bile acid CoA ligase [Bal], and bile acid CoA:amino acid N-acyltransferase [Baat]) and BA transporters (Ntcp, Oatp1a1, Oatp1b2, Mrp3, Mrp2 and Bsep). Relative mRNA levels were calculated with vehicle-treated WT male mice set as 100%. Data represent means ± SEM *p < .05 versus vehicle treatment group.
CLOF Decreased the mRNA Expression of BA and Cholesterol Transporters in Ileum of WT But Not PPARα-Null Mice
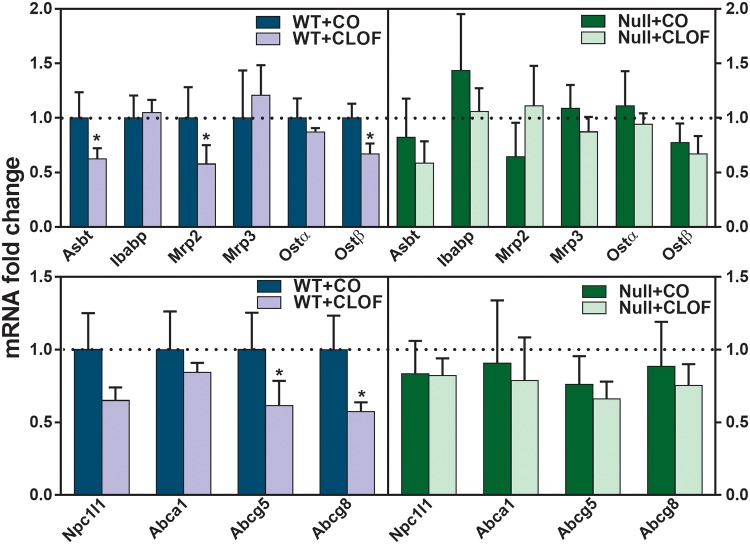
The intestine is the major site for the absorption of BAs and cholesterol. As shown in Figure 6, CLOF markedly decreased apical sodium-dependent bile acid transporter (Asbt) (37%↓), Mrp2 (42%↓), organic solute transporter (Ostβ) (33%↓), Abcg5 (39%↓), and Abcg8 (43%↓) in ilea of WT mice. In contrast, CLOF did not produce alterations in either BA or cholesterol transporters in the ilea of PPARα-null mice. In summary, the current data suggest a regulatory role of PPARα in CLOF-mediated decrease in BA and cholesterol transporters in the ilea of WT mice.
Figure 6.
Effect of CLOF on mRNA of BA and cholesterol transporters in ilea of WT and PPARα-null mice. CO or CLOF (300 mg/kg) was administered daily (i.p.) for 4 consecutive days to male WT and PPARα-null mice (n = 6–8 per treatment group). QuantiGene Plex 2.0 Assay was performed to measure the gene expression of BA transporters (Asbt, Ibabp, Ostα, and Ostβ) and cholesterol transporters (Nieman-Picl c1-like 1 [Npc1l1], Abca1, Abcg5, and Abcg8). Relative mRNA levels were calculated with vehicle-treated WT male mice set as 100%. Data represent means ± SEM *p < .05 versus vehicle treatment group.
CLOF Decreased Genes Involved in the Intestinal Farnesoid X Receptor-Fibroblast Growth Factor15 Signaling in WT But Not PPARα-Null Mice
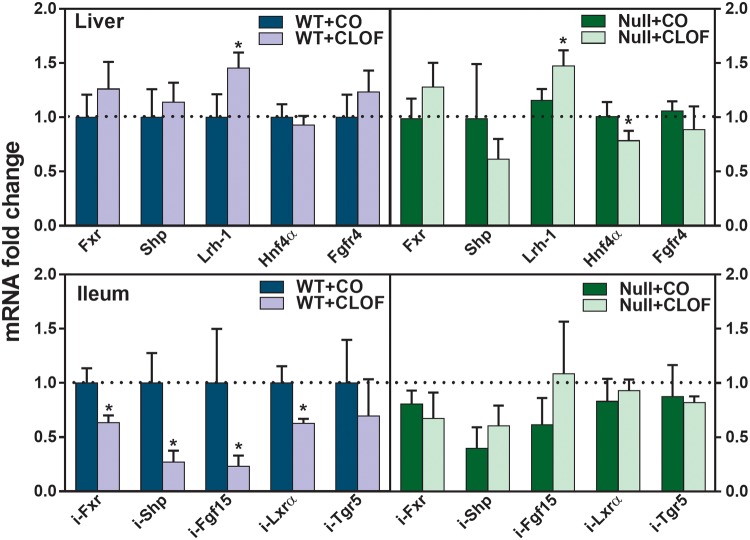
To evaluate the potential mechanism by which CLOF altered BA synthetic enzymes and transporters, the mRNAs of genes known to be involved in BA signaling were quantified, in particular the farnesoid X receptor (Fxr)- small heterodimer partner (Shp) signaling in the liver and the Fxr-fibroblast growth factor (Fgf)15 signaling in the intestine. Lrh-1 and Hnf4α are 2 positive regulators of Cyp7a1 in the liver. CLOF increased Lrh-1 mRNA (50%↑) in livers of both WT and PPARα-null mice (Figure 7). Hnf4α was not altered in CLOF-treated WT mice, whereas it was decreased about 22% in CLOF-treated PPARα-null mice. In the ilea of WT mice, CLOF markedly decreased Fxr (37%↓), Shp (73%↓), Fgf15 (77%↓), and Lxrα (37%↓). In contrast, no statistically significant change was observed in the ilea of CLOF-treated PPARα-null mice, but there was a tendency to increase Fgf15. To summarize, the current data suggest that CLOF has little effect on Fxr-Shp signaling in the liver, whereas it suppresses Fxr-Fgf15 signaling in the ileum in a PPARα-dependent manner.
Figure 7.
Effect of CLOF on mRNA of BA regulators in livers and ilea of WT and PPARα-null mice. CO or CLOF (300 mg/kg) was administered daily (i.p.) for 4 consecutive days to male WT and PPARα-null mice (n = 6–8 per treatment group). QuantiGene Plex 2.0 Assay was performed to measure the gene expression of Fxr, Shp, Lrh-1 and Fgfr4 in the liver and Fxr, Shp, Fgf15, and Tgr5 in the ileum. Relative mRNA levels were calculated with vehicle-treated WT male mice set as 100%. Data represent means ± SEM *p < .05 versus vehicle treatment group.
DISCUSSION
In this study, CLOF was selected because not only it has been widely used as a research tool to activate PPARα in mice, but also it shows a high selectivity to PPARα over other PPAR isoforms. Willson et al. (2000) tested the PPARα agonist activity of 18 chemicals including CLOF, fenofibrate, and bezafibrate. The EC50 value of CLOF is 55 μM for PPARα and about 500 μM for PPARγ. Similarly, fenofibrate has an EC50 value of 30 μM for PPARα and 300 μM for PPARγ. In contrast, bezafibrate has similar EC50 values (50–60 μM) for PPARα and PPARγ. It should be noted that CLOF was discontinued in 2002 due to its various adverse effects. Currently available fibrates, including fenofibrate and gemfibrozil, are weak PPARα agonists with limited efficacy due to their dose-related adverse effects (Fruchart, 2013). Consequently, novel compounds with more potent and selective PPARα agonist activity have been developed in the past decade, namely selective PPARα modulators (SPPARMα). In this regard, it would be more clinically relevant to use fenofibrate or gemfibrozil or SPPARMα to elucidate the role of PPARα in BA homeostasis. Strikingly, there are no human studies with gemfibrozil in cholestasis (Ghonem et al., 2015). Clinical trials on fenofibrate have produced controversial data on its effect in treating cholestasis. Additionally, all of them have demonstrated the potential nephrotoxic effect of fenofibrate.
It is known that activation of PPARα can result in the proliferation of peroxisomes and hepatomegaly in rodents, but not in humans (Mukherjee et al., 1994). The expression of PPARα in rodent livers is about 10 times higher than that in human livers (Palmer et al., 1998). About 20%–50% of the total PPARα has been identified to be truncated (with exon 6 deficient) in human livers, but not in rodent livers (Lambe et al., 1999). Not only the PPARα expression levels and isoforms, there are also species variations in PPARα target genes, which may differ in their response elements. Furthermore, a murine-specific micro-RNA let-7c signaling cascade has been attributed to be the molecular basis for the species variations of PPARα (Shah et al., 2007). Nevertheless, as a model peroxisome proliferator and the first FDA-approved fibrate drug, CLOF is still an important research chemical in terms of its adverse effects or potentially novel applications, such as neonatal hyperbilirubinemia (Chawla, 2017). Therefore, these findings fill the knowledge gap on the effect of CLOF on BA homeostasis, and provide valuable evidences to interpret the potential clinical relevance.
Although altered BA metabolism has been suggested as a mechanism for its hypocholesterolemic effect, a close review of the literature reveals a surprising lack of a comprehensive analysis of the effect of CLOF on BA homeostasis. In this study, CLOF resulted in a >40% decrease in ΣBAs in both the liver and serum of WT mice (Figs. 2 and 4). In contrast, PPARα-null mice demonstrated a divergent response to CLOF on BA concentrations, with ΣBAs in serum being decreased while ΣBAs in liver remained unchanged. This suggests that the regulatory function of PPARα is more prominent on BA concentrations in the liver than the serum, which is not surprising given that so many factors contribute to BA concentrations in the serum. Nevertheless, the current data suggest that CLOF decreases serum BAs in a PPARα-independent manner, whereas it decreases liver BAs through a PPARα-dependent manner.
The conventional explanation for the fibrate-mediated decrease of BA concentrations in the liver is the suppression of BA synthesis, in particular the repression of Cyp7a1, the rate-limiting enzyme of BA synthesis. This is largely based on the findings with long-term feeding of laboratory animals with fibrates. For instance, both 17 days of ciprofibrate and 12 months of bezafibrate reduced Cyp7a1 in mice (Hays et al., 2005; Post et al., 2001). However, 2 studies revealed contradictory results on the effect of 14 days of CLOF in rats, with Cyp7a1 either unaffected or induced in liver (Hayashi et al., 1983; Stahlberg et al., 1989). When compared with these long-term feeding studies, this study provided a more direct effect of CLOF on BA homeostasis and Cyp7a1 by taking advantage of a much shorter treatment. The present data demonstrate that CLOF tended to increase Cyp7a1 about 134% in livers of WT mice (Figure 5). Therefore, the decrease in liver BAs of CLOF-treated WT mice is not due to a decrease in BA synthesis. Notably, Cyp7a1 was not altered by CLOF in PPARα-null mice, indicating that PPARα is involved in increasing the expression of Cyp7a1.
Cyp7a1 expression in liver is known to be regulated by many factors, including nuclear receptors and inflammatory cytokines. Among them, the nuclear receptor Fxr is the major mechanism that regulates Cyp7a1 expression, and thus controls BA synthesis. In liver, activation of Fxr induces the expression of Shp, which in turn inhibits Lrh-1-induced transcription of Cyp7a1 (Goodwin et al., 2000). In intestine, activation of Fxr induces Fgf15 (FGF19 in humans), which binds to the Fgfr4 receptor in liver, leading to suppression of Cyp7a1 (Inagaki et al., 2005). In this study, CLOF had little effect on the Fxr-Shp pathway genes in liver, whereas it markedly decreased mRNAs of Fxr, Shp and Fgf15 in the ilea of WT mice (Figure 7). This decrease was not observed in PPARα-null mice, indicating that PPARα regulates the suppressive effect of CLOF on intestinal Fxr-Fgf15 signaling. This is consistent with a previous finding that PPARα activation decreased intestinal Fxr-Fgf15 signaling, and thus increased Cyp7a1 expression (Zhou et al., 2014). Collectively, the increase of Cyp7a1 in CLOF-treated WT mice is not due to Fxr-Shp signaling in liver, but due to suppression of Fxr-Fgf15 signaling in intestine.
The CLOF-mediated decrease of BAs in liver was associated with an increase in bile flow and biliary excretion of BAs. CLOF increased LW and bile flow in WT mice either if bile flow was calculated per unit BW or LW. Interestingly, CLOF also increased bile flow when normalized per LW in PPARα-null mice, largely a result of reduced LWs. Nevertheless, CLOF did not alter bile flow in PPARα-null mice when bile flow was calculated per BW. Bsep and Mrp2 are 2 transporters that mediate the BA-dependent and BA-independent bile flow, respectively. CLOF induced both Bsep and Mrp2, indicating that CLOF-mediated stimulation of bile flow is both BA-dependent and BA-independent. Consistently, CLOF resulted in a 100% increase in biliary excretion of ΣBAs in WT mice (Figure 3). Biliary BA composition determines cholesterol solubility in the bile and nutrient absorption in the intestine. It is noteworthy that the ratio of CA-derived BAs (12-OHs) to CDCA-derived BAs (non12-OHs) was increased in both WT and PPARα-null mice.
So far, little is known about the regulatory role of PPARα in BA transport. The mRNAs of BA transporters in the liver, namely Ntcp, Oatp1b2, Mrp3, Mrp2, and Bsep, were increased in CLOF-treated WT mice (Figure 5). In contrast, CLOF altered only Oatp1b2 in PPARα-null mice. The increase in BA uptake transporters (Ntcp and Oatp1b2) in CLOF-treated WT mice might represent an adaptive mechanism of the liver to compensate for the reduced BA concentrations in the liver. The inductive effect of PPARα activation on 3 efflux transporters in the liver (Mrp2, Mrp3, and Bsep) is consistent with our previous studies (Aleksunes and Klaassen, 2012; Cui et al., 2009). CLOF also had a PPARα-dependent suppressive effect on 2 major intestinal BA transporters, namely Asbt and Ostβ (Figure 6). This is contradictory to the findings that Wy14643 and ciprofibrate induced ASBT mRNA expression in human intestine-derived Caco2 cells (Jung et al., 2002). Nonetheless, reduced intestinal BA absorption may explain the decrease in serum and liver BAs in CLOF-treated mice. In addition to BA transporters, CLOF also had a PPARα-dependent suppressive effect on intestinal cholesterol transporters, with a statistically significant decrease in Abcg5/8, which are important for intestinal secretion of cholesterol. Further studies are required to investigate the effect of PPARα on protein and function of these transporters.
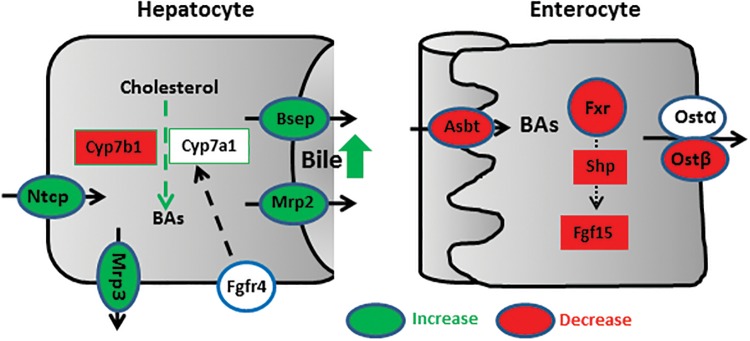
Previous studies on the role of PPARα in fibrate-mediated BA alterations usually involved a long-term feeding of fibrates, which may obscure the initial effect of PPARα activation on BA homeostasis. However, whether PPARα plays a regulatory role in long-term feeding of fibrates remains controversial. Ciprofibrate in the diet for 17 days reduced Cyp7a1 and Cyp27a1, and these effects were completely abolished in PPARα-null mice (Post et al., 2001). In contrast, bezafibrate in the diet for 12 months reduced BA concentrations and Cyp7a1 mRNA in livers of both WT and PPARα-null mice (Hays et al., 2005). Thus, this study provides a systematic evaluation on the role of short-term PPARα activation in regulating BA homeostasis. PPARα-dependent effects of CLOF on BA homeostasis are summarized in Figure 8. In the liver, PPARα activation induces biliary transporters Mrp2 and Bsep, which leads to an increase in bile flow and the biliary excretion of BAs, resulting in a decrease in liver BA concentrations. Additionally, the target genes of PPARα in the liver also include Mrp3 and Cyp7b1, which is consistent with previous studies (Leuenberger et al., 2009). In intestine, PPARα activation may reduce BA absorption by suppressing intestinal BA transporters (Asbt and Ostβ). PPARα activation also suppresses intestinal Fxr-Fgf15 signaling, which in turn induces Cyp7a1 mRNA in the liver. Both reduced intestinal absorption of BAs and increased biliary BA secretion contribute to the decrease in liver BA concentrations, leading to a compensatory induction of liver BA uptake transporters (Ntcp and Oatp1b2).
Figure 8.
Proposed mechanism for PPARα-mediated regulation of BA homeostasis. PPARα activation increases both BA uptake transporter (Ntcp) and BA efflux transporter (Mrp3, Mrp2, and Bsep) in the liver. In contrast, PPARα activation decreases BA synthetic enzyme Cyp7a1 in the liver as well as BA transporters (Asbt and Ostβ) in the ileum. Furthermore, PPARα activation suppresses intestinal Fxr-Shp-Fgf15 pathway.
In conclusion, this study provides a comprehensive analysis on the effect of short-term CLOF treatment on BA homeostasis in male mice. PPARα-dependent effects of CLOF include a decrease in liver BAs as well as an increase in bile flow and biliary excretion of BAs. PPARα regulates BA homeostasis through regulating gene expression in both liver and intestine. The findings in this study are critical not only in filling the knowledge gaps in our understanding for the therapeutic effects of fibrates in treating metabolic disorders, but also in elucidating the role of BAs in PPARα-mediated pharmacological and toxicological effects.
FUNDING
National Institutes of Health (R01 ES025708, R01 ES009649, and F32 DK092069).
ACKNOWLEDGMENTS
The authors would like to thank all members of the Klaassen laboratory for technical assistance with blood and tissue collection.
REFERENCES
- Aleksunes L. M., Klaassen C. D. (2012). Coordinated regulation of hepatic phase I and II drug-metabolizing genes and transporters using AhR-, CAR-, PXR-, PPARalpha-, and Nrf2-null mice. Drug Metab. Dispos. 40, 1366–1379. [DOI] [PMC free article] [PubMed] [Google Scholar]
- Chawla D. (2017). Clofibrate in Neonatal Hyperbilirubinemia. Indian J. Pediatr. [Epub ahead of print] doi: 10.1007/s12098-017-2438-6. [DOI] [PubMed] [Google Scholar]
- Cheema S. K., Agellon L. B. (2000). The murine and human cholesterol 7alpha-hydroxylase gene promoters are differentially responsive to regulation by fatty acids mediated via peroxisome proliferator-activated receptor alpha. J. Biol. Chem. 275, 12530–12536. [DOI] [PubMed] [Google Scholar]
- Cui Y. J., Cheng X., Weaver Y. M., Klaassen C. D. (2009). Tissue distribution, gender-divergent expression, ontogeny, and chemical induction of multidrug resistance transporter genes (Mdr1a, Mdr1b, Mdr2) in mice. Drug Metab. Dispos. 37, 203–210. [DOI] [PMC free article] [PubMed] [Google Scholar]
- Day A. P., Feher M. D., Chopra R., Mayne P. D. (1993). The effect of bezafibrate treatment on serum alkaline phosphatase isoenzyme activities. Metabolism 42, 839–842. [DOI] [PubMed] [Google Scholar]
- Dreyer C., Keller H., Mahfoudi A., Laudet V., Krey G., Wahli W. (1993). Positive regulation of the peroxisomal beta-oxidation pathway by fatty acids through activation of peroxisome proliferator-activated receptors (PPAR). Biol. Cell 77, 67–76. [DOI] [PubMed] [Google Scholar]
- Fruchart J. C. (2013). Selective peroxisome proliferator-activated receptor alpha modulators (SPPARMalpha): The next generation of peroxisome proliferator-activated receptor alpha-agonists. Cardiovasc. Diabetol. 12, 82.. [DOI] [PMC free article] [PubMed] [Google Scholar]
- Ghonem N. S., Assis D. N., Boyer J. L. (2015). Fibrates and cholestasis. Hepatology 62, 635–643. [DOI] [PMC free article] [PubMed] [Google Scholar]
- Gonzalez F. J., Peters J. M., Cattley R. C. (1998). Mechanism of action of the nongenotoxic peroxisome proliferators: Role of the peroxisome proliferator-activator receptor alpha. J. Natl. Cancer Inst. 90, 1702–1709. [DOI] [PubMed] [Google Scholar]
- Goodwin B., Jones S. A., Price R. R., Watson M. A., McKee D. D., Moore L. B., Galardi C., Wilson J. G., Lewis M. C., Roth M. E., et al. (2000). A regulatory cascade of the nuclear receptors FXR, SHP-1, and LRH-1 represses bile acid biosynthesis. Molecular Cell 6, 517–526. [DOI] [PubMed] [Google Scholar]
- Hayashi H., Fukuyama K., Yamasaki F. (1983). Stimulation of bile acid biosynthesis by clofibrate. Chem. Pharm. Bull. 31, 653–658. [DOI] [PubMed] [Google Scholar]
- Hays T., Rusyn I., Burns A. M., Kennett M. J., Ward J. M., Gonzalez F. J., Peters J. M. (2005). Role of peroxisome proliferator-activated receptor-alpha (PPARalpha) in bezafibrate-induced hepatocarcinogenesis and cholestasis. Carcinogenesis 26, 219–227. [DOI] [PubMed] [Google Scholar]
- Heuman D. M. (1989). Quantitative estimation of the hydrophilic-hydrophobic balance of mixed bile salt solutions. J. Lipid Res. 30, 719–730. [PubMed] [Google Scholar]
- Hofmann A. F. (2009a). Bile acids: Trying to understand their chemistry and biology with the hope of helping patients. Hepatology 49, 1403–1418. [DOI] [PubMed] [Google Scholar]
- Hofmann A. F. (2009b). The enterohepatic circulation of bile acids in mammals: Form and functions. Front. Biosci. 14, 2584–2598. [DOI] [PubMed] [Google Scholar]
- Honda A., Ikegami T., Nakamuta M., Miyazaki T., Iwamoto J., Hirayama T., Saito Y., Takikawa H., Imawari M., Matsuzaki Y. (2013). Anticholestatic effects of bezafibrate in patients with primary biliary cirrhosis treated with ursodeoxycholic acid. Hepatology 57, 1931–1941. [DOI] [PubMed] [Google Scholar]
- Hunt M. C., Yang Y. Z., Eggertsen G., Carneheim C. M., Gafvels M., Einarsson C., Alexson S. E. (2000). The peroxisome proliferator-activated receptor alpha (PPARalpha) regulates bile acid biosynthesis. J. Biol. Chem. 275, 28947–28953. [DOI] [PubMed] [Google Scholar]
- Inagaki T., Choi M., Moschetta A., Peng L., Cummins C. L., McDonald J. G., Luo G., Jones S. A., Goodwin B., Richardson J. A., et al. (2005). Fibroblast growth factor 15 functions as an enterohepatic signal to regulate bile acid homeostasis. Cell Metab. 2, 217–225. [DOI] [PubMed] [Google Scholar]
- Jung D., Fried M., Kullak-Ublick G. A. (2002). Human apical sodium-dependent bile salt transporter gene (SLC10A2) is regulated by the peroxisome proliferator-activated receptor alpha. J. Biol. Chem. 277, 30559–30566. [DOI] [PubMed] [Google Scholar]
- Lambe K. G., Woodyatt N. J., Macdonald N., Chevalier S., Roberts R. A. (1999). Species differences in sequence and activity of the peroxisome proliferator response element (PPRE) within the acyl CoA oxidase gene promoter. Toxicol. Lett. 110, 119–127. [DOI] [PubMed] [Google Scholar]
- Lee S. S., Pineau T., Drago J., Lee E. J., Owens J. W., Kroetz D. L., Fernandez-Salguero P. M., Westphal H., Gonzalez F. J. (1995). Targeted disruption of the alpha isoform of the peroxisome proliferator-activated receptor gene in mice results in abolishment of the pleiotropic effects of peroxisome proliferators. Mol. Cell. Biol. 15, 3012–3022. [DOI] [PMC free article] [PubMed] [Google Scholar]
- Leuenberger N., Pradervand S., Wahli W. (2009). Sumoylated PPARalpha mediates sex-specific gene repression and protects the liver from estrogen-induced toxicity in mice. J. Clin. Invest. 119, 3138–3148. [DOI] [PMC free article] [PubMed] [Google Scholar]
- Marrapodi M., Chiang J. Y. (2000). Peroxisome proliferator-activated receptor alpha (PPARalpha) and agonist inhibit cholesterol 7alpha-hydroxylase gene (CYP7A1) transcription. J. Lipid Res. 41, 514–520. [PubMed] [Google Scholar]
- Mukherjee R., Jow L., Noonan D., McDonnell D. P. (1994). Human and rat peroxisome proliferator activated receptors (PPARs) demonstrate similar tissue distribution but different responsiveness to PPAR activators. J. Steroid Biochem. Mol. Biol. 51, 157–166. [DOI] [PubMed] [Google Scholar]
- Palmer C. N., Hsu M. H., Griffin K. J., Raucy J. L., Johnson E. F. (1998). Peroxisome proliferator activated receptor-alpha expression in human liver. Mol. Pharmacol. 53, 14–22. [PubMed] [Google Scholar]
- Patel D. D., Knight B. L., Soutar A. K., Gibbons G. F., Wade D. P. (2000). The effect of peroxisome-proliferator-activated receptor-alpha on the activity of the cholesterol 7 alpha-hydroxylase gene. Biochem. J. 351(Pt 3), 747–753. [PMC free article] [PubMed] [Google Scholar]
- Petrick J. S., Klaassen C. D. (2007). Importance of hepatic induction of constitutive androstane receptor and other transcription factors that regulate xenobiotic metabolism and transport. Drug Metabo. Dispos. 35, 1806–1815. [DOI] [PubMed] [Google Scholar]
- Post S. M., Duez H., Gervois P. P., Staels B., Kuipers F., Princen H. M. (2001). Fibrates suppress bile acid synthesis via peroxisome proliferator-activated receptor-alpha-mediated downregulation of cholesterol 7alpha-hydroxylase and sterol 27-hydroxylase expression. Arterioscler. Thromb. Vasc. Biol. 21, 1840–1845. [DOI] [PubMed] [Google Scholar]
- Rakhshandehroo M., Knoch B., Muller M., Kersten S. (2010). Peroxisome proliferator-activated receptor alpha target genes. PPAR Res. 2010, 1–20. [DOI] [PMC free article] [PubMed] [Google Scholar]
- Schoonjans K., Peinado-Onsurbe J., Lefebvre A. M., Heyman R. A., Briggs M., Deeb S., Staels B., Auwerx J. (1996). PPARalpha and PPARgamma activators direct a distinct tissue-specific transcriptional response via a PPRE in the lipoprotein lipase gene. EMBO J. 15, 5336–5348. [PMC free article] [PubMed] [Google Scholar]
- Shah Y. M., Morimura K., Yang Q., Tanabe T., Takagi M., Gonzalez F. J. (2007). Peroxisome proliferator-activated receptor alpha regulates a microRNA-mediated signaling cascade responsible for hepatocellular proliferation. Mol. Cell. Biol. 27, 4238–4247. [DOI] [PMC free article] [PubMed] [Google Scholar]
- Stahlberg D., Angelin B., Einarsson K. (1989). Effects of treatment with clofibrate, bezafibrate, and ciprofibrate on the metabolism of cholesterol in rat liver microsomes. J. Lipid Res. 30, 953–958. [PubMed] [Google Scholar]
- Willson T. M., Brown P. J., Sternbach D. D., Henke B. R. (2000). The PPARs: From orphan receptors to drug discovery. J. Med. Chem. 43, 527–550. [DOI] [PubMed] [Google Scholar]
- Zhang Y., Cheng X., Aleksunes L., Klaassen C. D. (2012). Transcription factor-mediated regulation of carboxylesterase enzymes in livers of mice. Drug Metab. Dispos. 40, 1191–1197. [DOI] [PMC free article] [PubMed] [Google Scholar]
- Zhang Y., Klaassen C. D. (2010). Effects of feeding bile acids and a bile acid sequestrant on hepatic bile acid composition in mice. J. Lipid Res. 51, 13.. [DOI] [PMC free article] [PubMed] [Google Scholar]
- Zhou X., Cao L., Jiang C., Xie Y., Cheng X., Krausz K. W., Qi Y., Sun L., Shah Y. M., Gonzalez F. J., et al. (2014). PPARalpha-UGT axis activation represses intestinal FXR-FGF15 feedback signalling and exacerbates experimental colitis. Nat. Commun. 5, 4573.. [DOI] [PMC free article] [PubMed] [Google Scholar]


