

See Coulthard and Knight (doi:10.1093/aww335) for a scientific commentary on this article.
Individuals with clinical diagnoses of mild cognitive impairment and Alzheimer’s disease display phenotypic heterogeneity. Using a state-of-the-art neuroanatomical dimensional clustering approach, Dong and Toledo et al. identify four different subgroups of patients. These delineated groups are associated with distinct cognitive profiles, CSF biomarkers, and patterns of atrophy and progression.
Keywords: neuroanatomical heterogeneity, pattern analysis, magnetic resonance imaging, mild cognitive impairment, dementia
Abstract
See Coulthard and Knight (doi:10.1093/aww335) for a scientific commentary on this article.
Individuals with mild cognitive impairment and Alzheimer’s disease clinical diagnoses can display significant phenotypic heterogeneity. This variability likely reflects underlying genetic, environmental and neuropathological differences. Characterizing this heterogeneity is important for precision diagnostics, personalized predictions, and recruitment of relatively homogeneous sets of patients into clinical trials. In this study, we apply state-of-the-art semi-supervised machine learning methods to the Alzheimer’s disease Neuroimaging cohort (ADNI) to elucidate the heterogeneity of neuroanatomical differences between subjects with mild cognitive impairment (n = 530) and Alzheimer’s disease (n = 314) and cognitively normal individuals (n = 399), thereby adding to an increasing literature aiming to establish neuroanatomical and neuropathological (e.g. amyloid and tau deposition) dimensions in Alzheimer’s disease and its prodromal stages. These dimensional approaches aim to provide surrogate measures of heterogeneous underlying pathologic processes leading to cognitive impairment. We relate these neuroimaging patterns to cerebrospinal fluid biomarkers, white matter hyperintensities, cognitive and clinical measures, and longitudinal trajectories. We identified four such atrophy patterns: (i) individuals with largely normal neuroanatomical profiles, who also turned out to have the least abnormal cognitive and cerebrospinal fluid biomarker profiles and the slowest clinical progression during follow-up; (ii) individuals with classical Alzheimer’s disease neuroanatomical, cognitive, cerebrospinal fluid biomarkers and clinical profile, who presented the fastest clinical progression; (iii) individuals with a diffuse pattern of atrophy with relatively less pronounced involvement of the medial temporal lobe, abnormal cerebrospinal fluid amyloid-β1-42 values, and proportionally greater executive impairment; and (iv) individuals with notably focal involvement of the medial temporal lobe and a slow steady progression, likely representing in early Alzheimer’s disease stages. These four atrophy patterns effectively define a 4-dimensional categorization of neuroanatomical alterations in mild cognitive impairment and Alzheimer’s disease that can complement existing dimensional approaches for staging Alzheimer’s disease using a variety of biomarkers, which offer the potential for enabling precision diagnostics and prognostics, as well as targeted patient recruitment of relatively homogeneous subgroups of subjects for clinical trials.
Introduction
Dementia is a prevalent disorder leading to substantial healthcare, financial, and caregiver burden (Hurd et al., 2013). Although Alzheimer’s disease is the most common cause of dementia, several coincident pathologies, mainly vascular lesions, limbic TAR-DNA binding protein-43 (TDP-43, encoded by TARDBP) and Lewy body-related pathology, also account for the cognitive symptoms of dementia subjects (Zanetti et al., 2006; Schneider et al., 2007; Toledo et al., 2013a, b, 2016; Wilson et al., 2013). The presence of different brain pathological lesions and the variations in cognitive reserve, genetic background, and environmental exposures, can lead to differential vulnerability. This, in turn, can lead to large variations in the clinical presentation and course of the subjects. Therefore, it can be expected that a group of cognitively impaired subjects is composed of different subtypes. Each subtype would present a specific disease course and characteristics.
Traditional imaging approaches [e.g. voxel-based morphometry (VBM) or multi-voxel pattern analysis (MVPA)] ignore phenotypic heterogeneity and define patterns of structural or functional changes based on a priori diagnosis or grouping but not the inherent heterogeneity presented in the populations (Karas et al., 2004; Busatto et al., 2008; Klöppel et al., 2008; Misra et al., 2009).
Previous studies have used a priori-defined neuropathological categories to identify subgroups of subjects (Shiino et al., 2006; Murray et al., 2011; Lam et al., 2013; Jack et al., 2015). In these approaches, subtypes of pathologies are defined based on clinical diagnosis or neuropathological findings, which unfortunately makes it not reliable enough for accurately distinguishing them (McKeith et al., 1994; Larner, 2004) and relies on a clinical ‘intuition’, as opposed to unbiased data-driven approaches, that would be able to identify different patterns of pathology distribution based on the atrophy patterns inherent to the population (Nettiksimmons et al., 2014; Noh et al., 2014; Toledo et al., 2016). However, these studies adopted standard clustering methods that tend to group patients along the direction associated with the largest data variability, which may not be induced by the pathology, and which might reflect effects such as age, gender or disease stage. A more specific characterization of anatomical heterogeneity of neurodegeneration patterns of processes driving cognitive impairment is likely to lead to grouping of subjects into relatively homogeneous groups with potentially more predictable clinical outcomes and treatment responses.
In this study, we investigate heterogeneity of neurodegeneration in mild cognitive impairment (MCI) and Alzheimer’s disease relative to cognitively normal individuals, by leveraging a newly developed method for semi-supervised pattern analysis and machine learning (Dong et al., 2016). This new approach aims to complement and contribute to recently proposed dimensional approaches, such as the A/T/N Alzheimer’s disease staging system (Jack et al., 2016), by evaluating and categorizing heterogeneity of disease-related neurodegeneration patterns (the ‘N’ component in an A/T/N system) in a data-driven way that leverages the power of modern pattern analysis methods. Our approach applies a sophisticated methodology that finds heterogeneity in a probabilistic mapping from cognitively normal individuals to MCI and Alzheimer’s disease dementia patients, while also accounting for relevant covariates, such as age, gender, and study recruitment (ADNI 1 versus GO/2) in a non-linear way. We found four distinct neuroanatomical subtypes in MCI and Alzheimer’s disease dementia relative to cognitively normal subjects, which were replicable and consistent across ADNI-1 and ADNI-GO/2 cohorts. Subtypes in this context are mainly meant to define the main dimensions of this heterogeneity, rather than imply distinct imaging phenotypes. We describe in detail the CSF biomarkers, cognitive characteristics and white matter hyperintensity (WMH) volumes of these subtypes.
Materials and methods
Subjects
A total number of 1243 Alzheimer’s Disease Neuroimaging Initiative (ADNI) participants were included in the study, including 760 ADNI-1 subjects (213 cognitively normal, 370 late MCI, and 177 Alzheimer’s disease subjects) and 483 ADNI-GO/2 subjects (186 cognitively normal, 160 late MCI, and 137 Alzheimer’s disease). Early MCI subjects from the ADNI-GO/2 were excluded because this group was only recruited in ADNI-GO/2. Cognitively normal subjects included subjects with normal cognition, independently of the presence of memory complaints. Diagnoses of MCI and Alzheimer’s disease were established as described (Petersen et al., 1999, 2010; McKhann et al., 2011). The data for this study were downloaded in December 2015. The ADNI datasets have been extensively reviewed in Weiner et al. (2015) (http://www.adni-info.org and Supplementary material). To evaluate differences in cognitive measures, previously developed memory composite score (Crane et al., 2012), executive composite score (Gibbons et al., 2012), and Boston naming test scores were studied. Median follow-up length for ADNI-1 and ADNI-GO/2 MCI subjects was 161.0 (first quartile: 105.4–third quartile: 315.0) and 156.3 (first quartile: 106.5–third quartile: 159.1) weeks, respectively.
Cerebrospinal fluid collection and measurement
CSF samples were processed as previously described (Shaw et al., 2009, 2011) (http://www.adni-info.org/ and Supplementary material). Amyloid-β1-42 and total tau (t-tau) were measured using the multiplex xMAP Luminex platform with Innogenetics (INNO-BIA AlzBio3) immunoassay kit-based reagents.
MRI acquisition and processing
Acquisition of 1.5 T MRI (for ADNI-1) and 3.0 T MRI (for ADNI-GO/2) data at each study site followed a previously described standardized protocol that included volumetric 3D MP-RAGE/sagittal MP-RAGE with variable resolution around the target of 1.2 mm isotropically. The scans went through the following correction methods: gradwarp, B1 calibration, N3 correction, and (in-house) skull-stripping (Doshi et al., 2013). See www.loni.ucla.edu/ADNI and Jack et al. (2008) for details.
T1 structural MRI images of all subjects were segmented into 80 anatomical regions of interest. The region of interest labels were obtained using multi-atlas segmentation with label fusion of outputs from multiple registration methods (Doshi et al., 2015). For visualizing disease patterns, tissue density maps, referred as RAVENS (regional analysis of volumes examined in normalized space) (Davatzikos et al., 2001), were computed and exploited as follows. An established deformable registration method (Ou et al., 2011), was used for warping individual images to a single subject brain template. The brain scans were segmented into three tissue types: grey matter, white matter and CSF (Li et al., 2014). RAVENS maps encode, locally and separately for each tissue type, the volumetric changes observed during the registration. The comparison of the RAVENS maps obtained for the different groups revealed the local volumetric differences between them. We used the cognitively normal group data for linearly regressing age and gender from the RAVENS maps of the entire dataset. To assess longitudinal neuroimaging changes, region of interest volumes were processed using Free-surfer software package version 4.4 framework (Reuter et al., 2010, 2012) (http://surfer.nmr.mgh.harvard.edu/). Adjusted hippocampal volume was calculated and matched across ADNI-1 and ADNI-GO/2 cohorts using a set of matched MRIs as previously described (Toledo et al., 2014). Subjects were divided into four quartiles.
White matter hyperintensities
WMHs were segmented using different approaches in ADNI-1 (Schwarz et al., 2009) and ADNI-GO/2 (DeCarli et al., 2005). The method used in ADNI-1 uses proton density (PD), T1, and T2 magnetic resonance images. A Bayesian Markov random field approach was adopted, where the joint posterior probability of the presence of WMH at each voxel is maximized. The posterior probability consists of likelihood computed from image intensities, spatial prior that regularizes the location of WMHs, and contextual prior that encourages neighbour voxels to have the same labels. The method used in ADNI-GO/2 uses fluid-attenuated inversion recovery (FLAIR) and T1 images. This method first co-registers the FLAIR magnetic resonance image to the T1 image and performs inhomogeneity correction. The binary WMH mask is then estimated based on histogram fitting and thresholding at 3.5 standard deviations above the mean signal in brain matter distribution. The spatial prior and tissue class constraints are incorporated with the WMH mask in a Bayesian approach for the final segmentation.
Heterogeneity and voxel-based morphometry analysis
We used a newly developed probabilistic mapping methodology, named CHIMERA (Dong et al., 2016), to quantify neuroanatomical heterogeneity between MCI/Alzheimer’s disease and cognitively normal individuals. The CHIMERA software implementation is available on request and will be available online through https://www.cbica.upenn.edu/sbia/software. Additional preprocessing software (registration and region of interest definition) are also available on the same web page. A web-accessible pipeline will be soon available to be run remotely via our image processing web portal: https://ipp.cbica.upenn.edu/. CHIMERA considers two groups of subjects: a group assumed to be affected by a pathology (MCI and Alzheimer’s disease, herein) and a normal control group. By performing a probability distribution mapping, it then seeks patterns of difference between these two groups, constrained non-linearly by a number of covariates (e.g. age, gender, and study cohort), thereby effectively estimating heterogeneity of the underlying pathologic process. More specifically, heterogeneous brain atrophy patterns in the pathologic group are described by multiple transformations from the cognitively normal distribution. Those transformations are found by matching the transformed normal control and the patient distributions, constrained by the covariates, which effectively enforce the fact that, for example, a 70-year-old female patient would have been a 70-year-old female control, should she had been spared of this pathological process (which is being estimated). To obtain stable and reproducible results, CHIMERA was run 10 000 times with random initialization to determine reproducible patterns. The methodological details and nuances of this approach can be found in the Supplementary material and Dong et al. (2016).
In this study, ADNI-1 and ADNI-GO/2 datasets were combined to delineate more consistent pathological imaging patterns. However, the structural MRI scans from these two cohorts have many discrepancies, such as different scan protocols and magnetic field strengths. We took these discrepancies into account during our analyses by introducing the original recruitment cohort (ADNI-1 versus ADNI-GO/2) as the third covariate in our model, in addition to age and gender. As a result, patient and normal control distributions were matched within each cohort separately, but the pathological effects captured by CHIMERA were shared across datasets. We performed a 10-fold cross-validation using the combined dataset to evaluate the robustness of the method, which showed an 84.1% agreement (Supplementary material). In addition, we applied our clustering approach separately in the ADNI-1 and ADNI-GO/2 cohorts, which showed a 63% and 74% overall agreement with the combined approach, respectively.
Statistical analysis
The demographic variables, APOE genotype, CSF biomarker levels, cognitive test scores and WMH volumes were compared across clusters. For categorical variables, Fisher’s exact test was used to identify differences between groups. In case of significant differences, pairwise comparisons with Bonferroni adjustment were performed. For quantitative demographic variables (age), an ANOVA analysis was conducted, followed by a Dunn test. For the clinical and CSF biomarker measures, an ANCOVA analysis was performed, which included age, gender, years of education and APOE genotype as covariates. In case of significant differences, Dunn’s post hoc test was performed. When the ANCOVA requirements were not met, a Box-Cox transformation was applied to the data. A longitudinal neuropsychological analysis was conducted for late MCI patients (Alzheimer’s disease subjects were excluded due to short follow-up) using mixed effect models that included subjects and time as random effects and age, gender, time, APOE ɛ4 presence and years of education as fixed effects. A Cox hazards model including age, gender, APOE ɛ4 presence and years of education as covariates, was fitted for comparing the conversion of late MCI patient to Alzheimer’s disease in the different clusters. For the evaluation of the profile of longitudinal changes in MRI volumes, individual mixed effects models that included age, gender, time and APOE as covariates, were applied to estimate the yearly volumetric changes in cognitively normal subjects and each of the clusters. Baseline and second-year MRI scans were compared for this purpose and region of interest values were standardized to compare findings across the different areas. Analyses were performed using R v. 3.2.2 (R Core Team, 2016). The visualization of imaging signatures of each cluster, clinically and adjusted hippocampal volume-defined groups was performed via VBM (Cox, 1996; Ashburner and Friston, 2000) on RAVENS maps.
Results
Cluster demographic and genetic characteristics
CHIMERA partitioned the entire set of ADNI patients into four clusters that included in each case subjects from ADNI-1 and ADNI-GO/2. Subjects in different ADNI cohorts but within the same cluster exhibited similar atrophy patterns. The characteristics of clusters identified in ADNI-1 and ADNI-GO/2 cohorts are summarized in Table 1. In all ADNI cohorts, cluster 2 subjects were older and had a greater proportion of Alzheimer’s disease dementia subjects compared to cluster 1.
Table 1.
Cluster demographics and characteristics of CSF biomarkers and cognitive scores
| Cluster 1 | Cluster 2 | Cluster 3 | Cluster 4 | P-value | C1 versus C2 | C1 versus C3 | C1 versus C4 | |
|---|---|---|---|---|---|---|---|---|
| Demographics | ||||||||
| ADNI-1 | ||||||||
| n (%) | 166 (30.35%) | 213 (38.94%) | 65 (11.88%) | 103 (18.83%) | ||||
| Alzheimer’s disease (%) | 34 (20.48%) | 99 (46.48%) | 19 (29.23%) | 25 (24.27%) | <0.001 | <0.0001 | 0.21 | 0.56 |
| Late MCI (%) | 132 (79.52%) | 114 (53.52%) | 46 (70.77%) | 78 (75.73%) | ||||
| Age (mediana) | 75.25 (69.6–79.95) | 77.3 (72–81.7) | 71.6 (68–76.4) | 72.7 (68.55–79.9) | <0.0001 | 0.021 | 0.006 | 0.51 |
| Gender (female %) | 33.13 | 39.91 | 46.15 | 45.63 | 0.13 | |||
| APOE (% ɛ4 presence) | 52.41 | 63.85 | 55.38 | 58.25 | 0.15 | |||
| ADNI-GO/2 | ||||||||
| n (%) | 38 (12.79%) | 131 (44.11%) | 84 (28.28%) | 44 (14.81%) | ||||
| Alzheimer’s disease (%) | 9 (23.68%) | 73 (55.73%) | 38 (45.24%) | 17 (38.64%) | 0.004 | <0.001 | 0.039 | 0.23 |
| Late MCI (%) | 29 (76.32%) | 58 (44.27%) | 46 (54.76%) | 27 (61.36%) | ||||
| Age (mediana) | 69.9 (62–74.6) | 75.9 (72.15–79.9) | 71.45 (64.33–77.23) | 72.85 (66.28–76.43) | <0.0001 | <0.0001 | 0.31 | 0.30 |
| Gender (female %) | 42.11 | 37.4 | 61.9 | 36.36 | 0.003 | 0.74 | 0.07 | 0.76 |
| APOE (% ɛ4 presence) | 57.89 | 62.6 | 60.71 | 68.18 | 0.79 | |||
| CSF biomarkers and cognitive scores | ||||||||
| Cluster 1 | Cluster 2 | Cluster 3 | Cluster 4 | Global comparisonc | C1 versus C2 | C1 versus C3 | C1 versus C4 | |
| Median (first quartile–third quartile) | P-value | |||||||
| ADNI-1 | ||||||||
| Amyloidβ1-42b (% ≤192 pg/ml) | 63.3 | 89.5 | 96.8 | 75.9 | <0.0001 | 0.0001 | 0.0007 | 0.40 |
| T-tau | 90.5 (65.5–125.2) | 96 (67.75–135) | 109 (86–150) | 107.5 (69.75–141.8) | 0.64 | |||
| P-tau | 31 (20.5–45) | 35 (24–46.75) | 38 (29–47.5) | 40 (25–50.5) | <0.0001 | <0.0001 | 0.063 | 0.8 |
| ADAS-Cog13 | 18.67 (14.33–22.33) | 24.33 (18.67–29.67) | 21 (16.17–28.41) | 19.67 (16.16–24.67) | <0.0001 | <0.0001 | 0.0025 | 0.91 |
| Memory | −0.11 (−0.53–0.25) | −0.59 (−0.92–−0.11) | −0.44 (−0.88–0.04) | −0.22 (0.55–0.1) | <0.0001 | <0.0001 | 0.028 | 0.34 |
| Executive | −0.21 (−0.75–0.49) | −0.51 (1.09–0.04) | −0.25 (1.2–0.17) | 0.03 (0.47–0.47) | 0.0022 | 0.0097 | 0.52 | 0.66 |
| Boston naming test | 25 (22–28) | 24 (21–27) | 27 (23–28) | 26 (22–28) | 0.015 | 0.29 | 0.95 | 0.20 |
| WMH | 0.25 (0.11–0.71) | 0.45 (0.17–1.21) | 0.15 (0.06–0.42) | 0.32 (0.11–0.69) | 0.0022 | 0.0097 | 0.52 | 0.66 |
| ADNI-GO/2 | ||||||||
| Amyloid-β1-42b (% ≤192 pg/ml) | 68.6 | 89.3 | 83.8 | 71.4 | 0.007 | 0.018 | 0.25 | 1.0 |
| T-tau | 76 (46–109) | 108.5 (82–146.5) | 105 (67–172) | 86.5 (54.25–160.2) | 0.0079 | 0.0031 | 0.029 | 0.35 |
| P-tau | 37 (32–56.5) | 48 (37–63.25) | 46 (33–67) | 40.5 (23.5–69.5) | <0.0001 | <0.0001 | 0.016 | 0.28 |
| ADAS-Cog13 | 17 (12–24) | 27 (22–33.5) | 21 (17–27.75) | 20 (15–29) | 0.0013 | <0.0001 | 0.016 | 0.19 |
| Memory | 0.06 (−0.41–0.59) | −0.47 (−0.74–−0.06) | −0.15 (−0.55–0.21) | −0.22 (−0.61–0.14) | 0.0053 | 0.011 | 0.0051 | 0.54 |
| Executive | −0.03 (−0.32–0.87) | −0.48 (−1.13–0.15) | −0.36 (−1.24–0.3) | −0.01 (−0.68–0.68) | 0.017 | 0.029 | 0.89 | 0.84 |
| Boston naming test | 27 (24–28) | 23 (20–26) | 25 (22–27) | 26 (23–28) | 0.041 | 0.028 | 0.12 | 0.80 |
| WMH | 2.31 (1.28–5.36) | 6.73 (3.22–14.13) | 3.04 (1.66–6.9) | 3.9 (2.11–5.69) | 0.017 | 0.029 | 0.89 | 0.84 |
a Parenthesis include first and third quartile values.
b Due to incomplete data, the percentages of subjects with CSF biomarkers collected are 50.8% in ADNI-1 and 94.3% in ADNI-GO/2.
c CSF amyloid-β groups, differences were tested using a Fisher’s exact test, all other comparisons were performed using an ANCOVA test.
ADAS-cog = Alzheimer’s Disease Assessment Scale-Cognitive Subscale; P-tau = phosphorylated tau; T-tau = total tau.
Cluster membership confidence
In our main analysis, we assigned each subject to the cluster with the highest probability. For most of the subjects, cluster membership was assigned with a probability ≥0.5. However, in the remaining cases membership was assigned with a probability <0.5. The ‘tightest’ cluster was cluster 2 (87% subjects had a probability ≥0.5), whereas cluster 3 was the loosest one (66% subjects had a probability ≥0.5) (Supplementary Fig. 2), with most of the loose cases being close to cluster 1. We summarize these findings using a Venn diagram in Fig. 1.
Figure 1.
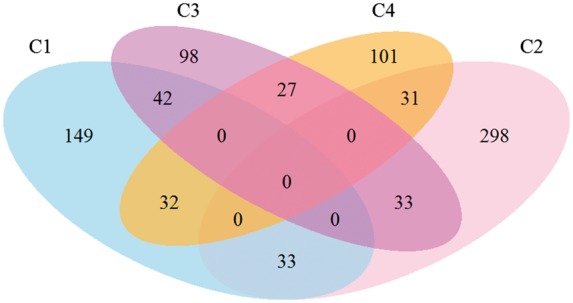
Venn diagram depicting number of subjects classified tightly or loosely into clusters. Subjects with a probability >0.5 were included within a single cluster, whereas subjects with a highest cluster probability <0.5 are depicted in the interphase of the two top clusters.
Cross-sectional clinical and biomarker associations
CSF amyloid-β1-42-defined groups, WMH volume and the studied cognitive measures differed between the four clusters (Table 1). Post hoc group comparisons identified similar results across cohorts. Subjects in clusters 2 and 3 included a higher frequency of subjects with pathological CSF amyloid-β1-42 values. Cluster 2 and 3 subjects presented worse performance in the memory composite and in ADAS-Cog compared to cluster 1. In addition, cluster 2 subjects had worse executive composite, higher phosphorylated-tau values and greater WMH volume compared to cluster 1 subjects. Only in ADNI-GO/2 did the clusters differ in terms of CSF t-tau values (cluster 1 had lower values than cluster 2 and 3).
Group-wise voxel-based morphometry results
The group-wise VBM results were presented in Fig. 2. Cluster 1 showed the least amount and extent of atrophy: in the ADNI-1 cohort atrophy was mainly localized in the temporal lobe with additional involvement of the posterior cingulate cortex, and in ADNI-GO/2 it was statistically indistinguishable from cognitively normal. Interestingly, cluster 4 showed moderate localized atrophy in the hippocampus and the anterior-medial temporal cortex, without any significant involvement beyond these regions. Conversely, clusters 2 and 3 showed widespread involvement, extending to the temporal, parietal, and occipital lobes in addition to subcortical grey matter. However, they presented markedly different patterns, as cluster 2 presented relatively most severe temporal atrophy, whereas cluster 3 exhibited a more diffuse atrophy pattern, with comparatively less dominant involvement of the temporal lobe compared to cluster 2. Group comparisons based on baseline diagnosis and adjusted hippocampal volume quartiles are presented in Supplementary Figs 3 and 4, respectively.
Figure 2.

VBM between the identified clusters and the cognitively normal reference group for the ADNI-1 (A) and ADNI-GO/2 cohorts (B). Colour scale represents the effect size of grey matter RAVENS maps of each comparison between a cluster and cognitively normal individuals. Red indicates greater atrophy (lower volume). Effect size maps are thresholded at false discovery rate (FDR) adjusted P-value of 0.05.
Longitudinal changes
Clusters 2 and 3 showed a faster progression from MCI to Alzheimer’s disease, and a steeper cognitive decline in the studied cognitive measures compared to cluster 1 (Table 2 and Figs 3 and 4). Similarly, clusters 2 and 3 showed a more pronounced longitudinal cognitive decline than cluster 1 (Fig. 3). Interestingly, whereas the rate of change of the executive profile was similar in clusters 2 and 3 (P-value = 0.75), cluster 3 showed a lower rate of memory decline compared to cluster 2 (P-value = 0.039). In none of the analyses did cluster 4 differ from cluster 1. Supplementary Table 1 and Supplementary Figs 5 and 6 summarize the results for adjusted hippocampal volume quartiles.
Table 2.
Longitudinal neuropsychological associations of the clusters
| Cluster 1 | Cluster 2 | Cluster 3 | Cluster 4 | |
|---|---|---|---|---|
| MCI to ADa | Ref. | 2.26 (<0.0001) | 1.87 (0.0024) | 1.27 (0.21) |
| ADAS-Cog13 | Ref. | 0.20 (<0.0001) | 0.09 (0.023) | 0.04 (0.31) |
| Memoryb | Ref. | −0.11 (<0.0001) | −0.06 (0.030) | 0.004 (0.86) |
| Executiveb | Ref. | −0.12 (<0.0001) | −0.11 (0.0005) | −0.04 (0.17) |
Only late MCI subjects were included due to short Alzheimer’s disease (AD) subjects follow-up.
Age, gender, education and APOE were included as covariates.
a Hazard ratio (P-value).
b Regression coefficient (P-value).
Figure 3.
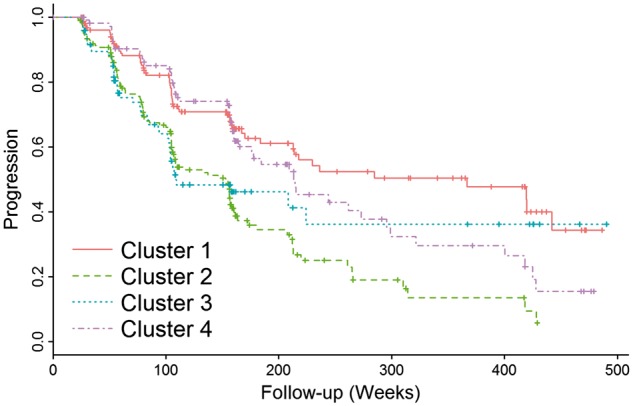
Progression from MCI to Alzheimer’s disease stratified by MRI-defined clusters.
Figure 4.
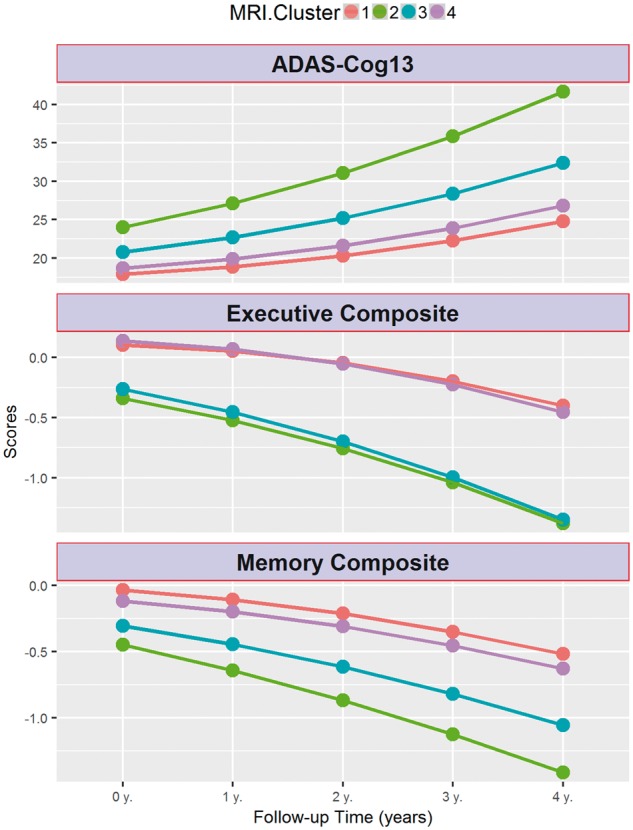
Longitudinal cognitive changes in ADAS-Cog13, memory and executive composite scores in MCI subjects stratified by MRI-defined clusters.
Longitudinal MRI changes in the different region of interests for the different groups are summarized in Supplementary Fig. 7. In this figure it can be appreciated that cluster 1 shows a similar pattern of atrophy as the cognitively normal group in all areas except the temporal lobe where atrophy rate is more pronounced for cluster 1. Cluster 2 and 3 showed the fastest rates of atrophy, with the former showing a faster temporal atrophy whereas in the latter case the preponderance was frontal. Finally, cluster 4 showed an intermediate pattern.
Prevalence of clusters as a function of age
We also investigated the prevalence of each of the four clusters, as a function of age. Figure 5 shows the number of subjects in each cluster, average over 5-year bracket around each age, as well as the cluster’s relative frequency (which takes into account the variable number of subjects per age group) as a function of age. Curves were fitted using cubic splines with three control points. Taking into consideration potential boundary effects in these fits (small number of subjects on either end of the age spectrum), Fig. 5 generally shows that the proportions of clusters 2 and 3 increase and decrease, respectively, steadily. Cluster 4 is relatively stable throughout this age range, whereas the proportion of cluster 1 seems to decrease steadily after the age of 63.
Figure 5.

Prevalence of clusters as a function of age. (A) Number of subjects with 5-year brackets. (B) Relative frequency of clusters, fitted with cubic splines.
Discussion
We evaluated the heterogeneity of neurodegeneration present in MCI and Alzheimer’s disease, relative to cognitively normal individuals, on data from ADNI and by using new semi-supervised pattern analysis and machine learning method. We found four distinct groups that best summarized this neuroanatomical heterogeneity. Besides having markedly different atrophy patterns, these groups also differed in the frequency of Alzheimer’s disease-like CSF amyloid-β1-42 and tau levels, and clinical profiles (Table 3). In particular, cluster 1 included individuals with generally normal anatomy, the lowest frequency of subjects with abnormal CSF amyloid-β1-42 levels, normal CSF-tau levels, least baseline cognitive impairment and slowest rates of cognitive decline. Conversely, cluster 2 was consistent with the typical Alzheimer’s disease-like neuroanatomical patterns and high frequency of Alzheimer’s disease-like CSF amyloid-β1-42 levels, and fastest cognitive decline affecting executive and memory cognitive domains. Cluster 3 showed greater cortical atrophy in parietal and dorsolateral frontal cortex with proportionately lesser involvement of the limbic cortex, compared to cluster 2. Although cluster 3 was associated with fast cognitive decline, this decline was more marked for the executive rather than the memory composite score, which is consistent with the imaging findings. Notably, cluster 3 MCI individuals did not show further progression to Alzheimer’s disease after 4 years, although this has to be interpreted cautiously due to the small number of subjects followed for that long a period. Finally, cluster 4 included individuals with localized atrophy in the hippocampus and medial temporal lobe, although cognitive changes did not differ from the ones observed in cluster 1.
Table 3.
Summary of characteristics of clusters
| Neuroanatomical atrophy pattern | Alzheimer’s disease-like CSF amyloid-β1-42 levels | Cognitive decline | |
|---|---|---|---|
| Cluster 1 | Mild or none; non-focal | Lowest frequency | Least steep |
| Cluster 2 | Widespread, greater temporal involvement | Higher | Steepest for memory and executive |
| Cluster 3 | Widespread, global | Higher | Steepest for executive, intermediate for memory |
| Cluster 4 | Localized, temporal | Lower | Least steep |
Whereas CSF amyloid-β and tau values can be considered as a single linear measure and pathology studies have described a typical amyloid-β in the brain and brainstem (Thal et al., 2002), we consider that structural imaging neurodegeneration patterns can be heterogeneous and that a single dichotomous classification of the neurodegeneration dimension in the Alzheimer’s disease staging system (Jack et al., 2016) into presence or absence might be an oversimplification that does not take advantage of the data richness offered by current neuroimaging approaches. As we describe below, none of the clusters captured specifically amyloid-β positivity or negativity, although the clusters showed differences in the frequency of amyloid-β positivity. It is well known that different neurodegenerative conditions can present similar clinical presentations leading to imperfect clinic-pathological correlation (Toledo et al., 2012). Therefore, it is not surprising that this extends to the patterns of brain atrophy captured by structural MRI, which ultimately represent neurodegeneration that is clinically expressed as impairment in different cognitive functions. Even in ADNI, a clinical trial-oriented cohort recruiting subjects with a typical Alzheimer’s disease profile, there has been a significant neuropathological heterogeneity in patients with classic amnestic Alzheimer’s disease clinical presentation (Toledo et al., 2013b).
The variability revealed by our analysis indicates that a dimensional approach to neurodegeneration in cognitively impaired subjects, including MCI and Alzheimer’s disease dementia stages, is important and consistent with previous observations of atypical Alzheimer’s disease presentations (Alladi et al., 2007; Gorno-Tempini et al., 2008; Crutch et al., 2012; Ossenkoppele et al., 2015). The different patterns we observed might also relate to several coincident neurodegenerative and vascular pathologies (Schneider et al., 2007; Arvanitakis et al., 2011; Toledo et al., 2012, 2013a).
This dimensional approach is important not only for a personalized prognosis but also for recruiting more homogeneous groups of individuals into clinical trials and tailored interventions. For example, MCI individuals who fall into cluster 1 have basically relatively normal brain anatomy and relatively better prognosis; their cognitive decline might be highly influenced by factors other than Alzheimer’s disease pathology. Interestingly, although this group has a decreasing relative frequency with increasing age, as expected, it remains a significant ∼20% of this population in ages 80 and older. Individuals in cluster 2 present the typical Alzheimer’s disease profile and have rapidly increasing relative frequency with increasing age (Fig. 5B). Individuals along the dimension of cluster 4 are particularly interesting. These subjects showed focal and pronounced atrophy in the temporal lobe with preserved brain volumes elsewhere. Although subjects in this group showed a relatively slower cognitive decline, long-term follow-up indicated a steady progression from MCI to dementia. These individuals are likely to represent an earlier stage, as indicated by a higher frequency of late MCI subjects as opposed to Alzheimer’s disease dementia at the baseline visit, and might later develop a pattern similar to the one observed in cluster 2. These changes would be consistent with Braak’s tau pathology staging (Braak et al., 2006). Cluster 4 could, therefore, be at the relatively early stage of disease, which is potentially an excellent target for clinical trials aiming to slow down disease progression. It is important to note that these individuals’ cognitive performance was comparable to the subjects in cluster 1, indicating that cognitive summary scores might not always capture regional differences in atrophy patterns and lack the ability to detect heterogeneous atrophy patterns. Interestingly, cluster 4 had a rather stable relative frequency as a function of age (Fig. 5B), which is consistent with the interpretation of this group as newly emerging, early stage Alzheimer’s disease cases who later move into cluster 2 as new cases take their place in cluster 4. Longitudinal analyses are required to further test this hypothesis. Finally, cluster 3 subjects presented predominantly executive function decline and a more widespread and non-focal pattern of atrophy. Therefore, this cluster might be likely representing atypical Alzheimer’s disease presentations (Ossenkoppele et al., 2015) or a mixture of pathologies which commonly presents in demented subjects and are associated with a relatively greater impairment of executive function (Toledo et al., 2012; 2013a, b; 2016). The decreasing prevalence of this group with increasing age is consistent with prior work that more ‘cortical’ or atypical presentations of Alzheimer’s disease occur more commonly at younger age of onset (van der Flier et al., 2011). In addition, the profile of cluster 3 is consistent with previous results indicating that hippocampal volume alone might be neither a sensitive, nor specific biomarker early stages (Da et al., 2014; Toledo et al., 2014, 2015), especially this might be the case for atypical non-amnestic presentations without underlying Alzheimer’s disease pathology. Our results indicate that the entire pattern of brain atrophy needs to be taken into consideration. This also further emphasizes the potential value of such clustering in clinical trial recruitment, as cluster 3, similar to cluster 2, represents a group that has a high likelihood of Alzheimer’s disease pathology based on CSF amyloid-β1-42 levels, but in which memory and hippocampal measures would be less effective as markers of disease progression than, for example, executive measures.
A somewhat unexpected finding of our study was the fact that cluster 3 had significantly lower WMH load, compared to clusters 2 and 4, and even to cluster 1 in ADNI-1, although it was characterized by fast executive decline, as our initial expectation was that this group might present more of the small vessel ischaemic disease phenotype, which would have been consistent with more widespread atrophy. It appears that cluster 3 might reflect either more cortical presentations of Alzheimer’s disease, or potentially other kinds of co-morbidities or mixed pathologies, which result in the atypical Alzheimer’s disease pattern of atrophy. For example, the initial study of ADNI autopsy cases identified that cases with coincident Lewy-related pathology had a relative large executive impairment compared to memory scores (Toledo et al., 2013b). This result could be partly explained by the exclusion of subjects with a high baseline Hachinski score or imaging findings consistent with an infarct, therefore excluding cases with overt vascular pathology from ADNI.
Somewhat unexpected was also the fact that cluster 4 had significant WMH load. As this group’s imaging pattern seems to mainly indicate early and likely relatively purer Alzheimer’s disease pathology, we did not expect to have significant WMH load. This finding is consistent with a recently reported association between high WMH volume and temporal lobe atrophy was identified in a large population-based study (Habes et al., 2016). Moreover, it has been described that the hippocampus might present relatively higher vulnerability to vascular changes (Montagne et al., 2015). Cluster 2 also displayed Alzheimer’s disease-like atrophy and high WMH load. These results indicate that lesion load and Alzheimer’s disease-like atrophy seem to be correlated, to some extent, even at seemingly early disease stages. This finding is in agreement with growing literature that shows an association between WMH load and Alzheimer’s disease pathology, albeit our study is not able to determine whether this association is due to shared risk factors or to a more direct relationship in pathophysiology.
Overall, clusters 2 and 3 presented the highest frequency of subjects with Alzheimer’s disease-like CSF amyloid-β1-42 values, whereas cluster 1 presented a higher number of subjects with normal CSF amyloid-β1-42 values. These findings confirm that different pathologies (or combinations of pathologies) (Toledo et al., 2013b) can present with classical amnestic MCI and Alzheimer’s disease dementia clinical presentations and similarities even extends to MRI patterns of atrophy, although the frequency of suspected non-amyloid pathology (SNAP) cases differed between the different clusters (4.2–36.7%) indicating that specificity varies across the clusters.
Finally, the longitudinal MRI changes did also differ between the clusters. Clusters 2 and 3 showed the fastest decline. Areas with the fastest decline corresponded to the same areas that were more involved in baseline comparisons, further reinforcing baseline findings. Interestingly, cluster 1 showed a large overlap with the cognitively normal group, except in the temporal lobe that showed a faster progression, therefore mainly involving Alzheimer’s disease areas, but probably representing an early stage, at least for part of this group.
Taken together, our findings suggest that there is remarkable heterogeneity in patterns of brain atrophy that distinguish cognitively normal from MCI and patients with Alzheimer’s disease, even in a relatively homogeneous group of subjects as those recruited in ADNI. In particular, a relatively normal group (cluster 1) displays only mild atrophy. The cross-sectional and longitudinal profile of this cluster suggests that it is heterogeneous, with some individuals likely to progress to the other two clusters (clusters 2 and 3), and some likely to remain stable for a relatively long time. Individuals belonging to the cluster 4 are likely to be at early and rapidly progressing Alzheimer’s disease stages. Individuals in cluster 3 either represent more cortical presentations of Alzheimer’s disease, perhaps reflected by their younger age, or mixed pathologies other than small vessel ischaemic disease, some of which are likely to progress to predominantly Alzheimer’s disease dementia, and others to a more executive-prominent cognitive decline and dementia. In addition to shedding light into the neuroanatomical heterogeneity of MCI and Alzheimer’s disease, our results suggest that patient recruitment into clinical trials might benefit from a finer characterization of the neuroanatomical phenotypes. Finally, our results suggest that a rigorous and quantitative dimensional neuroanatomical approach is necessary for neurodegenerative diseases, in view of the underlying heterogeneity seen, even in relatively selected groups of subjects like the ones of ADNI.
Supplementary Fig. 3 further underlines the limitations of commonly used voxel-based methods in characterizing the spectrum of neuroanatomical alterations in MCI and Alzheimer’s disease based on a priori diagnostic definitions that rely on disease severity. In particular, these figures indicate that voxel-based analysis of regional volumes detects the same form of brain atrophy pattern in Alzheimer’s disease dementia and MCI, with MCI pattern being more spatially restricted and less pronounced. This picture is consistent with a single typical progression pattern for Alzheimer’s disease, presenting a milder involvement in MCI, thereby largely missing the remarkable heterogeneity unveiled by our results. Given that the underlying pathophysiological mechanisms leading to brain atrophy are complex and heterogeneous, personalized treatment decisions and selection into treatment trials are likely to benefit significantly from the dimensional approach followed herein.
Our work differs substantially from recent clustering-based approaches (Nettiksimmons et al., 2014). The CHIMERA methodology used herein does not apply direct clustering to the images themselves which could cluster individuals according to anatomical characteristics such as brain or ventricular size, demographics, and other factors not related to disease effects. In contrast, CHIMERA estimates the disease effects by grouping the differences between patients and controls matched for these confounding covariates. Also, previous findings (Nettiksimmons et al., 2014) were derived from a much smaller sample drawn only from ADNI-1 using a limited number of features to perform the clustering (11 basic features, including brain, ventricular and hippocampal volumes) and seemed to have been significantly affected by outliers in the data (e.g. cluster 4 of the aforementioned publication included only seven individuals of likely very extreme measurements, which are arguably outliers). However, our findings are generally in agreement with (Nettiksimmons et al., 2014), especially the existence of a subpopulation of MCI which is almost entirely normal in all measures, and a subpopulation which seems to display a typical Alzheimer’s disease-like pattern, albeit their results reveal additional heterogeneity.
Another previous study described three patterns of neurofibrillary tangle deposition based on a priori definitions (Murray et al., 2011). These groups were described as hippocampal-sparing, limbic-predominant and typical Alzheimer’s disease, and were later characterized using structural MRIs (Whitwell et al., 2012). Our findings also confirm the presence of subpopulations in MCI and Alzheimer’s disease-dementia subjects with different degrees of limbic and extra-limbic pathologic that in some cases do not follow the pattern expected based on tau neurofibrillary tangle tau staging (Braak et al., 2006). In our study, cases with a lesser limbic involvement (cluster 3) were also younger than cases with typical Alzheimer’s disease atrophy, although we found larger dorsolateral prefrontal cortex atrophy. As noted above, cluster 3 is likely to include patients with more cortical disease in young onset cases as described in van der Flier et al. (2011).
Grouping subjects based on adjusted hippocampal volume quartiles led to a linear staging of patient atrophy, primarily reflecting hippocampal volume, as expected. However, these maps failed to reveal remarkable heterogeneity highlighted by our clustering analysis, including cluster 3 which was characterized by substantial and widespread cortical atrophy but relatively preserved hippocampal volumes. We have also calculated conversion and longitudinal cognitive models in Supplementary Figs 5 and 6. Although four adjusted hippocampal volume quartiles were studied, analyses showed that patterns just represented two subgroups: 75% of the subjects who progressed rapidly and the remaining 25% who remained more stable. The experiments showed that our analysis were focused on delineating imaging patterns throughout the brain, whereas hippocampal volumes are very important biomarker of memory decline but yet not sufficiently rich or specific in capturing heterogeneity of atrophy throughout the entire brain.
Limitations of this study are the smaller sample for ADNI-GO/2, which led to small numbers in some clusters, and the relative homogeneity of subjects recruited in the study, which namely were recruited as late MCI subjects with and Alzheimer’s disease-like clinical presentation or early Alzheimer’s disease dementia type subjects. Future studies should expand to more heterogeneous populations.
Supplementary Material
Acknowledgements
Data used in preparation of this article were obtained from the Alzheimer’s disease Neuroimaging Initiative (ADNI) database (adni.loni.usc.edu). As such, the investigators within the ADNI contributed to the design and implementation of ADNI and/or provided data but did not participate in analysis or writing of this report. A complete listing of ADNI investigators can be found at: http://adni.loni.usc.edu/wp-content/uploads/how_to_apply/ADNI_Acknowledgement_List.pdf.
Funding
ADNI is funded by the National Institute on Aging, the National Institute of Biomedical Imaging and Bioengineering, and through generous contributions from the following: Alzheimer’s Association; Alzheimer’s Drug Discovery Foundation; Araclon Biotech; BioClinica, Inc.; Biogen Idec Inc.; Bristol-Myers Squibb Company; Eisai Inc.; Elan Pharmaceuticals, Inc.; Eli Lilly and Company; EuroImmun; F. Hoffmann-La Roche Ltd and its affiliated company Genentech, Inc.; Fujirebio; GE Healthcare; IXICO Ltd.; Janssen Alzheimer Immunotherapy Research & Development, LLC.; Johnson & Johnson Pharmaceutical Research & Development LLC.; Medpace, Inc.; Merck & Co., Inc.; Meso Scale Diagnostics, LLC.; NeuroRx Research; Neurotrack Technologies; Novartis Pharmaceuticals Corporation; Pfizer Inc.; Piramal Imaging; Servier; Synarc Inc.; and Takeda Pharmaceutical Company. The Canadian Institutes Health Research is providing funds to support ADNI clinical sites in Canada. Private sector contributions are facilitated by the Foundation for the National Institutes of Health (www.fnih.org). The grantee organization is the Northern California Institute for Research and Education, and the study is coordinated by the Alzheimer's Disease Cooperative Study at the University of California, San Diego. ADNI data are disseminated by the Laboratory for Neuro Imaging at the University of Southern California. A.D., N.H., J.D., E.V., A.S. and C.D. are supported by R01AG14971. J.B.T. is supported by P01AG032953, P01AG017586, P30AG010124 and P50NS053488.
Supplementary material
Supplementary material is available at Brain online.
Glossary
Abbreviations
- ADNI
Alzheimer’s Disease Neuroimaging Initiative
- MCI
mild cognitive impairment
- VBM
voxel-based morphometry
- WMH
white matter hyperintensity
References
- Alladi S, Xuereb J, Bak T, Nestor P, Knibb J, Patterson K. et al. Focal cortical presentations of Alzheimer’s disease. Brain 2007; 130: 2636–45. [DOI] [PubMed] [Google Scholar]
- Arvanitakis Z, Leurgans SE, Barnes LL, Bennett DA, Schneider JA. Microinfarct pathology, dementia, and cognitive systems. Stroke 2011; 42: 722–7. [DOI] [PMC free article] [PubMed] [Google Scholar]
- Ashburner J, Friston KJ. Voxel-based morphometry—the methods. Neuroimage 2000; 11: 805–21. [DOI] [PubMed] [Google Scholar]
- Braak H, Alafuzoff I, Arzberger T, Kretzschmar H, Del Tredici K. Staging of Alzheimer disease-associated neurofibrillary pathology using paraffin sections and immunocytochemistry. Acta Neuropathol 2006; 112: 389–404. [DOI] [PMC free article] [PubMed] [Google Scholar]
- Busatto GF, Diniz BS, Zanetti MV. Voxel-based morphometry in Alzheimer’s disease. Expert Rev Neurother 2008; 8: 1691–702. [DOI] [PubMed] [Google Scholar]
- Cox RW. AFNI: software for analysis and visualization of functional magnetic resonance neuroimages. Comput Biomed Res 1996; 29: 162–73. [DOI] [PubMed] [Google Scholar]
- Crane PK, Carle A, Gibbons LE, Insel P, Mackin RS, Gross A. et al. Development and assessment of a composite score for memory in the Alzheimer’s Disease Neuroimaging Initiative (ADNI). Brain Imaging Behav 2012; 6: 502–16. [DOI] [PMC free article] [PubMed] [Google Scholar]
- Crutch SJ, Lehmann M, Schott JM, Rabinovici GD, Rossor MN, Fox NC. Posterior cortical atrophy. Lancet Neurol 2012; 11: 170–8. [DOI] [PMC free article] [PubMed] [Google Scholar]
- Da X, Toledo JB, Zee J, Wolk DA, Xie SX, Ou Y. et al. Integration and relative value of biomarkers for prediction of MCI to AD progression: spatial patterns of brain atrophy, cognitive scores, APOE genotype and CSF biomarkers. Neuroimage Clin 2014; 4: 164–73. [DOI] [PMC free article] [PubMed] [Google Scholar]
- Davatzikos C, Genc A, Xu D, Resnick SM. Voxel-based morphometry using the RAVENS maps: methods and validation using simulated longitudinal atrophy. Neuroimage 2001; 14: 1361–9. [DOI] [PubMed] [Google Scholar]
- DeCarli C, Fletcher E, Ramey V, Harvey D, Jagust WJ. Anatomical mapping of white matter hyperintensities (wmh) exploring the relationships between periventricular WMH, deep WMH, and total WMH burden. Stroke 2005; 36: 50–5. [DOI] [PMC free article] [PubMed] [Google Scholar]
- Dong A, Honnorat N, Gaonkar B, Davatzikos C. CHIMERA: clustering of heterogeneous disease effects via distribution matching of imaging patterns. IEEE Trans Med Imaging 2016; 35: 612–21. [DOI] [PMC free article] [PubMed] [Google Scholar]
- Doshi J, Erus G, Ou Y, Gaonkar B, Davatzikos C. Multi-atlas skull-stripping. Acad Radiol 2013; 20: 1566–76. [DOI] [PMC free article] [PubMed] [Google Scholar]
- Doshi J, Erus G, Ou Y, Resnick SM, Gur RC, Gur RE. et al. MUSE: MUlti-atlas region segmentation utilizing ensembles of registration algorithms and parameters, and locally optimal atlas selection. Neuroimage 2016; 127: 186–95. [DOI] [PMC free article] [PubMed] [Google Scholar]
- Gibbons LE, Carle AC, Mackin RS, Harvey D, Mukherjee S, Insel P. et al. A composite score for executive functioning, validated in Alzheimer’s Disease Neuroimaging Initiative (ADNI) participants with baseline mild cognitive impairment. Brain Imaging Behav 2012; 6: 517–27. [DOI] [PMC free article] [PubMed] [Google Scholar]
- Gorno-Tempini ML, Brambati SM, Ginex V, Ogar J, Dronkers NF, Marcone A. et al. The logopenic/phonological variant of primary progressive aphasia. Neurology 2008; 71: 1227–34. [DOI] [PMC free article] [PubMed] [Google Scholar]
- Habes M, Erus G, Toledo JB, Zhang T, Bryan N, Launer LJ. et al. White matter hyperintensities and imaging patterns of brain ageing in the general population. Brain 2016; 139 (Pt 4): 1164–79. [DOI] [PMC free article] [PubMed] [Google Scholar]
- Hurd MD, Martorell P, Delavande A, Mullen KJ, Langa KM. Monetary costs of dementia in the United States. N Engl J Med 2013; 368: 1326–34. [DOI] [PMC free article] [PubMed] [Google Scholar]
- Jack CR, Bennett DA, Blennow K, Carrillo MC, Feldman HH, Frisoni GB. et al. A/T/N: an unbiased descriptive classification scheme for Alzheimer disease biomarkers. Neurology 2016; 87: 539–47. [DOI] [PMC free article] [PubMed] [Google Scholar]
- Jack CR, Bernstein MA, Fox NC, Thompson P, Alexander G, Harvey D. et al. The Alzheimer’s disease neuroimaging initiative (ADNI): MRI methods. J Magn Reson Imaging 2008; 27: 685–91. [DOI] [PMC free article] [PubMed] [Google Scholar]
- Jack CR, Wiste HJ, Weigand SD, Knopman DS, Mielke MM, Vemuri P. et al. Different definitions of neurodegeneration produce similar amyloid/neurodegeneration biomarker group findings. Brain 2015; 138: 3747–59. [DOI] [PMC free article] [PubMed] [Google Scholar]
- Karas GB, Scheltens P, Rombouts SARB, Visser PJ, van Schijndel RA, Fox NC. et al. Global and local gray matter loss in mild cognitive impairment and Alzheimer’s disease. Neuroimage 2004; 23: 708–16. [DOI] [PubMed] [Google Scholar]
- Klöppel S, Stonnington CM, Chu C, Draganski B, Scahill RI, Rohrer JD. et al. Automatic classification of MR scans in Alzheimer’s disease. Brain 2008; 131: 681–9. [DOI] [PMC free article] [PubMed] [Google Scholar]
- Lam B, Masellis M, Freedman M, Stuss DT, Black SE. Clinical, imaging, and pathological heterogeneity of the Alzheimer’s disease syndrome. Alzheimers Res Ther 2013; 5: 1. [DOI] [PMC free article] [PubMed] [Google Scholar]
- Larner AJ. Getting it wrong: the clinical misdiagnosis of Alzheimer’s disease. Int J Clin Pract 2004; 58: 1092–4. [DOI] [PubMed] [Google Scholar]
- Li C, Gore JC, Davatzikos C. Multiplicative intrinsic component optimization (MICO) for MRI bias fi eld estimation and tissue segmentation. Magn Reson Imaging 2014; 32: 913–23. [DOI] [PMC free article] [PubMed] [Google Scholar]
- McKeith IG, Fairbairn AF, Perry RH, Thompson P. The clinical diagnosis and misdiagnosis of senile dementia of Lewy body type (SDLT). Br J Psychiatry 1994; 165: 324–32. [DOI] [PubMed] [Google Scholar]
- McKhann G, Drachman D, Folstein M, Katzman R, Price D, Stadlan EM. Clinical diagnosis of Alzheimer’s disease: report of the NINCDS–ADRDA Work Group under the auspices of Department of Health and Human Services Task Force on Alzheimer's Disease. Neurology 2011; 77: 333. [DOI] [PubMed] [Google Scholar]
- Misra C, Fan Y, Davatzikos C. Baseline and longitudinal patterns of brain atrophy in MCI patients, and their use in prediction of short-term conversion to AD: results from ADNI. Neuroimage 2009; 44: 1415–22. [DOI] [PMC free article] [PubMed] [Google Scholar]
- Montagne A, Barnes SR, Sweeney MD, Halliday MR, Sagare AP, Zhao Z. et al. Blood-brain barrier breakdown in the aging human hippocampus. Neuron 2015; 85: 296–302. [DOI] [PMC free article] [PubMed] [Google Scholar]
- Murray ME, Graff-Radford NR, Ross OA, Petersen RC, Duara R, Dickson DW. Neuropathologically defined subtypes of Alzheimer’s disease with distinct clinical characteristics: a retrospective study. Lancet Neurol 2011; 10: 785–96. [DOI] [PMC free article] [PubMed] [Google Scholar]
- Nettiksimmons J, DeCarli C, Landau S, Beckett L; Alzheimer's Disease Neuroimaging Initiative. Biological heterogeneity in ADNI amnestic mild cognitive impairment. Alzheimer’s Dement 2014; 10: 511–21. [DOI] [PMC free article] [PubMed] [Google Scholar]
- Noh Y, Jeon S, Lee JM, Seo SW, Kim GH, Cho H. et al. Anatomical heterogeneity of Alzheimer disease based on cortical thickness on MRIs. Neurology 2014; 83: 1936–44. [DOI] [PMC free article] [PubMed] [Google Scholar]
- Ossenkoppele R, Pijnenburg YAL, Perry DC, Cohn-Sheehy BI, Scheltens NME, Vogel JW. et al. The behavioural/dysexecutive variant of Alzheimer’s disease: clinical, neuroimaging and pathological features. Brain 2015; 138: 2732–49. [DOI] [PMC free article] [PubMed] [Google Scholar]
- Ou Y, Sotiras A, Paragios N, Davatzikos C. DRAMMS: deformable registration via attribute matching and mutual-saliency weighting. Med Image Anal 2011; 15: 622–39. [DOI] [PMC free article] [PubMed] [Google Scholar]
- Petersen R, Smith G, Waring S, Ivnik R, Tangalos E, Kokmen E. Mild cognitive impairment: clinical characterization and outcome. JAMA Neurol 1999; 56: 303–8. [DOI] [PubMed] [Google Scholar]
- Petersen RC, Aisen PS, Beckett LA, Donohue MC, Gamst AC, Harvey DJ. et al. Alzheimer’s Disease Neuroimaging Initiative (ADNI): clinical characterization. Neurology 2010; 74: 201–9. [DOI] [PMC free article] [PubMed] [Google Scholar]
- R Core Team. R: a language and environment for statistical computing. Vienna, Austria: R Core Team; 2016. [Google Scholar]
- Reuter M, Rosas HD, Fischl B. Highly accurate inverse consistent registration: a robust approach. Neuroimage 2010; 53: 1181–96. [DOI] [PMC free article] [PubMed] [Google Scholar]
- Reuter M, Schmansky NJ, Rosas HD, Fischl B. Within-subject template estimation for unbiased longitudinal image analysis. Neuroimage 2012; 61: 1402–18. [DOI] [PMC free article] [PubMed] [Google Scholar]
- Schneider JA, Arvanitakis Z, Bang W, Bennett DA. Mixed brain pathologies account for most dementia cases in community-dwelling older persons. Neurology 2007; 69: 2197–204. [DOI] [PubMed] [Google Scholar]
- Schwarz C, Fletcher E, DeCarli C, Carmichael O. Fully-automated white matter hyperintensity detection with anatomical prior knowledge and without FLAIR. Inf Process Med Imaging 2009; 21: 239–51. [DOI] [PMC free article] [PubMed] [Google Scholar]
- Shaw LM, Vanderstichele H, Knapik-Czajka M, Clark CM, Aisen PS, Petersen RC. et al. Cerebrospinal fluid biomarker signature in Alzheimer’s disease neuroimaging initiative subjects. Ann Neurol 2009; 65: 403–13. [DOI] [PMC free article] [PubMed] [Google Scholar]
- Shaw LM, Vanderstichele H, Knapik-Czajka M, Figurski M, Coart E, Blennow K. et al. Qualification of the analytical and clinical performance of CSF biomarker analyses in ADNI. Acta Neuropathol 2011; 121: 597–609. [DOI] [PMC free article] [PubMed] [Google Scholar]
- Shiino A, Watanabe T, Maeda K, Kotani E, Akiguchi I, Matsuda M. Four subgroups of Alzheimer’s disease based on patterns of atrophy using VBM and a unique pattern for early onset disease. Neuroimage 2006; 33: 17–26. [DOI] [PubMed] [Google Scholar]
- Thal DR, Rüb U, Orantes M, Braak H. Phases of Aβ-deposition in the human brain and its relevance for the development of AD. Neurology 2002; 58: 1791–800. [DOI] [PubMed] [Google Scholar]
- Toledo JB, Arnold SE, Raible K, Brettschneider J, Xie SX, Grossman M. et al. Contribution of cerebrovascular disease in autopsy confirmed neurodegenerative disease cases in the National Alzheimer’s Coordinating Centre. Brain 2013a; 136: 2697–706. [DOI] [PMC free article] [PubMed] [Google Scholar]
- Toledo JB, Bjerke M, Chen K, Rozycki M, Jack CR, Weiner MW. et al. Memory, executive, and multidomain subtle cognitive impairment clinical and biomarker findings. Neurology 2015; 85: 144–53. [DOI] [PMC free article] [PubMed] [Google Scholar]
- Toledo JB, Brettschneider J, Grossman M, Arnold SE, Hu WT, Xie SX. et al. CSF biomarkers cutoffs: the importance of coincident neuropathological diseases. Acta Neuropathol 2012; 124: 23–35. [DOI] [PMC free article] [PubMed] [Google Scholar]
- Toledo JB, Cairns NJ, Da X, Chen K, Carter D, Fleisher A. et al. Clinical and multimodal biomarker correlates of ADNI neuropathological findings. Acta Neuropathol Commun 2013b; 1: 65. [DOI] [PMC free article] [PubMed] [Google Scholar]
- Toledo JB, Gopal P, Raible K, Irwin DJ, Brettschneider J, Sedor S. et al. Pathological α-synuclein distribution in subjects with coincident Alzheimer’s and Lewy body pathology. Acta Neuropathol 2016: 131: 393–409. [DOI] [PMC free article] [PubMed] [Google Scholar]
- Toledo JB, Weiner MW, Wolk DA, Da X, Chen K, Arnold SE. et al. Neuronal injury biomarkers and prognosis in ADNI subjects with normal cognition. Acta Neuropathol Commun 2014; 2: 26. [DOI] [PMC free article] [PubMed] [Google Scholar]
- van der Flier WM, Pijnenburg YAL, Fox NC, Scheltens P. Early-onset versus late-onset Alzheimer’s disease: the case of the missing APOE ɛ4 allele. Lancet Neurol 2011; 10: 280–8. [DOI] [PubMed] [Google Scholar]
- Weiner MW, Veitch DP, Aisen PS, Beckett LA, Cairns NJ, Cedarbaum J. et al. Impact of the Alzheimer’s disease neuroimaging initiative, 2004 to 2014. Alzheimers Dement 2015; 11: 865–84. [DOI] [PMC free article] [PubMed] [Google Scholar]
- Whitwell JL, Dickson DW, Murray ME, Weigand SD, Tosakulwong N, Senjem ML. et al. Neuroimaging correlates of pathologically defined subtypes of Alzheimer’s disease: a case-control study. Lancet Neurol 2012; 11: 868–77. [DOI] [PMC free article] [PubMed] [Google Scholar]
- Wilson RS, Yu L, Trojanowski JQ, Chen E-Y, Boyle PA, Bennett DA. et al. TDP-43 pathology, cognitive decline, and dementia in old age. JAMA Neurol 2013; 70: 1418–24. [DOI] [PMC free article] [PubMed] [Google Scholar]
- Zanetti M, Ballabio C, Abbate C, Cutaia C, Vergani C, Bergamaschini L. Mild cognitive impairment subtypes and vascular dementia in community-dwelling elderly people: a 3-year follow-up study. J Am Geriatr Soc 2006; 54: 580–6. [DOI] [PubMed] [Google Scholar]
Associated Data
This section collects any data citations, data availability statements, or supplementary materials included in this article.