

The respective contributions of soluble oligomeric tau and neurofibrillary tangles to neurodegeneration remain uncertain. d’Orange et al. generate two rodent models of tauopathy, one displaying only soluble tau and the other mainly fibrillary tau. Potentiating tangle formation protects neighbouring neurons from the acute toxicity of soluble tau species.
Keywords: tauopathies, aggregation, gene-transfer, rodent model, design-based stereology
Abstract
Tauopathies are neurodegenerative diseases characterized by the aggregation of tau protein. These pathologies exhibit a wide variety of clinical and anatomo-pathological presentations, which may result from different pathological mechanisms. Although tau inclusions are a common feature in all these diseases, recent evidence instead implicates small oligomeric aggregates as drivers of tau-induced toxicity. Hence in vivo model systems displaying either soluble or fibrillary forms of wild-type or mutant tau are needed to better identify their respective pathological pathways. Here we used adeno-associated viruses to mediate gene transfer of human tau to the rat brain to develop models of pure tauopathies. Two different constructs were used, each giving rise to a specific phenotype developing in less than 3 months. First, hTAUWT overexpression led to a strong hyperphosphorylation of the protein, which was associated with neurotoxicity in the absence of any significant aggregation. In sharp contrast, its co-expression with the pro-aggregation peptide TauRD-ΔK280 in the hTAUProAggr group strongly promoted its aggregation into Gallyas-positive neurofibrillary tangles, while preserving neuronal survival. Our results support the hypothesis that soluble tau species are key players of tau-induced neurodegeneration.
Introduction
The accumulation of hyperphosphorylated and misfolded microtubule-associated protein tau (MAPT) into cells of the brain has been described as a characteristic feature of a family of neurodegenerative diseases called tauopathies (Grundke-Iqbal et al., 1986; Braak and Braak, 1991; Weller, 2008). However, to this day, neither the exact causing factors of its aggregation nor the mechanisms leading to neuronal and synaptic loss have been elucidated, delaying the development of efficient therapeutic treatments. Indeed, our understanding of these diseases is largely impeded by the variety of anatomo-pathological profiles displayed by the different tauopathies. In Alzheimer’s disease, the most common of them, the tau protein aggregates into paired helical filaments (PHFs) and forms neurofibrillary tangles (NFTs), progressing from transentorhinal areas to the limbic system, encompassing the hippocampus, and finally affecting the neocortex (Braak and Braak, 1991). In other sporadic tauopathies such as progressive supranuclear palsy and corticobasal degeneration, similar lesions are found in neurons and glia but in distinct brain regions (Weller, 2008). Among familial tauopathies, frontotemporal dementia presents a large genetic diversity, linked to more than 30 mutations already described, leading to a large variety of anatomo-pathological features (Simic et al., 2016). While tau aggregation is undoubtedly implicated in all these diseases, the exact pathological mechanisms involved remain largely unclear.
Many pioneering studies have evaluated the occurrence of tau aggregation in relation to disease progression to better understand its role in the neurodegenerative process. Since the discovery that spatial progression of tau pathology is associated with increased severity of Alzheimer’s disease dementia (Braak and Braak, 1991), it was first suggested that NFT formation played an active role in neurodegeneration. Indeed, several studies found a strong correlation between NFT numbers and neuronal loss as well as clinical score, suggesting that NFT-dependent neurodegeneration plays an important role in the cognitive decline found in demented patients (Dickson et al., 1995; Giannakopoulos et al., 2003). This classic view of NFTs as being the main species of tau-induced toxicity is, however, now strongly questioned. Indeed, spatial dissociation between NFT formation and neurodegeneration was observed in the brains of Alzheimer’s disease patients (Vogt et al., 1998), as well as in transgenic mouse models (Spires et al., 2006). Although NFTs number correlates with neurodegeneration, the amount of neuronal loss strongly exceeds the number of tangle-bearing neurons (Gomez-Isla et al., 1997; Vogt et al., 1998), suggesting that most neurons die from other mechanisms. On the other hand, neurons seem to survive after tau starts to aggregate in the soma (Morsch et al., 1999; de Calignon et al., 2010) and can remain fully integrated into functional neural networks (Fox et al., 2011; Kuchibhotla et al., 2014; Rudinskiy et al., 2014).
More recently, soluble oligomeric forms of tau have been pinpointed as the most toxic form of tau aggregates. They were detected in pre-tangles both in Alzheimer’s disease (Patterson et al., 2011; Lasagna-Reeves et al., 2012b) and tau transgenic mouse brains (Berger et al., 2007). Following injection into the brain of wild-type mice, both recombinant and brain-derived tau oligomers were the only species able to induce a large variety of cellular defects, including reduction of synaptic and mitochondrial markers, caspase activation and neuronal loss, leading to cognitive deficits prior to the appearance of tangles (Lasagna-Reeves et al., 2011, 2012a; Fa et al., 2016). Hence, the respective contribution and the temporal occurrence of these different tau species in the pathological process is still unclear. The field would benefit from in vivo model systems generating either soluble or fibrillary forms of tau to better identify their respective pathological pathways.
To ascertain the current hypothesis that soluble tau species are the most toxic forms, we developed two models of tauopathy in rats that allow side-by-side comparison of the role of different tau species. To this aim, we used adeno-associated virus (AAV) gene transfer to overexpress various variants of human tau in the hippocampus of adult rats and we examined the differential neurotoxicity, aggregation and inflammation exerted by wild-type human tau (hTAUWT) and a new chimeric construct (hTAUProAggr) co-expressing the pro-aggregation TauRD-ΔK280 peptide and wild-type human tau. In this study, we show that within 3 months after AAV injection, hTAUWT overexpression led to a strong hyperphosphorylation of the tau protein associated with striking neurodegeneration in the absence of any significant aggregation. In sharp contrast, co-expression of hTAUWT with the pro-aggregation peptide TauRD-ΔK280 in the hTAUProAggr group strongly promoted its aggregation into mature NFTs while offering neuroprotection to hippocampus neurons.
Material and methods
Animal experiments
Adult male Wistar rats (2 months old, 250 g; JANVIER, n = 124) were used for AAV transduction. All animal studies were conducted according to the French regulation (EU Directive 86/609 – French Act Rural Code R 214-87 to 131). The animal facility was approved by veterinarian inspectors (authorization n°B 92-032-02) and complied with Standards for Humane Care and Use of Laboratory Animals of the Office of Laboratory Animal Welfare (OLAW – n°#A5826-01). All procedures received approval from the local ethical committee (Comité d’Ethique en Expérimentation Animale CEA) and the French Ministry of Research [2015063015326177_v1 (APAFIS#985)].
Four groups of rats were included in all analyses. Two human 1N4R tau constructs were cloned including wild-type (hTAUWT) and pro-aggregation tau (hTAUProAggr). A control group termed ‘utGFP’ was designed to express a green fluorescent protein (GFP) mRNA that would not be translated into a protein. This construct was used here to overcome the described toxicity of GFP protein in some AAV-mediated models (Klein et al., 2006). An additional control group was injected with saline (phosphate-buffered saline, PBS). See Supplementary material for more details.
AAV vectors construction and production
For AAV production, transgenes were inserted into a shuttle plasmid using Gateway® LR Clonase® system (Invitrogen). The different tau constructs and the utGFP gene were cloned under control of the chimeric cytomegalovirus/chicken β-actin (CBA) promoter into a single stranded, rAAV2-based shuttle vector containing the woodchuck hepatitis virus post-transcriptional regulatory element (WPRE) sequence and with termination by the bovine growth hormone polyadenylation (bGHpA) signal. The entry vector used for the construction of hTAUWT vector was previously described (Caillierez et al., 2013). The entry vectors used for utGFP and hTAUProAggr transgenes were synthetized by GeneArt (Thermo Fisher) (Supplementary Tables 1 and 2). All constructs were packaged into AAV8 capsids by the MIRCen viral production platform as described (Berger et al., 2015) (Supplementary material).
Stereotaxic injections of AAV vectors
Methods for stereotaxic injections are detailed in Supplementary material. Briefly, AAV vectors were injected bilaterally into the dorsal and ventral hippocampus at the following stereotaxic coordinates (Paxinos and Watson, 1998): dorsal hippocampus −4.3 mm rostral to bregma, 3 mm lateral to midline and −2.8 mm from the skull surface, ventral hippocampus −5.6 mm rostral to bregma, 5 mm lateral to midline and −7 mm from the skull surface. For each injection site, 4 µl containing 2.5 × 10¹⁰ vg of each vector was delivered using a microdialysis pump (Stoelting) set at 0.25 µl/min.
Immunohistology
One or three months after injection, rats were anaesthetized with 4% isoflurane before receiving a lethal dose of pentobarbital (60 mg/ml). Animals were then fixed by cardiac perfusion with 0.9% NaCl followed by 4% paraformaldehyde (PFA) in 0.01 M PBS. The brain was collected, post-fixed overnight in 4% PFA at +4°C and transferred in a 30% sucrose solution in PBS for cryoprotection before sectioning on a freezing microtome (Leica). Fourteen series of 30-µm sections were collected, spanning the entire hippocampus.
For free-floating immunohistochemistry, sections were incubated for 30 min with 0.3% H2O2 in PBS. After rinsing in PBS 0.01 M, 0.2% Triton™ X-100 (Sigma), sections were incubated 1 h with the blocking solution containing normal goat serum (NGS) in PBS and transferred into primary antibody solutions for incubation overnight at +4°C. After rinsing, sections were incubated with the appropriate secondary antibody diluted to 1/1000 into blocking solution for 1 h at room temperature followed by 30 min incubation in Vectastain ABC Kit (Vector Laboratories) and revelation using the DAB Peroxidase Substrate Kit with nickel (Vector Laboratories).
For free-floating immunofluorescence, sections were incubated directly in blocking solution before transfer into primary antibody solutions for incubation overnight at +4°C. After rinsing, sections were then transferred into Alexa-coupled secondary antibodies (Thermo Fisher) to 1/500 into blocking solution for incubation 1 h at room temperature. AT8 immunostaining was amplified using CY3-coupled streptavidin diluted to 1/500 in blocking solution (Sigma-Aldrich). For primary antibody dilutions, see Supplementary Table 3.
Gallyas silver impregnation
Gallyas silver impregnation was performed as described in the Supplementary material. Blind semiquantitative scoring was performed on each section spanning the entire hippocampus using the following criteria: 0, no gallyas positive cell; 1, a few isolated cells; 2, isolated cells on a large portion of the hippocampus or clusters on a small portion of the hippocampus; 3, clusters on a large portion of the hippocampus; and 4, clusters on the entire hippocampus. Scores were summed for each animal and the mean Gallyas score was compared between groups.
Image analysis
Z-stack images of AT100 and AT8/vimentin immunostainings were acquired at 20× (10 µm depth, 1 µm steps and 12 µm depth, 2 µm steps, respectively) using an Axio Scan.Z1 (Zeiss). For AT100 staining, z-projection images were then converted into JPEG files and reduced to 70% of full resolution size. Manual counting of AT100 positive somas was then performed using ImageJ software (cell counting plugin) on all sections of a series, spanning the entire hippocampus. Manual segmentation of the vimentin-positive region was performed on the AT8/vimentin sections using Morpho Strider software (Explora Nova) followed by thresholding. The mean Vimentin-positive volume was then compared between groups. AT8/ Iba1 and HT7 immunolabelled sections were scanned at 20× using a NanoZoomer (Hamamatsu). Manual segmentation of the entire hippocampus was then performed before thresholding of each fluorescent channel (FITC for Iba1 and HT7, TRITC for AT8) using Visiopharm Integrator System software (Visiopharm). Preprocessing of images was performed prior to thresholding using a series of image transformations implemented into the software, enabling more accurate segmentation of the staining. The mean percentage of hippocampus volume occupied by AT8-positive staining and total AT8 and HT7 burden [the mean fluorescence intensity (MFI) multiplied by the AT8 or HT7-positive area] were then computed. For Iba1 quantification, estimation of Iba1-positive volume was computed after thresholding.
Stereology
Unbiased stereological counting of Cornu ammonis 1/2 (CA1/2) pyramidal neurons was performed using Stereo Investigator software (MBF Bioscience) on every 14th section (30-µm thick sections) spanning the entire hippocampus. Z-stacks (1 µm steps) of 40× images of NeuN staining were acquired on a spinning-disk confocal microscope (BX51WI, Olympus) and analysed with the optical fractionator. The tissue thickness was measured at every unbiased counting space (UVCS) location and was found to be 17.38 ± 2.50 µm [mean ± standard deviation (SD)]. The height of the UVCSs was set to 10 µm with a 2 µm guard zone above and below. The base area of the UVCSs was set to 20 × 20 µm with a grid size of 100 × 100 µm. This led to a number of investigated fields per animal of 557 ± 78 and to a number of counted cells of 511 ± 105 per animal. As a result, the coefficient of error was on average smaller than 0.05 (Schmitz, 1998; Schmitz and Hof, 2005).
Biochemical analysis
One or three months after injection, six rats per group were anaesthetized with 4% isoflurane before receiving a lethal dose of pentobarbital (60 mg/ml). Brains were then extracted and briefly rinsed in 0.1 M PBS before dissection of the hippocampus. One hemisphere served for biochemical analysis, the other one for real-time quantitative polymerase chain reaction (RT-qPCR) study. For details on sample preparation, see Supplementary material.
Extraction of sarkosyl-insoluble tau
Sarkosyl extraction was performed as described in the Supplementary material. Briefly, 0.23% Triton was added to each sample. The sample was then sonicated before centrifugation at 5000g for 10 min at +4°C. The supernatant was collected for ultracentrifugation at 100 000g for 1 h at +4°C. The pellet was resuspended in 1% sarkosyl, sonicated and went through a second ultracentrifugation at 100 000g for 1 h at +4°C. The pellet containing the sarkosyl insoluble fraction was then resuspended in 100 µl of 2× LDS.
Western blot
Immunoblotting was performed as described in the Supplementary material. Briefly, samples were loaded onto a 4–12% Bis-Tris NuPAGE® Novex® gel (Invitrogen), followed by transfer onto a 0.45 µm nitrocellulose membrane using the Novex system from Life Technologies (XCell II™ blot module). The membrane was then incubated either with or without blocking solution for 1 h at room temperature and transferred into the antibody diluted in the blocking solution (or without) for incubation overnight at +4°C. The membrane was then incubated for 1 h with the appropriate secondary antibody diluted in the blocking solution (or without). Signal was visualized using either ECL western blotting detection reagents (GE Healthcare) or Odyssey CLx Imager (LI-COR Biosciences). For antibody dilutions and blocking solutions, see Supplementary Table 3.
Real-time quantitative PCR
RT-qPCR was performed as described in the Supplementary material. Briefly, fresh hippocampus structure was lysed in 1 ml of TRIzol® using Precellys®24 homogenizer (Bertin Technologies) and total RNA (including miRNAs) isolated using miRNeasy mini kit (QIAGEN), following the manufacturer’s instructions. In parallel, an additional series of fixed histological sections was used to extract mRNAs using E.Z.N.A.® FFPE RNA Kit (R6954-01; Omega Biotek) following the supplier’s guidelines. For each animal, the hippocampus was first dissected out from 11 coronal fixed 30-µm thick sections, giving rise to 3–6 µg mRNA. RNAs (0.125 µg) were then reverse-transcribed into cDNA using SuperScript™ VILO™ cDNA Synthesis Kit (Invitrogen). RT-qPCR was then performed using iTaq™ Universal SYBR® Green Supermix (Bio-Rad) and primers (Bio-Rad or Eurofin Genomics) specific to different targets on 1 ng of cDNA, using 3 nM of primers. Reactions were run in triplicates in 384-well PCR plates and the cDNA of four non-injected Wistar rats served as an inter-plate reference. Cycle threshold (Ct) values were generated using Bio-Rad CFX manager software (regression mode).
Quantification of CSF total tau
Terminal CSF sampling from the cisterna magna was performed on all animals used in this study (n = 124). CSF samples (100–150 µl) were then vortexed before centrifugation at 4000g for 10 min at 4°C. Samples were then aliquoted by 30 µl and stored at −80°C. For human total tau dosage (V-plex, Meso Scale Diagnostics), triplicates of each aliquot diluted to 1/4 in diluent 35 (Meso Scale Diagnostics) were loaded onto plates. Dosage was then performed following manufacturer’s instructions. CSF samples that were heavily contaminated with blood during collection were excluded from further analysis.
Statistical analysis
Results are presented as mean ± standard error of the mean (SEM). Statistical analysis was carried out using Statistica 13 software (Statsoft, Tulsa, OK, USA). Prior to analysis, the data were assessed for normality and homogeneity of variance. If they fulfilled the criteria for general linear model, they were analysed by one-way ANOVA followed by Bonferroni’s post hoc tests for pairwise comparisons. Otherwise, a non-parametric equivalent was used. In case of non-homogeneity of variances, data were transformed and the appropriate statistical test used. All data are presented here in their original form including those that necessitated transformation. When no statistical difference between PBS and utGFP groups could be observed, those were pooled into a single control group for comparison to tau constructs. For correlation studies, data were assessed for normality, followed by Pearson correlation test. This was performed uniquely on tau groups with exclusion of control animals. Annotations used to indicate level of significance are as follows: *P < 0.05, **P < 0.01, ***P < 0.001.
Results
Generation of two models of pure tauopathy by AAV-mediated gene transfer of human tau
One model of pure tauopathy was generated using AAV-mediated gene transfer of the 1N4R isoform of wild-type (hTAUWT, Fig. 1A) human tau. A bi-cistronic construct (hTAUProAggr, Fig. 1B) was used to express a chimeric protein containing hTAUWT linked through a 2 A peptide sequence (P2A) to a pro-aggregation peptide (TauRD-ΔK280). TauRD-ΔK280 consists of the four repeat-domains of tau protein carrying the ΔK280 mutation (Supplementary Table 2). Previous studies showed that mild overexpression of this peptide in transgenic mice is sufficient to trigger the formation of mature NFTs (Mocanu et al., 2008; Van der Jeugd et al., 2012). Here, cleavage of P2A sequence resulted in the release of both TauRD-ΔK280 and hTAUWT as confirmed in vitro and in vivo (Supplementary Fig. 1). In HEK cells infected with either vector, hTau expression was similar in both the hTAUWT and hTAUProAggr groups as no difference between constructs could be observed in either protein [Fig. 2A; Kruskal-Wallis non-parametric test, H(2) = 8.00, P < 0.05, Bonferroni pairwise multiple comparisons test] or mRNA [Fig. 2B; Kruskal-Wallis non-parametric test, H(2) = 9.62, P < 0.01, Bonferroni post hoc test] levels when HEK cells were infected with either vector.
Figure 1.
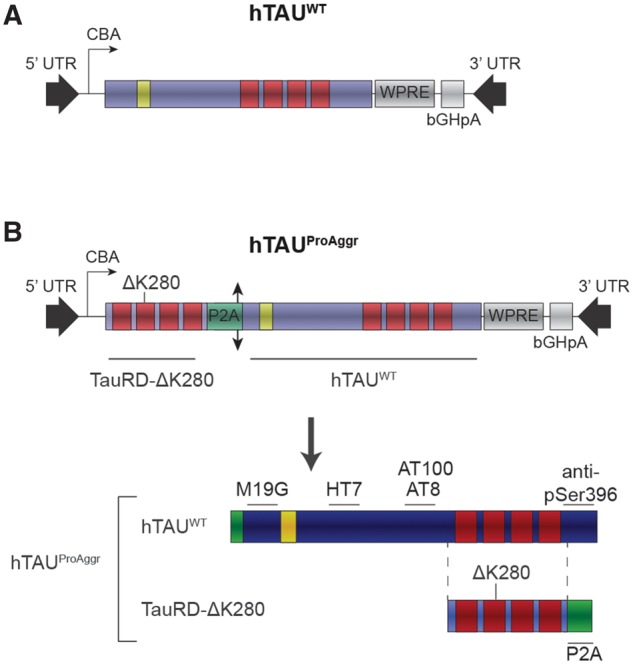
Schematic representation of tau vectors used. All constructs were expressed under the CBA promoter and contained the WPRE expression-enhancing sequence as well as bGHpA tail. Human wild-type (A, hTAUWT) 1N4R tau isoform was used, containing only one N-terminal repeat (yellow) and four microtubule-binding domains (MBDs, red). A bi-cistronic construct (B, hTAUProAggr) was also used to co-express hTAUWT and a pro-aggregation peptide (TauRD-ΔK280) composed of the four MBDs of human tau, bearing the ΔK280 pro-aggregation mutation. A single chimeric protein gives rise, after cleavage of the P2A sequence (double arrow head) into the cell, to a 1:1 expression ratio of hTAUWT and TauRD-ΔK280. Location on tau protein and on the pro-aggregation peptide of epitopes recognized by the different antibodies used in this study are indicated.
Figure 2.

Tau transgene expression levels. (A) Representative blot for human tau (HT7) expression at 72 h post-infection of HEK cells and quantification of tau expression, normalized to actin, show similar protein expression in hTAUWT and hTAUProAggr groups. (B) RT-qPCR for the tau transgene in HEK cells confirms similar transgene expression in both tau groups. (C) Schematic representation of injection coordinates (red cross) and representative images of tau staining (HT7) in a hTAUProAggr animal at 1 month post-injection (pi) show strong transgene expression in a large portion of the hippocampus. (D) The total HT7-positive hippocampus burden is not different between groups, suggesting similar levels of tau protein. (E) RT-qPCR for human tau (MAPT) mRNA on transcriptomic samples of fixed sections shows, however, higher mRNA levels in the hTAUProAggr group compared to hTAUWT animals. Asterisks above each bar represent the result of post hoc comparisons to utGFP group (A, B, D and E). #P = 0.086, *P < 0.05, **P < 0.01, ***P < 0.001.
For in vivo studies, AAVs were delivered bilaterally by stereotaxic surgery to both the dorsal and ventral parts of the hippocampus. One month after injection, extensive expression of tau was detected, spanning the entire hippocampus on the antero-posterior axis, with expression observed in most of the hippocampal subfields, including CA1/2 and CA3/4 subregions as well as the dentate gyrus (Fig. 2C). Human tau expression was first assessed by quantifying the total tau protein levels with HT7 immunostaining across the whole hippocampus [Fig. 2D; one-way ANOVA, F(2,19) = 11.92, P < 0.001, Bonferroni post hoc test]. The total HT7 burden (area × signal intensity) was similar between hTAUWT and hTAUProAggr groups while no staining was detected in the utGFP group [Fig. 2D; one-way ANOVA, F(2,19) = 11.92, P < 0.001, Bonferroni post hoc test]. Nonetheless, RT-qPCR for transgene mRNA showed higher transgene expression in vivo in the hTAUProAggr group compared to the hTAUWT group at this time-point [Fig. 2E; Kruskal-Wallis non parametric test, H(2) = 15.16, P < 0.001 and H(2) = 14.89, P < 0.001, Bonferroni pairwise multiple comparisons test, respectively, for transcriptomic samples and fixed sections].
The ability of both constructs to induce hyperphosphorylation of tau was then assessed using the AT8 antibody (Fig. 3). One month after injection, widespread hyperphosphorylation of tau was detected in most of the hippocampal subfields (Fig. 3A). This hyperphosphorylation was associated in both tau groups with mislocalization of the protein to the somatodendritic compartment. Both tau constructs were thus able to induce missorting of pathological hyperphosphorylated tau. Conversely, no AT8 staining was observed in PBS or utGFP control groups (Fig. 3A).
Figure 3.

Extent of tau hyperphosphorylation produced by our vectors. (A) Strong AT8 tau pathology is observed in a large portion of the hippocampus after 1 month of transgene expression. Scale bar = 500 µm. (B and C) Quantification of AT8 total burden (B) and of the percentage of AT8-positive hippocampal volume (C) shows differences between constructs in the extent of tau hyperphosphorylation. Asterisks above each bar represent results of the post hoc comparison to hTAUWT. *P < 0.05, **P < 0.01. pi = post-injection.
Quantification of AT8 immunofluorescent staining revealed differences between groups in the extent of tau hyperphosphorylation. Hence, total AT8 burden (Fig. 3B) was found to be higher in the hTAUWT group at both 1 and 3 months post-injection compared to hTAUProAggr animals [independent t-tests, t(12) = 2.404, P < 0.05 and t(14) = − 3.147, P < 0.01, respectively]. Similar group differences were observed at 3 months post-injection when looking at the percentage of AT8-positive hippocampal volume [Fig. 3C; independent t-test, t(14) = −3.487, P < 0.01]. Thus, while hTAUWT induced the strongest hyperphosphorylation, co-expression of hTAUWT with the pro-aggregation peptide in the hTAUProAggr group was associated with reduced AT8 reactivity.
Tau constructs differ by the stage of aggregation and the nature of tau aggregates
The AT100 antibody, detecting a late stage phospho-epitope found mostly in intracellular NFTs in human (Allen et al., 2002; Augustinack et al., 2002), was used as a marker of aggregation (Fig. 4A). Neuronal somatic and neuritic staining was found in all hippocampal subfields only in the hTAUProAggr group from 1 month post-injection. In addition, some astrocyte-like AT100-positive profiles were also observed in this group (Fig. 4C). In contrast, the overexpression of hTAUWT construct did not lead to significant tau aggregation up to 3 months post-injection. Counting of AT100-positive neurons indeed showed larger numbers in the hTAUProAggr group when compared to hTAUWT [Fig. 4B; independent t-tests t(12) = 16.45, P < 0.001 and Mann-Whitney U-test U = 0.00, P < 0.001 at 1 and 3 months post-injection, respectively]. The AT100 epitope being located outside of the repeated regions (Fig. 1B), only aggregates containing full-length tau were visualized with this antibody. Seeding of hTAUWT by pro-aggregation peptide was suggested by their co-localization (Supplementary Fig. 2A). Thus, the co-expression of TauRD-ΔK280 with hTAUWT in the hTAUProAggr group strongly promoted the aggregation of wild-type human full-length tau, which alone was not able to aggregate. In contrast, no AT100 staining could be observed in PBS or utGFP animals (Supplementary Fig. 3).
Figure 4.

Tau constructs differ in their ability to aggregate. (A) Representative images of AT100 staining show neuritic and somatic aggregation mainly in hTAUProAggr group. Scale bars: 150 µm (left) and 50 µm (right). (B) Estimation of the total number of AT100-positive somas in the entire hippocampal formation. Asterisks above each bar represent results of a t-test between groups. ***P < 0.001. (C) Both neuronal and astrocyte-like AT100-positive lesions are observed in the hTAUProAggr group. Scale bar = 20 µm. (D) Representative images of Gallyas staining showing NFT-like lesions in hTAUProAggr animals (Scale bar = 200 µm) and blind semiquantitative scoring of Gallyas-positive NFT pathology on the entire hippocampus at 1 and 3 months post-injection (pi).
The stage of tau aggregation was then assessed using Gallyas silver impregnation, a staining that specifically detects mature NFTs (Fig. 4D). The hTAUProAggr construct led to the formation of numerous mature argyrophilic NFT-like structures. Those aggregates were also positive for thioflavin S (Supplementary Fig. 2B), another marker of end-stage aggregation. Blind semiquantitative scoring of Gallyas staining revealed strong aggregation in the hTAUProAggr group with no evolution between 1 and 3 months post-injection [Fig. 4D; independent t-test, t(12) = 0.252, P = 0.805]. In contrast, no Gallyas-positive soma could be observed in hTAUWT or control animals (Supplementary Fig. 4).
The nature of tau aggregates produced by the different constructs was then further assessed using sarkosyl extraction of insoluble material (Fig. 5). Western blots using antibodies recognizing N-terminal (M19G) and pathological phosphorylation epitopes (anti-pSer396, AT100) of tau were run on crude hippocampus homogenates, sarkosyl-soluble and sarkosyl-insoluble fractions. They revealed the presence of sarkosyl-insoluble material in both tau groups at 1 and 3 months post-injection (Fig. 5A and B, respectively), characterized by a band at the molecular weight of monomeric tau (just below 60 kDa). However, fibrillar material was more readily detected in hTAUProAggr group compared to the hTAUWT group. Indeed, in the sarkosyl-insoluble fraction of the hTAUProAggr group, all antibodies revealed another band above 60 kDa, representing an abnormal phosphorylated variant of tau. This additional band was the only one stained with AT100 antibody, an epitope mostly found in PHFs (Allen et al., 2002; Augustinack et al., 2002). No form of tau was observed in the utGFP group. Quantification of sarkosyl-soluble and sarkosyl-insoluble fractions in both tau groups confirmed a strong shift toward highly aggregated species in the hTAUProAggr group [Fig. 5C, independent t-tests, t(16) = 7.183, P < 0.001 and t(7) = 4, P < 0.01, respectively, at 1 and 3 months post-injection]. No difference could be observed in total tau (Supplementary Fig. 6).
Figure 5.
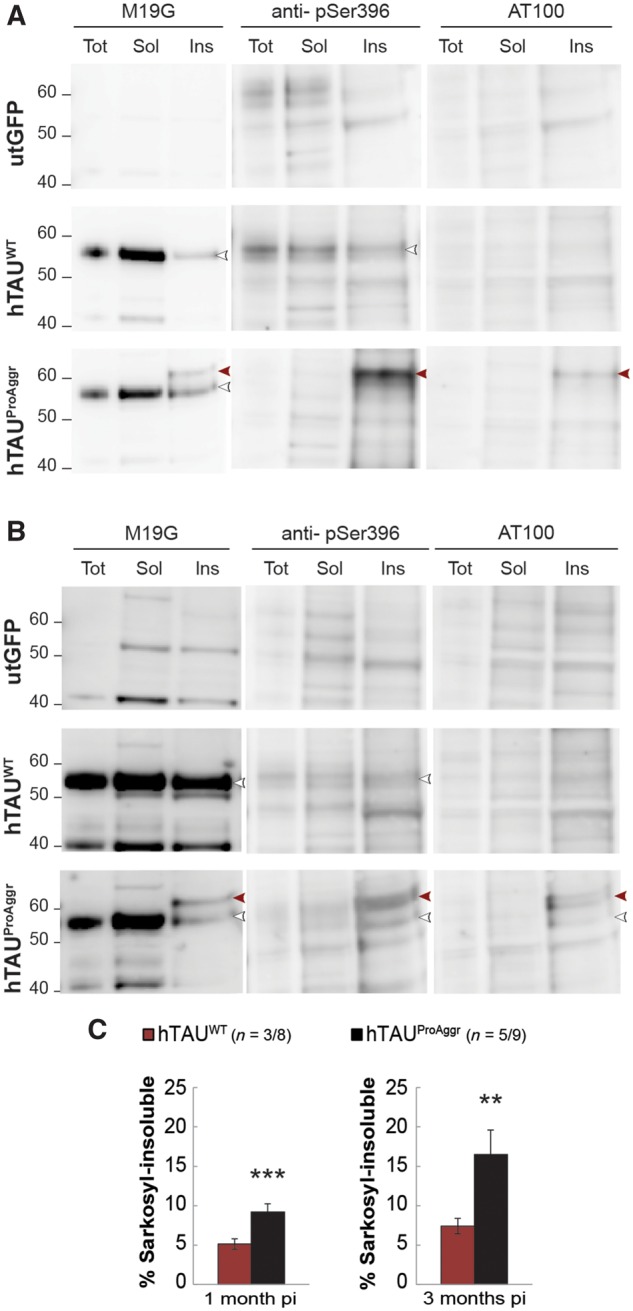
Biochemical characterization reveals variability in the nature of aggregates produced by tau vectors. (A) Western blot 1 month post-injection using M19G detected tau in the sarkosyl-insoluble fraction (Ins) of both hTAUWT and hTAUProAggr groups at the molecular weight of monomeric tau (white arrowhead). A higher band (red arrowhead) was also detected in hTAUProAggr group with M19G, AT100 and anti-pSer396 antibodies. This suggests higher phosphorylation and aggregation in this group. (B) Three months post-injection, western blot of sarkosyl-insoluble fraction using the same antibodies yielded similar results. Tot = total homogenate; Sol = sarkosyl-soluble fraction; Ins = sarkosyl-insoluble fraction. Anti-pSer396 blots were reblotted directly on AT100 blots without stripping of the membrane. Uncropped blots are presented in Supplementary Fig. 5. (C) Quantification of the sarkosyl-insoluble fraction as a percentage of both sarkosyl-soluble and insoluble fractions from western blots revealed with M19G antibody. Asterisks above each bar represent the result of post hoc comparison to controls. **P < 0.01, ***P < 0.001. pi = post-injection.
The toxicity of tau constructs is inversely related to their ability to aggregate
To determine if differential aggregation was associated with differences in the toxicity of tau constructs, stereological counting of CA1/2 pyramidal neurons within the whole hippocampus was performed on NeuN staining (Fig. 6A). A significant reduction in the mean total number of neurons was observed in the hTAUWT (−27%) group at 1 month post-injection when compared to controls [Fig. 6B, one-way ANOVA, F(2, 22) = 10.51, P < 0.001, Bonferroni post hoc test]. Interestingly, the extent of neurodegeneration seemed fairly stable over time in the hTAUWT group [−26% at 3 months post-injection compared to controls, one-way ANOVA, F(2,21) = 10.08, P < 0.001, Bonferroni post hoc test]. Conversely, no significant neuronal loss could be observed at any of the time-points in hTAUProAggr animals. Those observations were confirmed using additional markers of neurodegeneration, including measures of total hippocampus volume and estimation of the volume occupied by CA1/2 pyramidal neurons (Supplementary Fig. 7A and B). More severe neurodegeneration in hTAUWT group was associated with higher levels of total tau into CSF when compared to controls [Fig. 6C, Kruskal-Wallis between groups comparison at each time-point, H(2) = 29.336, P < 0.001 and H(2) = 22.684, P < 0.001 for 1 month and 3 months post-injection, respectively, Bonferroni pairwise multiple comparisons test]. In addition, a negative correlation was observed between AT8 burden and total number of neurons (Fig. 6D, Pearson correlation test R2 = 0.2601, P = 0.077 and R2 = 0.7871, P < 0.001 at 1 and 3 months post-injection, respectively) as well as volumetric measures (Supplementary Fig. 7C). Total tau in the CSF seemed strongly correlated to hippocampal volume (Supplementary Fig. 7D) but failed to correlate with total number of neurons (Fig. 6E; Pearson correlation test, R2 = 0.2967, P = 0.1035).
Figure 6.

Toxicity of tau constructs seems inversely related to their ability to aggregate. (A) Representative images of NeuN staining in all groups showing significant loss (arrows) of CA1 pyramidal neurons in hTAUWT group from 1 month post-injection (pi). Scale bar = 500 µm. (B) Stereological counting of pyramidal neurons in the CA1/2 hippocampal subfields reveals differences in the extent of neuronal loss induced by tau constructs. (C) MSD dosage shows a high level of CSF total tau in hTAUWT animals and, to a lesser extent, in hTAUProAggr group. (D) A strong negative correlation was observed between CA1/2 neurons number and the extent of tau hyperphosphorylation on Ser202/205 (AT8 antibody). (E) A nearly significant correlation could be observed between CSF total tau and neuron numbers. Asterisks above each bar represent the result of post hoc comparison to controls. *P < 0.05, **P < 0.01, ***P < 0.001.
We assessed both microgliosis and astrogliosis in our models using microglial (Iba1, Fig. 7A) and astroglial (vimentin, Fig. 7B) markers, respectively. Microglial activation was observed in both tau groups at 1 month post-injection when compared to controls [Fig. 7C, one-way ANOVA, F(2,24) = 19.438, P < 0.01, Bonferroni post hoc test], with a higher activation observed in hTAUProAggr compared to hTAUWT. At 3 months post-injection, microgliosis almost completely resolved in all groups [one-way ANOVA, F(2,29) = 0.997, P = 0.381]. Activated astrocytes in those two groups were also spatially associated with strong tau overexpression around the injection site (Fig. 7B). Quantification of vimentin staining showed strong astrogliosis in all tau groups while no reactivity could be observed in control animals at any of the time-points observed [Fig. 7D, Kruskal-Wallis between groups comparison at each time-point, H(2) = 13.073, P < 0.01 and H(2) = 15.295, P < 0.001 for 1 month and 3 months post-injection, respectively, Bonferroni pairwise multiple comparisons test]. In addition, astroglial activation was found to persist over time.
Figure 7.

Strong tau expression is closely associated with glial activation. (A) Representative images of Iba1 staining showing microglial activation. Morphological changes are observed with polarization of the processes perpendicular to the lesion site suggesting migration of activated microglia. (B) Representative images of AT8/Vimentin co-labelling showing strong astrocytic reactivity. While vimentin-positive astrocytes are localized close to AT8-positive neurons in the hTAUProAggr group, reactive astrocytes in the hTAUWT group are localized in regions negative for AT8 staining, forming a glial scar at the site where neurons have died. (C) Quantification of the Iba1-positive volume. (D) Quantification of the Vimentin-positive volume showing strong astrogliosis in both tau groups from 1 month post-injection (pi). Scale bars = 100 µm. Asterisks above each bar represent the result of post hoc comparison to controls. *P < 0.05, **P < 0.01, ***P < 0.001.
Discussion
Here we have created a novel model of tauopathy (termed hTAUProAggr) in rats displaying high levels of argyrophilic aggregated tau species in the hippocampus 1 month after injection of AAVs. The versatility of this approach allowed us to compare the neurotoxic effects exerted by fully mature aggregates to the effects of soluble tau species present in the companion hTAUWT model up to 3 months after injection of AAVs. Our data support the current line of thought that soluble forms of tau are highly noxious. In contrast, fibrillary aggregates are fairly innocuous at first and they offer neuroprotection to neighbouring neurons. Further studies on a longer-term will be necessary to draw a definite conclusion about the lack of neurotoxicity of NFTs.
In our study, gene transfer of the human wild-type tau protein in the hTAUWT model led to the induction of an early stage tauopathy. Indeed, in this group a strong hyperphosphorylation of the protein and mislocalization to dendrites and soma were detected with AT8 immunostaining over a large portion of the hippocampus, both being features of an early stage tauopathy. This was accompanied by very limited aggregation, as indicated by a small number of AT100-positive neuronal somas, lack of argyrophilic lesions and little sarkosyl-insoluble material. This was associated to a significant neuronal loss, detectable atrophy of the whole hippocampus, elevated total tau levels in CSF and major astrocytic activation, consistent with most vector-derived models (Jaworski et al., 2009). The precise nature of the soluble toxic species in play here remains elusive. One of our major findings was the very tight negative correlation between tau hyperphosphorylation and CA1/2 neurons number as pathology progresses. This confirms that the pathological hyperphosphorylation of tau on Ser 202/205 is key to tau toxicity. It is in agreement with previous studies that indicated that phosphorylation on Thr212, Thr231 and Ser262 residues causes neurodegeneration (Alonso et al., 2010). It is also consistent with in vitro observations that tau phosphorylation extends the oligomerization phase and delays fibrillation (Kumar et al., 2014; Tepper et al., 2014). In addition, our results indicate that the AT8 epitope may be less accessible in mature tau aggregates since the intensity of AT8 immunolabelling in the hTAUProAggr was reduced compared to that of hTAUWT group. Alternatively, it could be that the reduced phosphorylation on AT8 epitope participated in the increased aggregation observed in the hTAUProAggr group. Further experiments should be performed to determine if tau oligomeric species are involved in the hTAUWT group since a growing body of evidence suggests that they represent the major contributor to tau-induced neuronal and synaptic toxicity (Berger et al., 2007; Lasagna-Reeves et al., 2012a; Kumar et al., 2014; Tai et al., 2014). In addition, soluble hyperphosphorylated tau has been shown to sequester normal tau and to cause microtubule depolymerization, which could also lead to neuronal death (Alonso et al., 1994, 1996, 2006).
In parallel, we developed a novel AAV construct termed hTAUProAggr, based on the co-expression of hTAUWT and a pro-aggregation seed TauRD-ΔK280. TauRD-ΔK280 consists of the four-repeat domain of the tau protein, carrying the ΔK280 mutation. This mutation, responsible for rare cases of frontotemporal dementia (Rizzu et al., 1999), is highly fibrillogenic (Barghorn et al., 2000) and diminishes the ability of tau to promote microtubule assembly (Rizzu et al., 1999). Previous studies showed that in transgenic mice mild overexpression of TauRD-ΔK280 is sufficient to trigger the formation of sarkosyl-insoluble fibrils and Gallyas-positive NFT-like lesions (Mocanu et al., 2008). We reasoned that concomitant co-expression of hTAUWT and TauRD-ΔK280 within the same cell would promote the formation of mature NFTs through the seeding action of TauRD-ΔK280 onto full length hTAUWT. Indeed, from 1 month after vector injection, we detected on histological sections not only hyperphosphorylation of tau on the AT8 epitope and mislocalization to soma and dendrites but also the presence of AT100-positive misfolded tau in neuronal somas and large amounts of Gallyas-positive material, indicative of fully mature NFTs. Biochemical analysis of sarkosyl-insoluble fractions confirmed the presence of hyperphosphorylated fibrillary material. In comparison to the hTAUWT group, total tau in CSF in the hTAUProAggr, was much less increased compared to controls. This observation is reminiscent of the negative relationship detected between CSF amyloid-β and amyloid plaque numbers in Alzheimer’s disease patients. One hypothesis is that, in this hTAUProAggr model, soluble oligomeric tau species are trapped into mature aggregates limiting their release from the parenchyma into the CSF. Microgliosis was transient whereas astrogliosis persisted up to 3 months post-injection. A major finding here was the preservation of neuronal survival in the hippocampus of rats injected with the hTAUProAggr vector compared to the hTAUWT group up to 3 months post-injection. This was supported by normal and stable volume of the whole hippocampus as well as normal stereological counts of NeuN-positive cells. Hence, our data agree with previous studies in tau Drosophila models showing that aggregation of tau into granular tau oligomers (GTOs) was associated with rescue of behavioural deficits and halted neurodegeneration (Ali et al., 2012; Cowan et al., 2015). In addition, not only can tau accumulation be found in morphologically normal neurons (Andorfer et al., 2005; van de Nes et al., 2008; Rocher et al., 2010), but tangle-bearing neurons can be fully integrated into neural networks (Fox et al., 2011; Kuchibhotla et al., 2014; Rudinskiy et al., 2014). Our data obtained in the hTAUProAggr group may seem in contradiction with the severe deleterious effects described in Mandelkow’s ΔK280 transgenic mice (Mocanu et al., 2008; Sydow et al., 2011a, b; Van der jeugd et al., 2012). However, both sets of data could be reconciled. First, one key finding in their transgenic mice was the recruitment of endogenous murine protein with human tau into aggregates. The exact nature of hTAUProAggr NFTs was not assessed in our study so we cannot conclude about a possible inclusion of rat endogenous tau into mature aggregates. However, one possible explanation for the robust neuroprotective effect of hTAUProAggr may be that strong seeding of TauRD-ΔK280 peptide is exerted on hTAUWT instead of on the murine protein, thanks to the locally high 1:1 expression ratio of both. Enhanced aggregation of wild-type human tau would protect from its toxicity. In the same way, TauRD-ΔK280 peptide being trapped into aggregates, it would not be able to exert the deleterious effects reported by others (Sydow et al., 2011a, b; Hochgrafe et al., 2013). In other words, while both hTAUWT and TauRD-ΔK280 may be toxic individually, they counteract each other when present in the same cell by physically interacting with each other. Our finding that argyrophilic NFT-like inclusions in the hTAUProAggr group were associated with overall neuronal preservation further supports the idea that tau inclusions and neurodegeneration are not necessarily synonymous (Santacruz et al., 2005; Spires-Jones et al., 2008; de Calignon et al., 2010). Whether the tau fibrillization process is an active protection mechanism engaged by the cell or solely reflects a conjunction of intracellular conditions favourable to the physical process of aggregation remains to be investigated. Similarly, it is unclear whether neuroprotection of surrounding neurons offered by NFT-bearing neurons comes at their expense. The 50% reduction in AT100-positive cells that we observed in the hTAUProAggr group at 3 months post-injection could indeed suggest a process of degeneration. Further studies should address this issue.
Our study does not evaluate whether NFTs remain innocuous in the long-term, past the 3-month time point. First, it is unknown if such insoluble aggregates would remain or disappear, either through an active clearance mechanism within neurons or via phagocytosis of the NFT-carrying neurons. Our data showing the appearance of AT100-positive ‘astrocyte-like’ cells in areas populated by NFT-carrying neurons as well as sustained vimentin expression suggest an active role of astrocytes that remains to be investigated. Previous studies in various inducible tau transgenic models yielded contrasting outcomes, where several months of transgene suppression resulted in total clearance of NFTs in rTgTauEC mice (Polydoro et al., 2013) whereas tangles persisted in TauRD-ΔK280 mice despite a change in their composition (Sydow et al., 2011a, b; Hochgrafe et al., 2013). More recently, in a cell line with inducible mutant tau expression, tau aggregates were shown to be gradually cleared via the autophagy-lysosome pathway when soluble tau expression was suppressed. Importantly, live imaging of GFP-tagged tau inclusions also demonstrated that these are dynamic structures constantly undergoing fusion and fission events, generating shorter tau species capable of reinstating tau pathology (Guo et al., 2016). Our hTAUProAggr vector provides a suitable tool to address the question of long-term stability and toxicity of large tau aggregates in vivo in the brain.
Tau aggregation is thought to follow a stereotyped progression from soluble monomers to fibrils, through dimers and oligomeric species (Sahara et al., 2007; Patterson et al., 2011). Phenotypic variability observed in our models may thus be determined by an imbalance towards one of those species (Fig. 8). Hence, hTAUWT construct would predominantly produce small and soluble oligomeric species. Overexpression of the hTAUProAggr, on the other hand, would strongly shift the balance towards production of highly insoluble aggregates (either GTOs or NFTs) leading to an initial lack of toxicity. Hence, the differential toxicity of hTAUProAggr and hTAUWT may be associated with differences in the kinetics of aggregation, which may in turn reflect in differential propagation to neighbouring neurons (Fig. 8). Indeed, variants of tau with strong aggregant properties display little propensity to propagate pathology further in the brain (Dujardin et al., 2014). Whether the same tau species are responsible for tau propagation and neurodegeneration still remains to be elucidated (Goedert and Spillantini, 2017). A recent study showed the aggregation process may not be irreversible since in vitro tau inclusions constantly undergo fusion and fission (Guo et al., 2016). This suggests that distinct dissociation rates of NFTs into soluble aggregates could also contribute to the specific toxicity of each tau variant. Recent data in tau transgenic models have shown that at CA3 synapses the ΔK280 mutation, which promotes tau aggregation, reduces synaptic transmission while the A152T mutation, which is associated with little tau aggregation, increases transmission (Sydow et al., 2011b; Van der Jeugd et al., 2012; Decker et al., 2016). To this day, it is not clear whether these effects are mediated through different mechanisms. The pathological cascades involved in our respective models remain to be explored.
Figure 8.
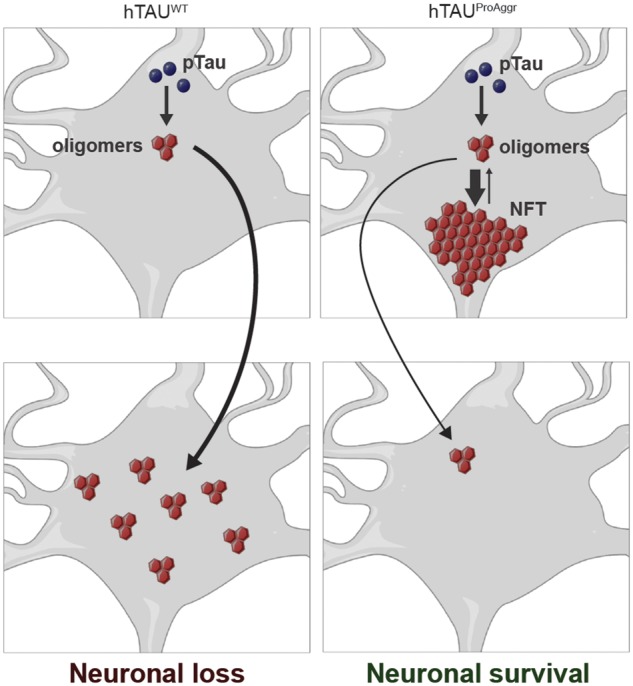
Schematic representation of key results obtained in this study and of our hypothesis on the aggregation-dependent toxicity of tau. While the aggregation of hTAUWT into mainly soluble species (possibly oligomers) is associated with neurodegeneration, its co-expression with TauRD-ΔK280 in the hTAUProAggr group strongly potentiates its aggregation into NFT-like structures leading to overall neuronal preservation. It is unclear whether tangle-bearing neurons are still alive but the difference between hTAUWT and hTAUProAggr in the volume of AT8-positive hippocampus could suggest that aggregation of tau into NFTs could prevent the propagation of small toxic species to neighbouring neurons. Tangle-bearing neurons may die for the benefit of neighbouring neurons.
Altogether, our findings support the hypothesis that soluble tau species are key players in tau-induced neurodegeneration. They suggest that soluble tau species rather than fully mature aggregates should be targeted at an early stage in patients. Our analyses show that NFT numbers imperfectly reflect the severity of the disease whereas AT8 pathology may be a better index of neurodegeneration. Admittedly, developing therapeutic and imaging agents capable of targeting tau soluble forms may prove challenging, especially when the exact nature of these toxic forms (dimers, trimers, etc.) is still unclear and may differ from one tauopathy to another. Our gene transfer-based models in rats should prove useful in the future to study mechanisms underlying the toxicity of various tau species in vivo. They also offer the possibility to test a variety of therapeutic strategies and to use various imaging modalities either in hTAUWT rats expressing high amount of toxic soluble tau species or in hTAUProAggr rats with numerous fully mature NFTs.
Supplementary Material
Acknowledgements
The authors thank Caroline Jan, Sueva Bernier (MIRCen), Beate Aschauer (Ludwig-Maximilians-University, Munich, Germany), Chantal Bourrier (Institut de Recherche Servier, France), Raphaelle Caillierez (Université Lille 2, France) for skilful technical advice and assistance and Jason Edamoore for proofreading this manuscript.
Funding
This work benefited from support of the national ‘Infrastructure de recherche’ NeurATRIS and from the department of Neuropsychiatry of Servier Laboratories (Croissy sur Seine, France).
Conflict of interest
D.C., M.G.-G., F.P. and E.D. are full-time employees of Servier and have no other interests to declare. C.S. serves as a paid consultant for and receives benefit from MBF Bioscience, the manufacturer and distributor of the stereology software, StereoInvestigator. However, MBF Bioscience had no any role in study design, data collection and analysis, decision to publish, or preparation of the manuscript. Furthermore, C.S. has not received any honoraria or consultancy fee in writing this manuscript.
Supplementary material
Supplementary material is available at Brain online.
Glossary
Abbreviations
- AAV
adeno-associated virus
- hTAUProAggr
human pro-aggregation chimeric tau
- hTAUWT
human wild-type tau
- NFT
neurofibrillary tangle
- PHF
paired helical filament
- TauRD-ΔK280
tau repeats-domain carrying ΔK280 mutation
References
- Ali YO, Ruan K, Zhai RG. NMNAT suppresses tau-induced neurodegeneration by promoting clearance of hyperphosphorylated tau oligomers in a Drosophila model of tauopathy. Hum Mol Genet 2012; 21: 237–50. [DOI] [PMC free article] [PubMed] [Google Scholar]
- Allen B, Ingram E, Takao M, Smith MJ, Jakes R, Virdee K, et al. Abundant tau filaments and nonapoptotic neurodegeneration in transgenic mice expressing human P301S tau protein. J Neurosci 2002; 22: 9340–51. [DOI] [PMC free article] [PubMed] [Google Scholar]
- Alonso AC, Grundke-Iqbal I, Iqbal K. Alzheimer's disease hyperphosphorylated tau sequesters normal tau into tangles of filaments and disassembles microtubules. Nat Med 1996; 2: 783–7. [DOI] [PubMed] [Google Scholar]
- Alonso AC, Zaidi T, Grundke-Iqbal I, Iqbal K. Role of abnormally phosphorylated tau in the breakdown of microtubules in Alzheimer disease. Proc Natl Acad Sci USA 1994; 91: 5562–6. [DOI] [PMC free article] [PubMed] [Google Scholar]
- Alonso AD, Di Clerico J, Li B, Corbo CP, Alaniz ME, Grundke-Iqbal I, et al. Phosphorylation of tau at Thr212, Thr231, and Ser262 combined causes neurodegeneration. J Biol Chem 2010; 285: 30851–60. [DOI] [PMC free article] [PubMed] [Google Scholar]
- Alonso Adel C, Li B, Grundke-Iqbal I, Iqbal K. Polymerization of hyperphosphorylated tau into filaments eliminates its inhibitory activity. Proc Natl Acad Sci USA 2006; 103: 8864–9. [DOI] [PMC free article] [PubMed] [Google Scholar]
- Andorfer C, Acker CM, Kress Y, Hof PR, Duff K, Davies P. Cell-cycle reentry and cell death in transgenic mice expressing nonmutant human tau isoforms. J Neurosci 2005; 25: 5446–54. [DOI] [PMC free article] [PubMed] [Google Scholar]
- Augustinack JC, Schneider A, Mandelkow EM, Hyman BT. Specific tau phosphorylation sites correlate with severity of neuronal cytopathology in Alzheimer's disease. Acta Neuropathol 2002; 103: 26–35. [DOI] [PubMed] [Google Scholar]
- Barghorn S, Zheng-Fischhofer Q, Ackmann M, Biernat J, von Bergen M, Mandelkow EM, et al. Structure, microtubule interactions, and paired helical filament aggregation by tau mutants of frontotemporal dementias. Biochemistry 2000; 39: 11714–21. [DOI] [PubMed] [Google Scholar]
- Berger A, Lorain S, Josephine C, Desrosiers M, Peccate C, Voit T, et al. Repair of rhodopsin mRNA by spliceosome-mediated RNA trans-splicing: a new approach for autosomal dominant retinitis pigmentosa. Mol Ther 2015; 23: 918–30. [DOI] [PMC free article] [PubMed] [Google Scholar]
- Berger Z, Roder H, Hanna A, Carlson A, Rangachari V, Yue M, et al. Accumulation of pathological tau species and memory loss in a conditional model of tauopathy. J Neurosci 2007; 27: 3650–62. [DOI] [PMC free article] [PubMed] [Google Scholar]
- Braak H, Braak E. Neuropathological stageing of Alzheimer-related changes. Acta Neuropathol 1991; 82: 239–59. [DOI] [PubMed] [Google Scholar]
- Caillierez R, Begard S, Lecolle K, Deramecourt V, Zommer N, Dujardin S, et al. Lentiviral delivery of the human wild-type tau protein mediates a slow and progressive neurodegenerative tau pathology in the rat brain. Mol Ther 2013; 21: 1358–68. [DOI] [PMC free article] [PubMed] [Google Scholar]
- Cowan CM, Quraishe S, Hands S, Sealey M, Mahajan S, Allan DW, et al. Rescue from tau-induced neuronal dysfunction produces insoluble tau oligomers. Sci Rep 2015; 5: 17191. [DOI] [PMC free article] [PubMed] [Google Scholar]
- de Calignon A, Fox LM, Pitstick R, Carlson GA, Bacskai BJ, Spires-Jones TL, et al. Caspase activation precedes and leads to tangles. Nature 2010; 464: 1201–4. [DOI] [PMC free article] [PubMed] [Google Scholar]
- Decker JM, Kruger L, Sydow A, Dennissen FJ, Siskova Z, Mandelkow E, et al. The Tau/A152T mutation, a risk factor for frontotemporal-spectrum disorders, leads to NR2B receptor-mediated excitotoxicity. EMBO Rep 2016; 17: 552–69. [DOI] [PMC free article] [PubMed] [Google Scholar]
- Dickson DW, Crystal HA, Bevona C, Honer W, Vincent I, Davies P. Correlations of synaptic and pathological markers with cognition of the elderly. Neurobiol Aging 1995; 16: 285–98; discussion 98–304. [DOI] [PubMed] [Google Scholar]
- Dujardin S, Lecolle K, Caillierez R, Begard S, Zommer N, Lachaud C, et al. Neuron-to-neuron wild-type Tau protein transfer through a trans-synaptic mechanism: relevance to sporadic tauopathies. Acta Neuropathol Commun 2014; 2: 14. [DOI] [PMC free article] [PubMed] [Google Scholar]
- Fa M, Puzzo D, Piacentini R, Staniszewski A, Zhang H, Baltrons MA, et al. Extracellular Tau oligomers produce an immediate impairment of LTP and memory. Sci Rep 2016; 6: 19393. [DOI] [PMC free article] [PubMed] [Google Scholar]
- Fox LM, William CM, Adamowicz DH, Pitstick R, Carlson GA, Spires-Jones TL, et al. Soluble tau species, not neurofibrillary aggregates, disrupt neural system integration in a tau transgenic model. J Neuropathol Exp Neurol 2011; 70: 588–95. [DOI] [PMC free article] [PubMed] [Google Scholar]
- Giannakopoulos P, Herrmann FR, Bussiere T, Bouras C, Kovari E, Perl DP, et al. Tangle and neuron numbers, but not amyloid load, predict cognitive status in Alzheimer's disease. Neurology 2003; 60: 1495–500. [DOI] [PubMed] [Google Scholar]
- Goedert M, Spillantini MG. Propagation of Tau aggregates. Mol Brain 2017; 10: 18. [DOI] [PMC free article] [PubMed] [Google Scholar]
- Gomez-Isla T, Hollister R, West H, Mui S, Growdon JH, Petersen RC, et al. Neuronal loss correlates with but exceeds neurofibrillary tangles in Alzheimer's disease. Ann Neurol 1997; 41: 17–24. [DOI] [PubMed] [Google Scholar]
- Grundke-Iqbal I, Iqbal K, Tung YC, Quinlan M, Wisniewski HM, Binder LI. Abnormal phosphorylation of the microtubule-associated protein tau (tau) in Alzheimer cytoskeletal pathology. Proc Natl Acad Sci USA 1986; 83: 4913–17. [DOI] [PMC free article] [PubMed] [Google Scholar]
- Guo JL, Buist A, Soares A, Callaerts K, Calafate S, Stevenaert F, et al. The dynamics and turnover of Tau aggregates in cultured cells: INSIGHTS INTO THERAPIES FOR TAUOPATHIES. J Biol Chem 2016; 291: 13175–93. [DOI] [PMC free article] [PubMed] [Google Scholar]
- Hochgrafe K, Sydow A, Mandelkow EM. Regulatable transgenic mouse models of Alzheimer disease: onset, reversibility and spreading of Tau pathology. FEBS J 2013; 280: 4371–81. [DOI] [PubMed] [Google Scholar]
- Jaworski T, Dewachter I, Lechat B, Croes S, Termont A, Demedts D, et al. AAV-tau mediates pyramidal neurodegeneration by cell-cycle re-entry without neurofibrillary tangle formation in wild-type mice. PLoS One 2009; 4: e7280. [DOI] [PMC free article] [PubMed] [Google Scholar]
- Klein RL, Dayton RD, Leidenheimer NJ, Jansen K, Golde TE, Zweig RM. Efficient neuronal gene transfer with AAV8 leads to neurotoxic levels of tau or green fluorescent proteins. Mol Ther 2006; 13: 517–27. [DOI] [PMC free article] [PubMed] [Google Scholar]
- Kuchibhotla KV, Wegmann S, Kopeikina KJ, Hawkes J, Rudinskiy N, Andermann ML, et al. Neurofibrillary tangle-bearing neurons are functionally integrated in cortical circuits in vivo. Proc Natl Acad Sci USA 2014; 111: 510–14. [DOI] [PMC free article] [PubMed] [Google Scholar]
- Kumar S, Tepper K, Kaniyappan S, Biernat J, Wegmann S, Mandelkow EM, et al. Stages and conformations of the Tau repeat domain during aggregation and its effect on neuronal toxicity. J Biol Chem 2014; 289: 20318–32. [DOI] [PMC free article] [PubMed] [Google Scholar]
- Lasagna-Reeves CA, Castillo-Carranza DL, Sengupta U, Clos AL, Jackson GR, Kayed R. Tau oligomers impair memory and induce synaptic and mitochondrial dysfunction in wild-type mice. Mol Neurodegener 2011; 6: 39. [DOI] [PMC free article] [PubMed] [Google Scholar]
- Lasagna-Reeves CA, Castillo-Carranza DL, Sengupta U, Guerrero-Munoz MJ, Kiritoshi T, Neugebauer V, et al. Alzheimer brain-derived tau oligomers propagate pathology from endogenous tau. Sci Rep 2012a; 2: 700. [DOI] [PMC free article] [PubMed] [Google Scholar]
- Lasagna-Reeves CA, Castillo-Carranza DL, Sengupta U, Sarmiento J, Troncoso J, Jackson GR, et al. Identification of oligomers at early stages of tau aggregation in Alzheimer's disease. FASEB J 2012b; 26: 1946–59. [DOI] [PMC free article] [PubMed] [Google Scholar]
- Mocanu MM, Nissen A, Eckermann K, Khlistunova I, Biernat J, Drexler D, et al. The potential for beta-structure in the repeat domain of tau protein determines aggregation, synaptic decay, neuronal loss, and coassembly with endogenous Tau in inducible mouse models of tauopathy. J Neurosci 2008; 28: 737–48. [DOI] [PMC free article] [PubMed] [Google Scholar]
- Morsch R, Simon W, Coleman PD. Neurons may live for decades with neurofibrillary tangles. J Neuropathol Exp Neurol 1999; 58: 188–97. [DOI] [PubMed] [Google Scholar]
- Patterson KR, Remmers C, Fu Y, Brooker S, Kanaan NM, Vana L, et al. Characterization of prefibrillar Tau oligomers in vitro and in Alzheimer disease. J Biol Chem 2011; 286: 23063–76. [DOI] [PMC free article] [PubMed] [Google Scholar]
- Paxinos G, Watson C. The rat brain in stereotaxic coordinates. 4th edn. New York, NY: Academic Press; 1998. [Google Scholar]
- Polydoro M, de Calignon A, Suarez-Calvet M, Sanchez L, Kay KR, Nicholls SB, et al. Reversal of neurofibrillary tangles and tau-associated phenotype in the rTgTauEC model of early Alzheimer's disease. J Neurosci 2013; 33: 13300–11. [DOI] [PMC free article] [PubMed] [Google Scholar]
- Rizzu P, Van Swieten JC, Joosse M, Hasegawa M, Stevens M, Tibben A, et al. High prevalence of mutations in the microtubule-associated protein tau in a population study of frontotemporal dementia in the Netherlands. Am J Hum Genet 1999; 64: 414–21. [DOI] [PMC free article] [PubMed] [Google Scholar]
- Rocher AB, Crimins JL, Amatrudo JM, Kinson MS, Todd-Brown MA, Lewis J, et al. Structural and functional changes in tau mutant mice neurons are not linked to the presence of NFTs. Exp Neurol 2010; 223: 385–93. [DOI] [PMC free article] [PubMed] [Google Scholar]
- Rudinskiy N, Hawkes JM, Wegmann S, Kuchibhotla KV, Muzikansky A, Betensky RA, et al. Tau pathology does not affect experience-driven single-neuron and network-wide Arc/Arg3.1 responses. Acta Neuropathol Commun 2014; 2: 63. [DOI] [PMC free article] [PubMed] [Google Scholar]
- Sahara N, Maeda S, Murayama M, Suzuki T, Dohmae N, Yen SH, et al. Assembly of two distinct dimers and higher-order oligomers from full-length tau. Eur J Neurosci 2007; 25: 3020–9. [DOI] [PubMed] [Google Scholar]
- Santacruz K, Lewis J, Spires T, Paulson J, Kotilinek L, Ingelsson M, et al. Tau suppression in a neurodegenerative mouse model improves memory function. Science 2005; 309: 476–81. [DOI] [PMC free article] [PubMed] [Google Scholar]
- Schmitz C. Variation of fractionator estimates and its prediction. Anat Embryol 1998; 198: 371–97. [DOI] [PubMed] [Google Scholar]
- Schmitz C, Hof PR. Design-based stereology in neuroscience. Neuroscience 2005; 130: 813–31. [DOI] [PubMed] [Google Scholar]
- Simic G, Babic Leko M, Wray S, Harrington C, Delalle I, Jovanov-Milosevic N, et al. Tau protein hyperphosphorylation and aggregation in Alzheimer's disease and other tauopathies, and possible neuroprotective strategies. Biomolecules 2016; 6: 6. [DOI] [PMC free article] [PubMed] [Google Scholar]
- Spires-Jones TL, de Calignon A, Matsui T, Zehr C, Pitstick R, Wu HY, et al. In vivo imaging reveals dissociation between caspase activation and acute neuronal death in tangle-bearing neurons. J Neurosci 2008; 28: 862–7. [DOI] [PMC free article] [PubMed] [Google Scholar]
- Spires TL, Orne JD, SantaCruz K, Pitstick R, Carlson GA, Ashe KH, et al. Region-specific dissociation of neuronal loss and neurofibrillary pathology in a mouse model of tauopathy. Am J Pathol 2006; 168: 1598–607. [DOI] [PMC free article] [PubMed] [Google Scholar]
- Sydow A, Van der Jeugd A, Zheng F, Ahmed T, Balschun D, Petrova O, et al. Reversibility of Tau-related cognitive defects in a regulatable FTD mouse model. J Mol Neurosci 2011a; 45: 432–7. [DOI] [PubMed] [Google Scholar]
- Sydow A, Van der Jeugd A, Zheng F, Ahmed T, Balschun D, Petrova O, et al. Tau-induced defects in synaptic plasticity, learning, and memory are reversible in transgenic mice after switching off the toxic Tau mutant. J Neurosci 2011b; 31: 2511–25. [DOI] [PMC free article] [PubMed] [Google Scholar]
- Tai HC, Wang BY, Serrano-Pozo A, Frosch MP, Spires-Jones TL, Hyman BT. Frequent and symmetric deposition of misfolded tau oligomers within presynaptic and postsynaptic terminals in Alzheimer's disease. Acta Neuropathol Commun 2014; 2: 146. [DOI] [PMC free article] [PubMed] [Google Scholar]
- Tepper K, Biernat J, Kumar S, Wegmann S, Timm T, Hubschmann S, et al. Oligomer formation of tau protein hyperphosphorylated in cells. J Biol Chem 2014; 289: 34389–407. [DOI] [PMC free article] [PubMed] [Google Scholar]
- van de Nes JA, Nafe R, Schlote W. Non-tau based neuronal degeneration in Alzheimer's disease – an immunocytochemical and quantitative study in the supragranular layers of the middle temporal neocortex. Brain Res 2008; 1213: 152–65. [DOI] [PubMed] [Google Scholar]
- Van der Jeugd A, Hochgrafe K, Ahmed T, Decker JM, Sydow A, Hofmann A, et al. Cognitive defects are reversible in inducible mice expressing pro-aggregant full-length human Tau. Acta Neuropathol 2012; 123: 787–805. [DOI] [PMC free article] [PubMed] [Google Scholar]
- Vogt BA, Vogt LJ, Vrana KE, Gioia L, Meadows RS, Challa VR, et al. Multivariate analysis of laminar patterns of neurodegeneration in posterior cingulate cortex in Alzheimer's disease. Exp Neurol 1998; 153: 8–22. [DOI] [PubMed] [Google Scholar]
- Weller RO. Greenfield's neuropathology. 8th edn. London, UK: Hodder Arnold; 2008. [Google Scholar]
Associated Data
This section collects any data citations, data availability statements, or supplementary materials included in this article.