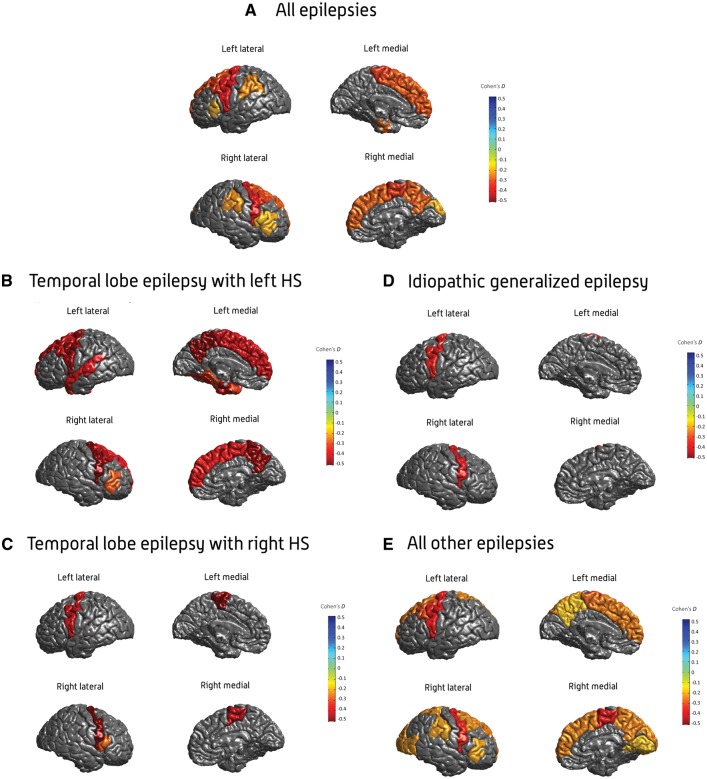
Figure 3.
Cortical thickness findings. Cohen’s d effect size estimates for case-control differences in cortical thickness, across the (A) all-epilepsies, (B) mesial temporal lobe epilepsies with left hippocampal sclerosis (MTLE-L), (C) mesial temporal lobe epilepsies with right hippocampal sclerosis (MTLE-R), (D) idiopathic generalized epilepsies (IGE), and (E) all-other-epilepsies groups. Cohen’s d effect sizes were extracted using multiple linear regressions, and pooled across research centres using random-effects meta-analysis. Cortical structures with P-values < 1.49 × 10⁻⁴ are shown in heatmap colours; strength of heat map is determined by the size of the Cohen’s d (d < 0 = blue, d > 0 = yellow/red). Image generated using MATLAB with annotations added using Adobe Photoshop. An interactive version of this figure is available online, via ‘ENIGMA-Viewer’: http://enigma-viewer.org/ENIGMA_epilepsy_cortical.html. See Supplementary material for guidelines on how to use the interactive visualization. HS = hippocampal sclerosis.

