

Abstract
Aims
The association of low endothelial shear stress (ESS) with high-risk plaque (HRP) has not been thoroughly investigated in humans. We investigated the local ESS and lumen remodelling patterns in HRPs using optical coherence tomography (OCT), developed the shear stress score, and explored its association with the prevalence of HRPs and clinical outcomes.
Methods and results
A total of 35 coronary arteries from 30 patients with stable angina or acute coronary syndrome (ACS) were reconstructed with three dimensional (3D) OCT. ESS was calculated using computational fluid dynamics and classified into low, moderate, and high in 3-mm-long subsegments. In each subsegment, (i) fibroatheromas (FAs) were classified into HRPs and non-HRPs based on fibrous cap (FC) thickness and lipid pool size, and (ii) lumen remodelling was classified into constrictive, compensatory, and expansive. In each artery the shear stress score was calculated as metric of the extent and severity of low ESS. FAs in low ESS subsegments had thinner FC compared with high ESS (89 ± 84 vs.138 ± 83 µm, P < 0.05). Low ESS subsegments predominantly co-localized with HRPs vs. non-HRPs (29 vs. 9%, P < 0.05) and high ESS subsegments predominantly with non-HRPs (9 vs. 24%, P < 0.05). Compensatory and expansive lumen remodelling were the predominant responses within subsegments with low ESS and HRPs. In non-stenotic FAs, low ESS was associated with HRPs vs. non-HRPs (29 vs. 3%, P < 0.05). Arteries with increased shear stress score had increased frequency of HRPs and were associated with ACS vs. stable angina.
Conclusion
Local low ESS and expansive lumen remodelling are associated with HRP. Arteries with increased shear stress score have increased frequency of HRPs and propensity to present with ACS.
Keywords: coronary artery disease, optical coherence tomography, high-risk plaque, endothelial shear stress, shear stress score, vascular remodelling, clinical events
Introduction
The natural history of atherosclerosis is a complex and dynamic process determined by a variety of local and systemic biological and biomechanical factors.1–3 Endothelial shear stress (ESS), the tangential force due to the friction of flowing blood on the endothelial cell surface, is a major local biomechanical factor that plays a key role in the natural history of atherosclerosis. Animal studies demonstrated the pathobiologic implication of ESS in plaque inflammation and vascular remodelling.4–7 In humans, clinical studies utilized intravascular ultrasound (IVUS) and provided insights into the implication of ESS and vascular remodelling in anatomic plaque progression.8–10
Combined assessment of local ESS, vascular remodelling, and inflammation may have incremental value in predicting the local and global risk of an individual coronary artery.11 Although these concepts have been successfully tested in animal models, human data have been limited mainly due to the difficulty in assessing plaque inflammation in vivo.4,6 However, the advent of optical coherence tomography (OCT) that allows for high-resolution ‘histology-like’ imaging of fibrous cap (FC), lipid pool (LP), and occasionally macrophages,12,13 and the development of new OCT-based technologies that enabled accurate three dimensional (3D) reconstruction of coronary arteries (3D OCT)13 provide unique opportunities of functional and morphologic plaque assessment towards the identification of high-risk plaque.
In this cross-sectional pilot clinical study, we used 3D OCT in coronary arteries to (i) investigate the association of local low ESS with high-risk plaque by OCT; (ii) characterize the ESS microenvironment and lumen remodelling response in high-risk vs. non high-risk plaques; (iii) introduce the arterial shear stress score, a novel and global metric of the extent and severity of low ESS in coronary arteries; (iv) investigate the association of shear stress score with the prevalence of high-risk plaque; and (v) investigate the association of shear stress score with clinical events.
Methods
Study population
The characteristics of the study population are presented in Table 1. About 30% of the patients (n = 9) referred for coronary angiogram due to stable angina and 70% (n = 21) due to an acute coronary syndrome (ACS). All study subjects underwent clinically indicated cardiac catheterization and coronary angiography followed by intracoronary imaging with OCT. In all cases, coronary imaging preceded percutaneous intervention if any. In patients with ST-elevation myocardial infarction, OCT was performed after recanalization and before percutaneous intervention. Patients were followed up for clinical events for 24 months on average. The study was approved by the local Institutional Ethics Committee, and all study subjects provided written informed consent for their participation.
Table 1.
Study population characteristics (n = 30 patients)
| Gender (male) | 21 (70%) |
| Age (years) | 63.3 ± 9.3 |
| Risk factors | |
| Smoking | 13 (43%) |
| Hypertension | 25 (83%) |
| Hyperlipidaemia | 23 (77%) |
| Diabetes mellitus | 11 (37%) |
| Family history | 17 (57%) |
| History | |
| Prior myocardial infarction | 7 (23%) |
| Prior stenting | 9 (30%) |
| Stroke | 0 (0%) |
| Clinical presentation | |
| Stable angina | 9 (30%) |
| Unstable angina | 10 (33%) |
| Non-STEMI | 5 (17%) |
| STEMI | 6 (20%) |
| Medications | |
| Aspirin | 29 (97%) |
| Statins | 29 (97%) |
| Beta-blockers | 22 (73%) |
| Angiotensin receptor blockers | 14 (47%) |
| ACE inhibitors | 11 (37%) |
| Calcium channel blockers | 8 (27%) |
| Lipids | |
| Total cholesterol, mg/dL | 193 ± 41 |
| LDL-C, mg/dL | 118 ± 36 |
| HDL-C, mg/dL | 41 ± 12 |
| Triglycerides, mg/dL | 142 ± 59 |
Three-dimensional. reconstruction of coronary arteries using geometrically correct 3D OCT
The coronary arteries were reconstructed using 3D OCT, as previously described and validated (Figure 1A–D and the Supplementary data online).14–16
Figure 1.

Representative 3D reconstructed left circumflex artery segment. (A) Left anterior oblique (LAO) angiographic plane. (B) Right anterior oblique (RAO) angiographic plane; yellow arrows denote the start and end of the reconstructed segment. (C) OCT run in longitudinal view. (D) 3D reconstructed segment based on the fusion of two angiographic planes and OCT. (E) ESS distribution in the 3D reconstructed segment. (F) 2D map of ESS along the reconstructed segment with y-axis corresponding to the vessel circumference and x-axis to the vessel length. Note the plaque type, ESS and lumen remodelling heterogeneity along the same segment. Dashed lines correspond to the middle of 3-mm-long subsegments of interest. In subsegments I, III, and V, there is colocalization of low ESS, expansive/compensatory lumen remodelling, and TCFA (III and V are mixed plaques with thin FC). Subsegment II contains a TCFA (mixed plaque with thin FC) in high ESS environment with constrictive lumen remodelling. Subsegment IV contains a ThCFA (mixed plaque with thick FC) in high ESS environment with associated constrictive lumen remodelling.
Subsegments of interest
Each 3D reconstructed artery was divided into consecutive 3-mm-long subsegments starting from the proximal to the distal end as described in detail in the Supplementary data online.
ESS calculation and classification
ESS was calculated in the reconstructed arteries using a commercially available computational fluid dynamics software (Fluent 14.5, ANSYS, Inc., PA, USA) as previously described (Figure 1E and the Supplementary data online).9,14,15
The ESS distribution of each artery was reformatted to a 2D surface map with the artery length (mm) in the x-axis and the artery circumference (degrees) in the y-axis using a purpose-built algorithm developed in Matlab (Matlab R2013a, Mathworks, Natick, MA, USA) (Figure 1F). To account for the ESS heterogeneity across different arteries, the average ESS was calculated in each subsegment of interest and classified into low, moderate, and high based on the frequency distribution of ESS values in each artery: (i) low ESS subsegment if average ESS was ≤25th percentile of the frequency distribution, (ii) moderate ESS subsegment if average ESS was between 25th and 75th percentiles of the frequency distribution, and (iii) high ESS subsegment if average ESS was ≥75th percentile of the frequency distribution. Of note, there was minimal circumferential and longitudinal ESS heterogeneity within the 3-mm-long subsegments of interest (Supplementary data online, Figures S1 and S2).
Plaque morphologic characteristics and categories
In each subsegment of interest, one representative OCT frame corresponding to the middle of the 3-mm-long subsegment of interest was identified. Three interventional cardiologists with expertise in OCT interpretation who were blinded to each other analysed the OCT frames. In cases of discordant measurements, a consensus was made. As previously described, each reader measured the FC thickness at the thinnest part, as well as the arc subtended by the LP using the centre of the lumen as reference.12,13
The OCT frames were further classified as normal, intimal thickening, and fibroatheromas (FAs) based on a previously described consensus classification (Figure 2).12,13,17 Normal vessel wall was characterized by normal layered architecture. Intimal thickening (also known as fibrous plaques with external elastic lamina) was defined as thickening of the intima without FC or LP and a well-defined external elastic lamina. FAs were characterized by the presence of FC and LP13,17 and were further subcategorized into early fibroatheromas (EFA), thin cap fibroatheromas (TCFA), and thick cap fibroatheromas (ThCFA). EFA were defined as plaques with FC and LP and poor-defined external elastic lamina. TCFA were defined as plaques with a thin FC (≤65 µm) overlying a lipid-rich necrotic core with arc ≥ 90° and ThCFA as plaques with thick FC (>65 mm) overlying a lipid-rich necrotic core with arc ≥ 90°. Mixed plaques were included in the FAs, and the FC thickness and LP size were measured in the non-calcific area. Purely calcific plaques and stented arterial segments were excluded from the study.
Figure 2.

Plaque classification by OCT based on consensus documents.12,13,17 IT, intimal thickening (white arrows denote well-defined external elastic membrane). EFA, early fibroatheroma (yellow arrows denote poor-defined external elastic membrane). TCFA, thin cap fibroatheroma (asterisks denote lipid core). ThCFA, thick cap fibroatheroma (asterisks denote lipid core).
Lumen stenosis and lumen remodelling
To assess the degree of lumen stenosis and lumen remodelling response to plaque, we calculated the global lumen remodelling of each vessel, using a modification of a methodology that was previously described with IVUS4–6,18 (Supplementary data online, Figure S3). The lumen remodelling methodology applied in the current OCT study was compared with the IVUS-derived vascular remodelling methodology in a subset of 10 arteries, yielding adequate agreement (Supplementary data online, Figure S4). Three local lumen remodelling patterns were identified: (i) constrictive remodelling if the actual lumen was <−20% of the expected lumen, (ii) compensatory remodelling if the actual lumen was between −20 and +20% of the expected lumen, and (iii) expansive remodelling if the actual lumen was ≥+20% of the expected lumen.
Shear stress score
To assess the extent and severity of low ESS in the diseased parts of each coronary artery, we developed the arterial shear stress score, which is further presented in Supplementary data online, Figure S5. Overall, the shear stress score was a metric of the portion of the artery with the lowest ESS. The lower the average ESS in a given artery and the larger the surface of the artery with that low ESS, the larger the shear stress score.
Inter- and intra-observer agreements
The inter-observer agreement of assessing FC thickness, LP size, and plaque category was assessed from reads by two independent experts in a representative sample of 50 randomly selected OCT frames. Similarly, intra-observer agreement was assessed in the same sample of 50 frames from a second read performed by the first expert 1 month later.
Statistical analysis
Statistical analyses were performed with IBM SPSS Statistics 21.0 (IBM Corp., New York, NY, USA) and GraphPad Prism 6.0 (GraphPad, Inc., San Diego, CA, USA). All results were expressed as mean ± standard error of mean (SEM) for continuous variables and as absolute counts and percentages (%) for categorical variables. Association of continuous variables with categorical ones was investigated using mixed-effects analysis of variance (ANOVA) with the patient and artery designated as random effects. Statistical significance for multiple comparisons was adjusted using the Scheffé method. The association of categorical variables was calculated with χ2 analysis. Inter- and intra-observer agreements were assessed with Pearson's correlation coefficient, linear regression analysis, Bland–Altman analysis, and Cohen's kappa analysis. A two-sided P value of ≤0.05 was considered significant.
Results
Three-dimensional reconstruction and ESS calculation were successfully performed in all arteries. The mean length of the reconstructed vessels was 37.8 ± 1.7 mm ranging from 17.5 to 53.4 mm. In total, 418 3-mm-long subsegments of interest were included in the analysis, of which 63 (15.1%) were categorized as normal, 55 (13.2%) as IT, 214 (51.2%) as FAs [n = 36 (8.6%) EFA, n = 89 (21.3%) TCFA, n = 89 (21.3%) ThCFA], 12 (2.9%) as purely calcific plaques, and 74 (17.7%) as stented areas. Purely calcific plaques and stented areas were excluded from further analyses.
Association of ESS with high-risk plaque features
There were 55 (16.6%) subsegments with low ESS, 230 (69.3%) subsegments with moderate ESS, and 47 (14.1%) subsegments with high ESS. As shown in Table 2, FAs in low or moderate ESS subsegments had significantly thinner FC compared with high ESS subsegments. LP size was comparable across all three ESS categories.
Table 2.
FC thickness and LP size across ESS categories (n = 214 FAs)
| Low ESS (n = 43) | Moderate ESS (n = 130) | High ESS (n = 41) | |
|---|---|---|---|
| FC thickness (µm) | 89 ± 84* | 119 ± 84* | 138 ± 83 |
| LP size (°) | 204 ± 88** | 213 ± 83 | 224 ± 86 |
Values represent mean ± SEM.
*For FC thickness: P = 0.02 for low vs. high ESS and P = 0.05 for moderate vs. high ESS.
**For LP size: P < 0.01 for low vs. moderate ESS.
Association of ESS with plaque category
As shown in Table 3, TCFA had significantly thinner FC and larger LP than EFA and ThCFA. Of note, EFA had the thickest FC and the smallest LP across plaque categories consistent with the early stage of this type of plaque. In low ESS subsegments, the prevalence of TCFA was three times higher than ThCFA (18 vs. 5%), whereas in high ESS subsegments the proportion of ThCFA was three-fold higher compared with TCFA (Figure 3). Figures 1F and 3A–C show representative examples where TCFA predominantly co-localized with low ESS and ThCFA co-localized with high ESS subsegments. The figures also show the heterogeneity of local ESS patterns and plaque categories within the same arterial segments.
Table 3.
FC thickness and LP size across FA categories (n = 214)
| EFA (n = 36) | TCFA (n = 89) | ThCFA (n = 89) | |
|---|---|---|---|
| FC thickness (µm) | 213 ± 105* | 46 ± 16* | 147 ± 54* |
| LP size (°) | 182 ± 70 | 246 ± 85** | 194 ± 79 |
Values represent mean ± SEM.
*P < 0.001 for all comparisons.
**P < 0.001 for TCFA vs. EFA and TCFA vs. ThCFA.
Figure 3.
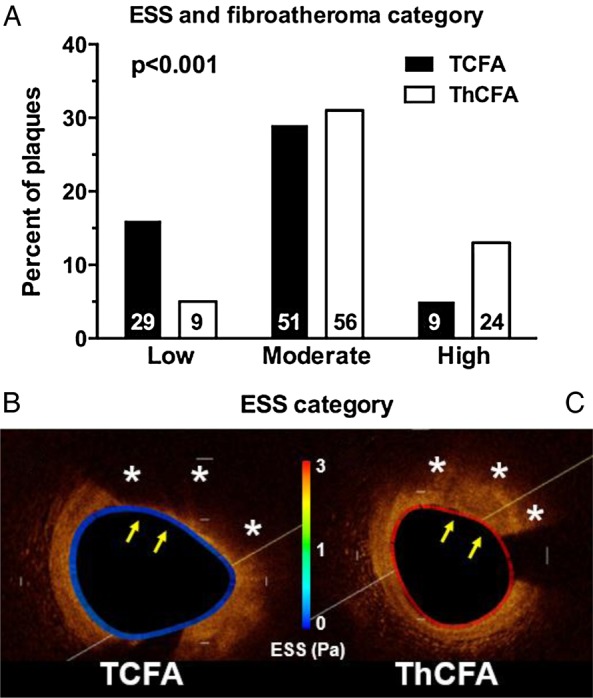
ESS and FA category. (A) The prevalence of TCFA was significantly increased in low ESS subsegments, whereas the prevalence of ThCFA was significantly increased in high ESS subsegments. Numbers within the bars represent absolute numbers. Comparisons between low and moderate ESS and between low and high ESS were statistically significant, whereas comparison between moderate and high ESS was statistically non-significant. (B and C) Representative examples of a TCFA in a low ESS environment (B) and a ThCFA in a high ESS environment (C). ESS is colour-coded along the vessel circumference. Asterisks denote lipid core and arrows the FC.
Association of lumen remodelling with ESS and plaque category
There were 58 (17.5%) subsegments with constrictive lumen remodelling, 210 (63.3%) with compensatory lumen remodelling, and 64 (19.3%) with expansive lumen remodelling. In FAs with constrictive lumen remodelling, 19 (36.5%) had mild stenosis, 14 (26.9%) had moderate stenosis, and 19 (36.5%) had severe stenosis. In the subpopulation of advanced FAs (i.e. TCFA and ThCFA), there was a significant association between lumen remodelling pattern and plaque category. In expansively remodelled subsegments, the prevalence of TCFA was two-fold higher than that of ThCFA. In contrast, in constricted subsegments, ThCFA were twice as many as TCFA (Figure 4A). In the subpopulation of all FAs (i.e. EFA, TCFA, or ThCFA), subsegments with expansive lumen remodelling had exclusively low or moderate ESS, whereas in subsegment with constriction, the ESS was predominantly moderate or high (Figure 4B).
Figure 4.

Lumen remodelling, ESS, and FA category. (A) Association of lumen remodelling with FA category. (B) Association of ESS with lumen remodelling in FAs (i.e. EFA, TCFA, and ThCFA). (C) Association of ESS with non-stenotic FAs. (D) Association of ESS with stenotic FAs. (E and F) Representative OCT cross-sections showing co-localization of low ESS (colour-coded along the vessel circumference), expansive lumen remodelling and TCFA plaque morphology (E) and co-localization of high ESS, constrictive lumen remodelling and ThCFA plaque morphology (F). Asterisks denote lipid core and yellow arrows the FC.
ESS patterns in non-stenotic and stenotic fibroatheromas
In the subgroup of non-stenotic FAs (i.e. EFA, TCFA, or ThCFA with compensatory or expansive lumen remodelling) in low ESS subsegments, the TCFA was the predominant plaque type, whereas ThCFA co-localized predominantly with moderate ESS, suggesting that low ESS has the potential to distinguish non-stenotic TCFA from non-stenotic ThCFA (Figure 4C and E). Those non-stenotic TCFA that co-localized with low ESS areas had significantly thinner FC compared with non-stenotic ThCFA (46 ± 0 vs. 146 ± 1.0 µm, P < 0.001) and larger LP (246 ± 9 vs. 199 ± 11°, P = 0.002). In contrast to non-stenotic FAs, stenotic FAs of any type had exclusively moderate or high ESS (Figure 4D and F).
Arterial shear stress score and prevalence of high-risk fibroatheromas
The shear stress score was measured in each individual coronary artery as a metric of the extent and severity of low ESS in the diseased portions of the artery. The lower the ESS and the larger the luminal surface of the artery exposed to that low ESS, the higher the shear stress score. Arteries with three or more TCFA had two-fold higher shear stress score than arteries with less than two TCFA (409 ± 62 vs. 204 ± 48, P = 0.02) (Figure 5A, C and D). Of note, there was a borderline significant (dose–response) relationship between the shear stress score and frequency of TCFA per artery (Figure 5B).
Figure 5.

Shear stress score and prevalence of TCFA per artery. (A) The prevalence of three or more TCFA per artery was significantly increased in arteries with high shear stress scores. (B) Linear regression analysis showing a positive association between shear stress score and the number of TCFA per artery. (C and D) Representative 2D ESS maps of a low shear stress score artery with 1 TCFA (C) vs. high shear stress score artery with 3 TCFA (plaque on the right side is mixed) (D). Bar graphs show the variation of FC thickness across the length of the artery. Dashed lines correspond to 65 mm which was used as the threshold for thin FC by OCT. Orange bars correspond to TCFA and blue bars to ThCFA/EFA, and no bars denote normal areas or intimal thickening. Asterisks denote lipid core and yellow arrows the FC.
Arterial shear stress score and clinical events
There was no statistically significant difference in the number of TCFA in arteries of patients with acute coronary events vs. stable angina (2.19 ±3.08 vs. 3.07 ±2.62; P = 1.63). At baseline, there was a trend towards significance for higher shear stress scores (∼60% higher) in culprit arteries of acute coronary events vs. stable angina (383 ± 89 vs. 244 ± 42, P = 0.10; Figure 6A). Figure 6B–D depicts representative 2D ESS maps of arteries with culprit lesions for stable angina, unstable angina, and non-ST elevation myocardial infarction. One can appreciate the extensive areas of very low ESS (deep blue) in the culprit arteries for non-ST elevation myocardial infarction or unstable angina vs. stable angina. Follow-up clinical events data were quite limited to allow for reliable outcome analyses.
Figure 6.

Shear stress score and clinical events. (A) The shear stress score was approximately 60% higher in culprit arteries for acute coronary events vs. stable angina at the time of presentation (trend towards significance). (B–D) Representative 2D ESS maps of a low shear stress score artery culprit for stable angina (B) vs. higher shear stress score artery culprit for unstable angina (C) or non-ST elevation myocardial infarction (D). Note the extensive areas of very low (deep blue) ESS in arteries from patients with ACS vs. stable angina.
Inter- and intra-observer agreements
As shown in Table 4, the inter- and intra-observer agreements of FC thickness, LP size, and plaque characterization were high and comparable with other studies in the literature.19
Table 4.
Inter- and intra-observer agreements of OCT morphologic measurements (n = 50 OCT frames)
| Inter-observer | ||||
|
Morphologic analysis |
Plaque analysis |
|||
| FC thickness (mm) | LP size(o) | Plaquetype | ||
| r | 0.84 | 0.95 | k | 0.96 |
| y = ax+β | y = 0.92x + 0.01 | y = 1.05x-9.80 | ||
| Bias | −0.02 | 4.49 | ||
| Limits of agreement | −0.09, 0.06 | −47.36, 56.31 | ||
| Intra-observer | ||||
|
Morphologic analysis |
Plaque analysis |
|||
| FC thickness (mm) | LP size(o) | Plaquetype | ||
| r | 0.96 | 0.99 | k | 0.96 |
| y = ax+β | y = 0.97x + 0.02 | y = 1.01x-7.26 | ||
| Bias | −0.01 | −0.46 | ||
| Limits of agreement | −0.05, 0.03 | −27.36, 26.45 | ||
Discussion
This cross-sectional, proof-of-concept study investigated the functional (ESS, lumen remodelling) and morphologic (FC thickness, LP size) characteristics of atherosclerotic plaques in humans using high-resolution intracoronary imaging with 3D OCT. In addition to the traditional per-segment analysis, an innovative per-artery approach based on the shear stress score was implemented in the current study. The study showed that (i) non-stenotic TCFA are predominantly associated with low ESS, whereas non-stenotic ThCFA are predominantly associated with moderate ESS, and (ii) shear stress score, a quantifiable metric of the extent and severity of low ESS in diseased parts of coronary arteries, was positively associated with increased number of TCFA in a given artery and with acute coronary events vs. stable angina at the time of presentation. Even though the association of baseline shear stress score with events at the time of presentation was not statistically significant (P = 0.10), there was a trend towards significance. Collectively, the findings of this study suggest that local and global (by shear stress score) low ESS, expansive luminal remodelling, and inflammation indirectly assessed by FC thickness in OCT are closely interrelated, likely resulting in TCFA formation and progression.
Dynamic interplay between ESS and high-risk plaque
Using a previously validated 3-mm-long subsegment approach to correlate ESS with plaque progression, this study showed that there is heterogeneity of ESS and plaque within the same coronary arterial segments. Of note, that heterogeneity was minimal within short 3-mm-long arterial subsegments,4,6 and this observation justified the use of the 3-mm threshold for the definition of subsegments of interest in the current study. ESS was calculated using conventional computational fluid dynamics methods, and plaque constituents were assessed with high-resolution intracoronary OCT imaging. A novel and validated technique for geometrically correct 3D OCT14,15 enabled the co-localization of ESS with plaque constituents showing that low ESS co-localizes with plaques with TCFA morphology by OCT. Our study is in line with a prior 3D OCT investigation which showed that low ESS is associated with TCFA9 and further extends that investigation by adding the following new and important elements: (i) Association of lumen remodelling with ESS, (ii) Study of the role of ESS and lumen remodelling in the entire spectrum of atherosclerosis including EFA and advanced FAs (TCFA and ThCFA), (iii) Implementation of a global approach in the assessment of low ESS in arterial level by using the novel concept of shear stress score, and (iv) Association of shear stress score with clinical events in a cross-sectional level.
ESS and lumen remodelling
In the current study, we utilized OCT data to assess the lumen remodelling following an approach similar to the IVUS-derived vascular (external elastic membrane) remodelling. Of note, the OCT could not assess the external elastic lamina, and therefore the vascular remodelling pattern, due to low penetration depth. The IVUS-derived remodelling technique is well validated and has been extensively used in prior animal and human studies.4–7,10,18 The OCT-derived lumen remodelling technique in the current study appears to correlate well with the IVUS-derived vascular remodelling. Based on the lumen remodelling, we classified each individual FA as stenotic or non-stenotic. According to this classification, non-stenotic FAs exhibited compensatory or expansive lumen remodelling and stenotic FAs constrictive lumen remodelling. The main finding of this analysis was that non-stenotic TCFA co-localize primarily with low ESS, whereas non-stenotic ThCFA co-localize with moderate ESS. This observation is useful from the pathophysiology standpoint as it highlights the potential of low ESS to distinguish those two non-stenotic plaque types (TCFA vs. ThCFA), especially in the absence of advanced intracoronary imaging with OCT. Whether the non-stenotic TCFA—especially those with low ESS—will evolve to culprit plaques could not be investigated in the current study given its cross-sectional nature but represents an exciting opportunity for further research.
In addition to non-stenotic TCFA, this study investigated the local ESS in stenotic TCFA by OCT. As expected, the majority of those plaques were associated with high ESS given their stenotic nature. Based on autopsy studies, ruptured TCFA are the culprit plaques in ∼2/3 of acute events.20 There has been a long debate to date about the implication of stenotic vs. non-stenotic TCFA in acute coronary events. Observations suggest that TCFA that are mildly occlusive at the time of early diagnosis might evolve to become substantially larger when they rupture.17,21 The local haemodynamic milieu and lumen remodelling response to plaque growth appear to play a key role in the evolution of early plaques to ruptured TCFA.1–3 Even though it was beyond the scope of the current cross-sectional study, our findings confer a ‘haemodynamic’ viewpoint of the natural history of TCFA and generate hypotheses that warrant further investigation.3 Non-stenotic and stenotic TCFA appear to represent two different stages in the evolution of TCFA. Non-stenotic TCFA represent earlier plaques that appear to primarily develop in low or moderate ESS environment. They undergo acute disruption and either precipitate an acute event or gradually evolve to stenotic plaques through a process of FC microruptures and healing. Those advanced stenotic plaques may maintain the inflamed TCFA morphology and undergo abrupt disruption or erosion in the setting of locally high ESS also leading to an acute coronary event.
Shear stress score, high-risk plaque, and clinical events
This study introduced the shear stress score to assess the global low ESS in those arterial parts containing early or advanced FAs (i.e. EFA, TCFA, and ThCFA). This score is a simple and quantifiable metric of how low and how extensive that low ESS is in an individual artery. The approach in calculating the shear stress score was similar to that of coronary artery calcium score. According to the definition of shear stress score, the lower the ESS and the larger the luminal surface of the artery exposed to that low ESS, the higher the score. Recently, Pedrigi et al. have developed and reported the low shear index which also quantifies the degree of low ESS in a given vessel similarly to shear stress score.22 By incorporating low shear index in their animal studies, the authors demonstrated that persistently low ESS is the principal hemodynamic disturbance that leads to the formation of TCFA.
Our study showed in a cross-sectional level that arteries with high shear stress score had an increased number of TCFA and presented with acute coronary events. Intriguingly, there was a dose–response relationship between shear stress score and the number of TCFA per artery, in that the higher the score, the higher the prevalence of TCFA (Figure 5B). The shear stress score could represent a paradigm shift that integrates multiple arterial areas of local low ESS into a more global perspective in arterial or even coronary tree level. Apparently, the shear stress score data presented in the current study are preliminary, and it is far beyond the purposes of the study to draw conclusions about cut-off values, association with clinical events and risk assessment. In this work, we simply report a consistent observation regarding the association of shear stress score with TCFA and clinical events (cross-sectional approach) that warrants further clinical validation in large longitudinal clinical studies. One could speculate that shear stress score may enable the first-pass invasive or non-invasive 3D reconstruction of the coronary lumen and assessment of shear stress score in an artery or even a patient without advanced plaque imaging. Cases with increased shear stress score could subsequently undergo more thorough evaluation with high-resolution anatomic, morphologic and functional imaging for better plaque characterization.21 In this way, the shear stress score could help identify the truly highest-risk plaques and screen out plaques that are not in the highest-risk category. Early, accurate identification of lesions, which are likely to progress to high-risk plaques, may allow pre-emptive interventional management and/or local targeted drug delivery to stabilize these plaques and avert adverse outcomes.
Limitations
There were several limitations within this investigation. First, the study did not have longitudinal data in individual patients. Thus, the direct correlation of lumen remodelling and local ESS could not be fully characterized, even though such data would be ideal given the dynamic nature of atherosclerosis. Given our results, prospective follow-up studies may be warranted to address this point. Second, our study focused primarily on early and advanced FAs (TCFA or ThCFA). Late-stage, purely calcific plaques were limited (n = 9) and therefore were not investigated. Third, the ESS was averaged in 3-mm-long subsegments of interest, whereas the plaque classification was based on a single representative OCT cross section from the middle of each subsegment. Even though this approach could theoretically generate a mismatch between OCT plaque features and ESS, it is adequately validated and extensively used in prior investigations.4,6 To minimize a potential bias in the selection of the subsegments of interest, each reconstructed artery was divided into 3-mm-long subsegments starting from the most proximal point. To secure the co-registration of OCT and ESS data, the middle OCT frame was identified in each subsegment of interest and its morphological characteristics were correlated with the ESS category of the subsegment. With this approach, the OCT frame and the ESS subsegment were well co-registered, thereby minimizing the selection bias. We also acknowledge the longitudinal heterogeneity of OCT frames in terms of plaque morphological characteristics, which was dependent on the sampling rate of the OCT frames analysed. Fourth, the power of the study was limited due to the limited number of cases. However, by dividing the coronary arteries into 3-mm-long subsegments, we were able to assess the ESS and plaque features in a large number of regions of interest (n = 418), thereby increasing statistical power. This was a small, proof-of-concept study with a limited number of clinical events, and therefore causal association of low ESS and high shear stress score with outcomes could not be inferred. More powerful prospective studies are needed to further explore the association of local ESS and global shear stress score with clinical outcomes. The association of ESS with ACS culprit plaque morphology is an important area of investigation. Unfortunately, by design, the current study was not powered to assess this association given the limited number of culprit plaques that were identified (n = 8) in the ACS patients. Ideally, the potential of ESS to distinguish TCFA from ThCFA should have been assessed by sensitivity and specificity analysis. However, this type of analysis could not be performed in the current study given that ESS was treated as categorical variable due to its heterogeneity amongst arteries and patients.
Conclusions
This study utilized advanced high-resolution intracoronary imaging with 3D OCT to assess the global and local haemodynamic and lumen remodelling patterns across the entire spectrum of atherosclerotic plaques. The study showed that low ESS and expansive lumen remodelling are closely associated with high-risk plaque. High shear stress score, a global metric of low ESS in arterial level, was associated with increased burden of TCFA and tended to be associated with acute coronary events at the time of presentation.
Supplementary data
Supplementary data are available at European Heart Journal – Cardiovascular Imaging online.
Conflicts of interest: None declared.
Funding
This work was supported by the Behrakis Foundation, Boston, MA, USA; European Commission, Marie Curie International Reintegration Grant, FP7, Project: SMILE (249303); General Secretariat of Research and Technology, Program: Heracleitus II, Athens, Greece; National Institute of Biomedical Imaging and Bioengineering, Grant Number K01-EB015868, NIH, Bethesda, MA, USA.
Supplementary Material
References
- 1. Kwak BR, Back M, Bochaton-Piallat ML, Caligiuri G, Daemen MJ, Davies PF et al. Biomechanical factors in atherosclerosis: mechanisms and clinical implications. Eur Heart J 2014;35:3013–20, 20a–20d. [DOI] [PMC free article] [PubMed] [Google Scholar]
- 2. Chatzizisis YS, Coskun AU, Jonas M, Edelman ER, Feldman CL, Stone PH. Role of endothelial shear stress in the natural history of coronary atherosclerosis and vascular remodeling: molecular, cellular, and vascular behavior. J Am Coll Cardiol 2007;49:2379–93. [DOI] [PubMed] [Google Scholar]
- 3. Wentzel JJ, Chatzizisis YS, Gijsen FJ, Giannoglou GD, Feldman CL, Stone PH. Endothelial shear stress in the evolution of coronary atherosclerotic plaque and vascular remodelling: current understanding and remaining questions. Cardiovasc Res 2012;96:234–43. [DOI] [PubMed] [Google Scholar]
- 4. Chatzizisis YS, Jonas M, Coskun AU, Beigel R, Stone BV, Maynard C et al. Prediction of the localization of high-risk coronary atherosclerotic plaques on the basis of low endothelial shear stress: an intravascular ultrasound and histopathology natural history study. Circulation 2008;117:993–1002. [DOI] [PubMed] [Google Scholar]
- 5. Chatzizisis YS, Baker AB, Sukhova GK, Koskinas KC, Papafaklis MI, Beigel R et al. Augmented expression and activity of extracellular matrix-degrading enzymes in regions of low endothelial shear stress colocalize with coronary atheromata with thin fibrous caps in pigs. Circulation 2011;123:621–30. [DOI] [PMC free article] [PubMed] [Google Scholar]
- 6. Koskinas KC, Feldman CL, Chatzizisis YS, Coskun AU, Jonas M, Maynard C et al. Natural history of experimental coronary atherosclerosis and vascular remodeling in relation to endothelial shear stress: a serial, in vivo intravascular ultrasound study. Circulation 2010;121:2092–101. [DOI] [PMC free article] [PubMed] [Google Scholar]
- 7. Koskinas KC, Sukhova GK, Baker AB, Papafaklis MI, Chatzizisis YS, Coskun AU et al. Thin-capped atheromata with reduced collagen content in pigs develop in coronary arterial regions exposed to persistently low endothelial shear stress. Arterioscler Thromb Vasc Biol 2013;33:1494–504. [DOI] [PMC free article] [PubMed] [Google Scholar]
- 8. Samady H, Eshtehardi P, McDaniel MC, Suo J, Dhawan SS, Maynard C et al. Coronary artery wall shear stress is associated with progression and transformation of atherosclerotic plaque and arterial remodeling in patients with coronary artery disease. Circulation 2011;124:779–88. [DOI] [PubMed] [Google Scholar]
- 9. Vergallo R, Papafaklis MI, Yonetsu T, Bourantas CV, Andreou I, Wang Z et al. Endothelial shear stress and coronary plaque characteristics in humans: combined frequency-domain optical coherence tomography and computational fluid dynamics study. Circ Cardiovasc Imaging 2014;7:905–11. [DOI] [PubMed] [Google Scholar]
- 10. Stone PH, Saito S, Takahashi S, Makita Y, Nakamura S, Kawasaki T et al. Prediction of progression of coronary artery disease and clinical outcomes using vascular profiling of endothelial shear stress and arterial plaque characteristics: the PREDICTION Study. Circulation 2012;126:172–81. [DOI] [PubMed] [Google Scholar]
- 11. Chatzizisis YS, Coskun AU, Jonas M, Edelman ER, Stone PH, Feldman CL. Risk stratification of individual coronary lesions using local endothelial shear stress: a new paradigm for managing coronary artery disease. Curr Opin Cardiol 2007;22:552–64. [DOI] [PubMed] [Google Scholar]
- 12. Prati F, Guagliumi G, Mintz GS, Costa M, Regar E, Akasaka T et al. Expert review document part 2: methodology, terminology and clinical applications of optical coherence tomography for the assessment of interventional procedures. Eur Heart J 2012;33:2513–20. [DOI] [PMC free article] [PubMed] [Google Scholar]
- 13. Tearney GJ, Regar E, Akasaka T, Adriaenssens T, Barlis P, Bezerra HG et al. Consensus standards for acquisition, measurement, and reporting of intravascular optical coherence tomography studies: a report from the International Working Group for Intravascular Optical Coherence Tomography Standardization and Validation. J Am Coll Cardiol 2012;59:1058–72. [DOI] [PubMed] [Google Scholar]
- 14. Papafaklis MI, Bourantas CV, Yonetsu T, Vergallo R, Kotsia A, Nakatani S et al. Anatomically correct three-dimensional coronary artery reconstruction using frequency domain optical coherence tomographic and angiographic data: head-to-head comparison with intravascular ultrasound for endothelial shear stress assessment in humans. EuroIntervention 2015;11:407–15. [DOI] [PubMed] [Google Scholar]
- 15. Toutouzas K, Chatzizisis Y, Riga M, Giannopoulos A, Antoniadis A, Shengxian T et al. Accurate and reproducible reconstruction of coronary arteries and endothelial shear stress calculation using 3D OCT: Comparative study to 3D IVUS and 3D QCA. Atherosclerosis 2015;240:510–9. [DOI] [PubMed] [Google Scholar]
- 16. Doulaverakis C, Tsampoulatidis I, Antoniadis AP, Chatzizisis YS, Giannopoulos A, Kompatsiaris I et al. IVUSAngio tool: a publicly available software for fast and accurate 3D reconstruction of coronary arteries. Comput Biol Med 2013;43:1793–803. [DOI] [PubMed] [Google Scholar]
- 17. Otsuka F, Joner M, Prati F, Virmani R, Narula J. Clinical classification of plaque morphology in coronary disease. Nat Rev Cardiol 2014;11:379–89. [DOI] [PubMed] [Google Scholar]
- 18. Feldman CL, Coskun AU, Yeghiazarians Y, Kinlay S, Wahle A, Olszewski ME et al. Remodeling characteristics of minimally diseased coronary arteries are consistent along the length of the artery. Am J Cardiol 2006;97:13–6. [DOI] [PubMed] [Google Scholar]
- 19. Kim S-J, Lee H, Kato K, Yonetsu T, Xing L, Zhang S et al. In vivo reproducibility of measurements for fibrous cap thickness and lipid arc in lipid plaques by optical coherence tomography. J Am Coll Cardiol 2012;5:1072–4. [DOI] [PubMed] [Google Scholar]
- 20. Virmani R, Kolodgie FD, Burke AP, Farb A, Schwartz SM. Lessons from sudden coronary death: a comprehensive morphological classification scheme for atherosclerotic lesions. Arterioscler Thromb Vasc Biol 2000;20:1262–75. [DOI] [PubMed] [Google Scholar]
- 21. Arbab-Zadeh A, Fuster V. The myth of the “vulnerable plaque”: transitioning from a focus on individual lesions to atherosclerotic disease burden for coronary artery disease risk assessment. J Am Coll Cardiol 2015;65:846–55. [DOI] [PMC free article] [PubMed] [Google Scholar]
- 22. Pedrigi RM, Poulsen CB, Mehta VV, Ramsing Holm N, Pareek N, Post AL et al. Inducing persistent flow disturbances accelerates atherogenesis and promotes thin cap fibroatheroma development in D374Y-PCSK9 hypercholesterolemic minipigs. Circulation 2015;132:1003–12. [DOI] [PubMed] [Google Scholar]
Associated Data
This section collects any data citations, data availability statements, or supplementary materials included in this article.