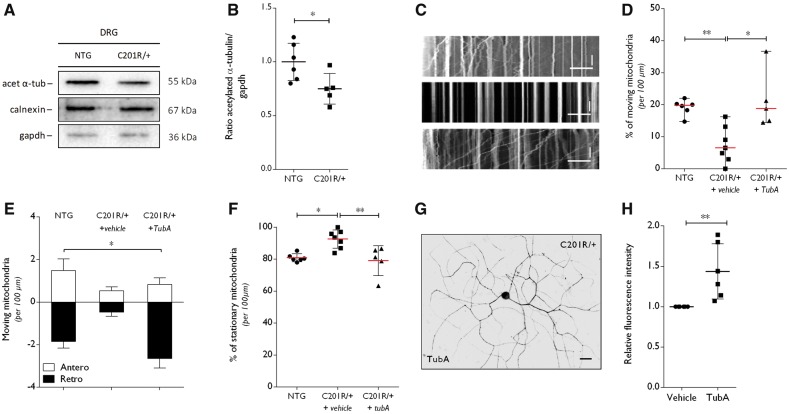
Figure 5.
Altered α-tubulin acetylation and disturbances in mitochondrial axonal transport in DRGs from GarsC201R/+ mice are rescued by selective HDAC6 inhibition. (A) Western blot analysis was used to determine the acetylation status of α-tubulin in DRG homogenates from GarsC201R/+ and littermate control mice (non-transgenic, NTG). GAPDH and calnexin were used as loading control. (B) Densitometry was used to quantify the ratio of acetylated α-tubulin to GAPDH levels. Values were normalized to non-transgenic samples. Non-transgenic 1.00 ± 0.17, n = 6 mice versus GarsC201R/+ 0.75 ± 0.14, n = 5 mice; unpaired t-test t = 2.574, P = 0.0300. (C) Representative kymographs from the analysis of mitochondrial movement in non-transgenic (top) and GarsC201R/+ (middle and bottom) DRG neurons. Stationary mitochondria are represented by vertical lines. Lines deflecting to the right or left are anterograde or retrograde moving mitochondria, respectively. Horizontal scale bar = 30 μm. Vertical scale bar = 80 s. DRG neurons were treated with vehicle or 1 µM tubastatin A (TubA). (D) Mitochondrial movement was quantified within one neurite per cell, relative to the total number of mitochondria per 100 µm. GarsC201R/+ DRG neurons were treated with vehicle or with 1 µm tubastatin A (TubA): non-transgenic 19.14 ± 2.48% moving mitochondria, n = 6 different DRG primary cultures versus GarsC201R/+ + vehicle 7.53 ± 5.69% moving mitochondria, n = 7 different DRG primary cultures versus GarsC201R/+ + tubastatin A 21.21 ± 9.07% moving mitochondria, n = 5 different DRG primary cultures; Kruskal-Wallis test, P = 0.0015. (E) Anterograde and retrograde moving mitochondria were quantified from the kymographs obtained from non-transgenic, vehicle-treated and tubastatin A-treated GarsC201R/+ DRG neurons: antero 0.95 ± 0.46 mitochondria, n = 3 versus retro −1.66 ± 1.10 mitochondria, n = 3 different DRG primary cultures; two-way ANOVA, treatment F(2,18) = 3.898, P = 0.0392, direction of transport F(1,18) = 81.20, P < 0.0001. (F) The number of stationary mitochondria in the neurites from non-transgenic or GarsC201R/+ DRG neurons was quantified relative to the total number of mitochondria, in the absence or presence of tubastatin A was assessed. Non-transgenic 80.87 ± 2.48% stationary mitochondria, n = 6 different DRG primary cultures versus GarsC201R/+ + vehicle 92.57 ± 5.75% stationary mitochondria, n = 7 different DRG primary cultures versus GarsC201R/+ + tubastatin A 79.09 ± 9.34, n = 5 different DRG primary cultures; one-way ANOVA, F(2,15) = 1.515, P = 0.0030. (G) The acetylation of α-tubulin was determined by immunocytochemistry in GarsC201R/+ DRG neuron cultures on tubastatin A treatment. (H) Quantification of the intensity of acetylated α-tubulin in neurites of DRG neuron cultures normalized to the fluorescence length: GarsC201R/++vehicle 1.00 ± 0.0, n = 6 different DRG primary cultures versus GarsC201R/+ + tubastatin A 1.44 ± 0.34, n = 6 cells from six different DRG primary cultures; Mann-Whitney test, P = 0.0022.

