

Abstract
Studying electrical activities in cells, such as action potential and its propagation in neurons, requires a sensitive and non-invasive analytical tool that can image local electrical signals with high spatial and temporal resolutions. Here we report a plasmonics-based electrochemical impedance imaging technique to study transient electrical activities in single cells. The technique is based on the conversion of the electrical signal into a plasmonic signal, which is imaged optically without labels. We demonstrate imaging of the fast initiation and propagation of action potential within single neurons, and validate the imaging technique with the traditional patch clamp technique. We anticipate that the plasmonic imaging technique will contribute to the study of electrical activities in various cellular processes.
Keywords: electrical activity, single cell, electrochemical impedance microscopy, propagation, surface plasmon resonance
Graphical Abstract
Plasmonic imaging of electrical activity in single cells: a plasmonics-based electrochemical impedance imaging approach for electrical activity visualization in single cells was reported. The technique has a temporal resolution of 10 μs, which can map the propagation of electrical signal in the cell.
Electrical activities are ubiquitous in biological processes and functions, including brain information processing,[1] cardiac functions,[2] wound healing,[3] and organism growth and development.[4] Understanding them at the cellular and subcellular levels requires a technique that can map local electrical signals with both high spatial and temporal resolutions. Microelectrode-based electrical recording has played a unique role in the study of neurons, but it has limited spatial resolution and can be invasive.[5] Fluorescence imaging using calcium-sensitive[6] and voltage-sensitive labels[1, 7] is powerful in resolving local electrical activities in cells with high spatial resolution.[8] However, developing suitable labels without affecting the intrinsic cellular activities, and applying them to different samples can be time consuming.[9] Additionally, one must also consider phototoxicity and photobleaching during fluorescence imaging. A label-free imaging technique for mapping local electrical activities in cells is thus a long-standing goal in analytical science.
Here we report plasmonics-based electrochemical impedance microscopy (P-EIM) for label-free imaging of action potential and propagation in single neurons with high spatial and temporal resolution. The measured action potential resembles the simultaneously recorded action potential with a patch clamp, but the imaging capability allows us to observe the local electrical activities, and resolve the fast initiation and propagation of action potentials within a single neuron. The basic principle of P-EIM is to optically image a plasmonic response in a metal film to an electrical field (Figure 1). This is possible because the surface plasmon resonance frequency depends on the electron density in a thin metal film, which changes with the electric field near the metal film.[10] When action potential is fired in a neuron on the metal film, ions flow in and out of the neuron via the ion channels, creating a local and transient electric field, and induces a change in surface charge density on the metal film, which is imaged with P-EIM.
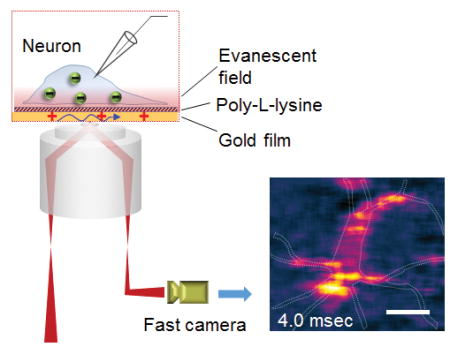
Figure 1.
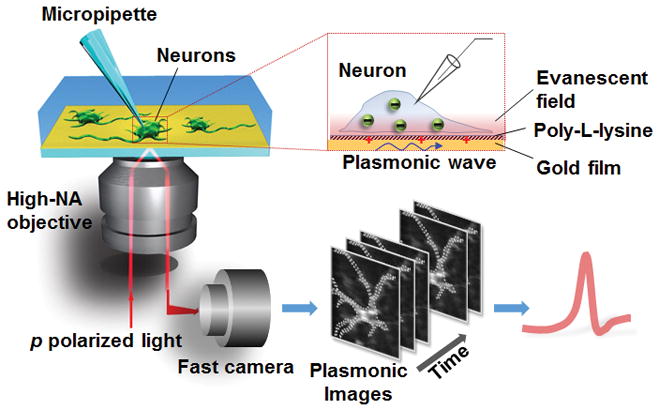
Setup of plasmonic imaging of action potential in neurons. A p-polarized light beam is directed onto a gold-coated glass coverslip through an oil immersion objective to excite plasmons on the gold surface, which is imaged optically with a fast camera. Neurons are cultured on the poly-L-lysine-coated gold surface, and a micropipette is patched on one neuron to trigger action potential that is recorded with both the patch clamp electronics and plasmonic imaging. When an action potential spike is triggered, ions move in and out the neuron via the ion channels, creating a transient charge near the gold surface, which affects surface plasmons in the gold film, which is imaged optically with P-EIM.
The P-EIM in the present work was built on top of an inverted optical microscope using a high-numerical aperture oil immersion objective (Figure 1, left panel).[11] Placed on the objective was a glass slide coated with 47 nm-thick gold film, on which a silicone cell was mounted to hold buffer solution. Incident light from a super luminescent diode was directed onto the gold film from the objective to excite surface plasmons, and the reflected light was collected with the same objective and then directed to a CMOS camera to create a plasmonic image (Figure 1, top right panel). The temporal resolution was limited by the CMOS camera with a frame rate of 100,000 frames per second (fps), corresponding to 10 μs temporal resolution. To allow neurons to grow and attach, the gold film was coated with a thin layer of poly-L-lysine. Action potential in the neurons was triggered with a patch-clamp recording setup in the current-clamp mode, and the corresponding membrane voltage was recorded electrically with a current amplifier, and optically with P-EIM, simultaneously (Figure 1, bottom right panel).
Figure 2a and b show both bright field and plasmonic images of a hippocampal neuron cultured from embryonic day 18 rat. We evoked action potential in the whole-cell current clamp mode by injecting current pulses with amplitude of ~500 pA and duration of 4 ms into the neuron, and recorded a stack of plasmonic images during action potential firing (Figure S1). P-EIM measures a change in the plasmonic signal associated with electrical stimulation, which was obtained by subtracting the first frame from the rest of the frames in each stack. To study transient changes in the plasmonic signal associated with action potential, we averaged the P-EIM images over multiple action potential excitations. We then obtained the transient plasmonic intensity changes of a neuron by selecting the regions of the neuron and plotting the intensity profile. The transient plasmonic intensity resembles closely the electrically recorded action potential spike (Figure 2c and d), which demonstrates plasmonic imaging of action potential in single neurons.
Figure 2.
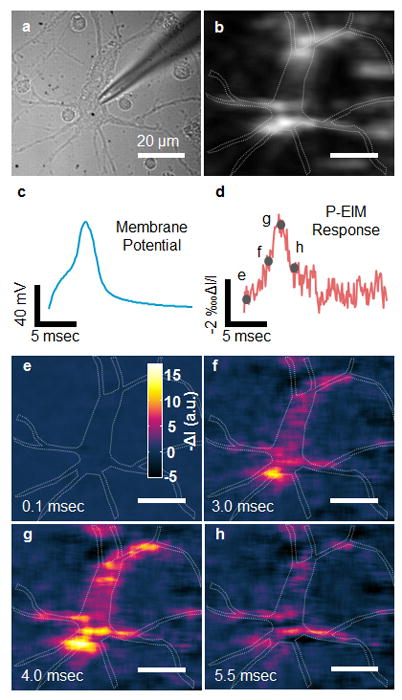
Plasmonic imaging of action potential in single neurons. (a) Bright-field and (b) plasmonic images of a hippocampal neuron, where the dashed lines mark the edge of a neuron. (c) Patch clamp recording of action potential and (d) simultaneous P-EIM recording of action potential of the whole cell (frame rate of 10,000 fps). To clearly illustrate the data, we normalized the intensity change ΔI with mean intensity I, and plotted the plasmonic intensity in negative intensity change for fair comparison. (e–h) Snapshot P-EIM images of action potential at the moments marked by the gray spots in (d). The P-EIM images were averaged over 90 cycles of repeated action potential firing at 23 Hz repeat rate to reduce random noise.
Unlike electrical recording with the traditional patch clamp method, P-EIM imaging provides both temporal and spatial resolutions. A movie of plasmonic imaging of the action potential is presented in Supporting Information (video S1). Figure 2e–f show several snapshots of the movie at different stages of action potential, as marked in Figure 2d. The video reveals the action potential triggering process at different stages, including initial depolarization, spontaneous action potential firing, and action potential dissipation.
We introduced tetrodotoxin (TTX), a Na+ ion channel inhibitor, to block action potential initiation.[12] The plasmonic images show little response to current injection (Figure 3a and b), showing that the P-EIM image intensity response is caused by action potential. To further validate the P-EIM response and test the repeatability of plasmonic imaging, we stimulated the neurons at different frequencies, and observed similar transient P-EIM intensity profiles resembling action potential spikes at the frequencies (Figure 3c–d). The P-EIM images at the peaks of repeatedly fired action potential spikes (Figure 3e–j) reveal local distribution within the neuron, and demonstrate repeatability of the measurement. The capability of tracking the firing of action potential at different frequencies allows one to identify the frequency changes of action potential, which is critical for resolving frequency coding of information in neurons.
Figure 3.
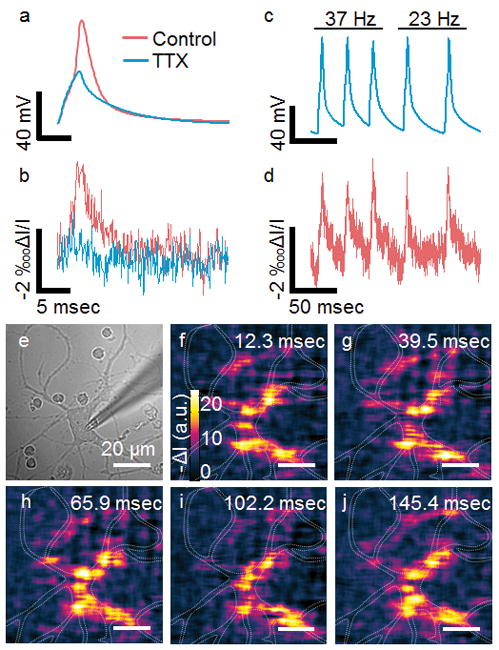
TTX inhibited Na+ ion channel (blue) and control experiment (red) measured with the patch clamp (a) and P-EIM recordings (b). Spike train imaging. Micropipette electrode recording action potential at different frequency (c). P-EIM recording of action potential of a whole neuron area at a frame rate of 10,000 fps (d). Optical transmission images of hippocampal neuron (e). Pixel-by-pixel maps of action potential (f–j) at five peaks (d).
P-EIM can resolve local electrical activities in single cells. This capability allowed us to study action potential initiation and propagation within a single neuron. Figure 4a and b show bright field and plasmonic images of two neurons (outlined with white dashed lines), 1 and 2, and the location where action potential was triggered (red dot in neuron 1). Figure 4c plots the transient plasmonic imaging intensity profiles measured at different locations of the two neurons. Well-defined action potential spikes are clearly resolved in different regions of neuron 1 (regions 1–4), but not in neuron 2 (region 5), indicating that the two neurons were not electrically connected. Analysis of the action potential spikes at different locations of neuron 1 reveals time delays between them. For example, Figure 4d shows a 0.5-ms lag between the action potentials at two locations, one (outlined with green line) is near the triggering location, and the other one (outlined with purple line) is near the end of the axon (see Figure 4b). This observation shows that P-EIM imaging can directly monitor action potential propagation within a single neuron, which has been a difficult task with traditional methods.
Figure 4.
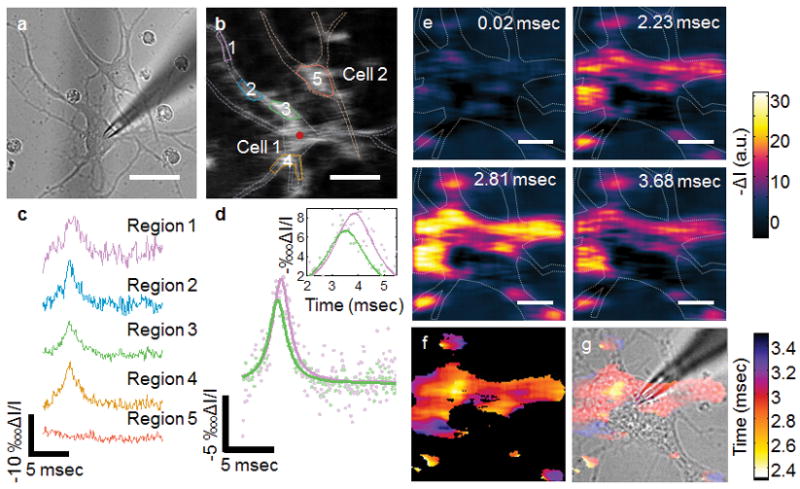
Plasmonic imaging of action potential propagation within a single neuron. (a) Optical transmission and (b) plasmonic images of two hippocampal neurons, where the dash lines mark the edges of the neurons, and the red dot marks the location of micropipette. (c) Time course of action potential at locations outlined by solid lines with the corresponding colors in b. (d) Comparison of action potential spikes at two locations (Regions 1 and 3) showing time decay due to finite propagation speed of action potential. The green and purple solid lines are Lorentzian fitting to the corresponding P-EIM data. (e) Snapshots of action potential propagation at a frame rate of 100,000 fps from a neuron. (f) Action potential delay map. (g) Overlay of the action potential delay map with bright field image of the neuron.
To clearly visualize the time delay in the action potential between different regions of a neuron, and propagation of action potential within a neuron, we recorded a P-EIM movie with 10 μs temporal resolution (Supporting Video S2). The movie shows how the action potential is initiated near the trigger point and propagates along the putative axon and to the dendritic regions. Figure 5e shows several snapshots of the process. From the high-speed P-EIM movie, we constructed a map of action potential time delay (Figure 4f and g). The map allowed us to estimate the propagation speed of action potential in a neuron to be ~0.1 m/s inside a single cell, which agrees with the reported values in literature.[13] The map further shows that the time delay does not simply increase with the distance to the triggering location. This observation is consistent with the report that the initiation and propagation of action potential are highly dependent on the density of sodium ion channels.[14] The capability of monitoring action potential propagation within neurons is particularly useful for the study of the heterogeneous distribution of sodium ion channels and the associated functions in neurons.[15]
P-EIM measures the local plasmonic response to an electrical field (potential) near the metal film. In the case of a bare gold film, the electric field induces a surface charge in the metal film, which changes the surface plasmon resonance frequency according to the free electron gas model.[10] The measured plasmonic signal is resonant angle shift (Δθ), which is proportional to the surface charge change (electric field), given by Δθ=Δσ/α, where α is a constant that measures how sensitive the plasmonic signal is to the surface charge (electric field). For bare gold film, α is 28 C·m−2 deg−1, which agrees with the free electron gas model calculation.[10] In the present work, we coated the gold film with a layer of poly-L-lysine layer (~1 nm in thickness[16]) and grew neurons on its top. Our calibration shows that α is 2 C·m−2 deg−1, much smaller than that for the bare gold film (Supporting Information), indicating a larger plasmonic signal. The smaller α is due to electric field-induced conformational change in the poly-L-lysine layer, which leads to signal amplification.[17] From the measured α, we estimate that action potential induces a spike amplitude of ~0.2 mDeg in the P-EIM signal, which agrees with the observation.
Associated with action potential, Na+ flows into the neuron, and then followed by K+ flowing out of the neuron. This re-distribution of ions can, in principle, change the local refractive index near the metal film, and thus contributes to the P-EIM. However, this change in the plasmonic signal is ~30 times smaller the observed values (Supporting Information, section 4c). Another possible contribution to the measured P-EIM signal is structural changes in the neuronal membrane, including the orientations of the lipid molecules that leads to birefringence,[18] and mechanical deformation of the membrane (Supporting Information, section 4b).[19] The membrane deformation model predicts that a softer cell membrane will lead to a larger deformation. To examine the contribution of membrane deformation, we measured action potential in neurons treated with cytochalasin D, which is known to soften cells by inhibiting polymerization of actin, a major component of cytoskeleton.[20] We found that the action potential peak in cytochalasin D-treated neurons is slightly greater than that in neurons without the treatment (Figure S7), suggesting possible contribution of the structural change to the plasmonic action potential peaks. Although we cannot rule out the contribution from the membrane structural change, potential-induced change in the surface charge and poly-L-lysine layers alone explains the observed plasmonic signal, and the present work demonstrates a label-free imaging of action potential and its propagation in single neurons.
In summary, we have demonstrated P-EIM imaging of action potential and ion channel activities in single mammalian neurons. The imaging technique resolves the individual action potential spikes with width and shape closely resemble those simultaneously recorded with the traditional patch clamp technique. The imaging technique is label-free, which simplifies the sample preparation as required by fluorescence imaging techniques, and removes the possible effects of the labeling on the native functions of the neurons. This label-free imaging capability allows us to image the fast initiation and propagation of action potential in single neurons at subcellular level. The optics of the technique is compatible with the traditional patch clamp recording and fluorescence microscopy, allowing the study of the same sample with multiple techniques. Although the present work is focused on cultured neurons, we anticipate the plasmonic imaging technique can be further improved and applied to study various cellular electrical activities (e.g., neuronal signaling processes, wound healing and tissue development,) and contribute to the understanding of the related biological functions and processes by combining it with other methods, such as the optotrode techniques.
Supplementary Material
Acknowledgments
We thank NIH (R21DA033839), Gordon, Betty Moore Foundation and National Natural Science Foundation of China (NSFC, Grant No. 21327008, and 21676260) for support.
Footnotes
Conflict of interest
The authors declare no conflict of interest.
Supporting information for this article is given via a link at the end of the document.
Contributor Information
Prof. Xian-Wei Liu, CAS Key Laboratory of Urban Pollutant Conversion, School of Chemistry and Materials Science, University of Science & Technology of China, Hefei 230026 (China). Biodesign Center for Bioelectronics and Biosensors, Arizona State University, Tempe, AZ 85287 (USA).
Dr. Yunze Yang, Biodesign Center for Bioelectronics and Biosensors, Arizona State University, Tempe, AZ 85287 (USA).
Prof. Wei Wang, State Key Laboratory of Analytical Chemistry for Life Science, School of Chemistry and Chemical Engineering, Nanjing University, Nanjing 210093 (China)
Dr. Shaopeng Wang, Biodesign Center for Bioelectronics and Biosensors, Arizona State University, Tempe, AZ 85287 (USA)
Dr. Ming Gao, Division of Neurology, Barrow Neurological Institute, St. Joseph’s Hospital and Medical Center, Phoenix, AZ 85013 (USA)
Prof. Jie Wu, Division of Neurology, Barrow Neurological Institute, St. Joseph’s Hospital and Medical Center, Phoenix, AZ 85013 (USA)
Prof. Nongjian Tao, Biodesign Center for Bioelectronics and Biosensors, Arizona State University, Tempe, AZ 85287 (USA)
References
- 1.St-Pierre F, Marshall JD, Yang Y, Gong YY, Schnitzer MJ, Lin MZ. Nat Neurosci. 2014;17:884–889. doi: 10.1038/nn.3709. [DOI] [PMC free article] [PubMed] [Google Scholar]
- 2.Qing Q, Jiang Z, Xu L, Gao R, Mai L, Lieber CM. Nat Nano. 2014;9:142–147. doi: 10.1038/nnano.2013.273. [DOI] [PMC free article] [PubMed] [Google Scholar]
- 3.Zhao M, Song B, Pu J, Wada T, Reid B, Tai G, Wang F, Guo A, Walczysko P, Gu Y, Sasaki T, Suzuki A, Forrester JV, Bourne HR, Devreotes PN, McCaig CD, Penninger JM. Nature. 2006;442:457–460. doi: 10.1038/nature04925. [DOI] [PubMed] [Google Scholar]
- 4.Morokuma J, Blackiston D, Adams DS, Seebohm G, Trimmer B, Levin M. Proc Natl Acad Sci USA. 2008;105:16608–16613. doi: 10.1073/pnas.0808328105. [DOI] [PMC free article] [PubMed] [Google Scholar]
- 5.a) Qing Q, Pal SK, Tian BZ, Duan XJ, Timko BP, Cohen-Karni T, Murthy VN, Lieber CM. Proc Natl Acad Sci USA. 2010;107:1882–1887. doi: 10.1073/pnas.0914737107. [DOI] [PMC free article] [PubMed] [Google Scholar]; b) Li YT, Zhang SH, Wang L, Xiao RR, Liu W, Zhang XW, Zhou Z, Amatore C, Huang WH. Angew Chem Int Ed. 2014;53:12456–12460. doi: 10.1002/anie.201404744. [DOI] [PubMed] [Google Scholar]
- 6.a) Berlin S, Carroll EC, Newman ZL, Okada HO, Quinn CM, Kallman B, Rockwell NC, Martin SS, Lagarias JC, Isacoff EY. Nat Meth. 2015;12:852–858. doi: 10.1038/nmeth.3480. [DOI] [PMC free article] [PubMed] [Google Scholar]; b) Chen TW, Wardill TJ, Sun Y, Pulver SR, Renninger SL, Baohan A, Schreiter ER, Kerr RA, Orger MB, Jayaraman V, Looger LL, Svoboda K, Kim DS. Nature. 2013;499:295–300. doi: 10.1038/nature12354. [DOI] [PMC free article] [PubMed] [Google Scholar]; c) Grewe BF, Langer D, Kasper H, Kampa BM, Helmchen F. Nat Meth. 2010;7:399–405. doi: 10.1038/nmeth.1453. [DOI] [PubMed] [Google Scholar]; d) Schäferling M. Angew Chem Int Ed. 2012;51:3532–3554. doi: 10.1002/anie.201105459. [DOI] [PubMed] [Google Scholar]
- 7.a) Grenier V, Walker AS, Miller EW. J J Am Chem Soc. 2015;137:10894–10897. doi: 10.1021/jacs.5b05538. [DOI] [PMC free article] [PubMed] [Google Scholar]; b) Popovic MA, Carnevale N, Rozsa B, Zecevic D. Nat Commun. 2015:6. doi: 10.1038/ncomms9436. [DOI] [PMC free article] [PubMed] [Google Scholar]; c) Jin L, Han Z, Platisa J, Wooltorton Julian RA, Cohen Lawrence B, Pieribone Vincent A. Neuron. 2012;75:779–785. doi: 10.1016/j.neuron.2012.06.040. [DOI] [PMC free article] [PubMed] [Google Scholar]; d) Kralj JM, Douglass AD, Hochbaum DR, Maclaurin D, Cohen AE. Nat Meth. 2012;9:90–95. doi: 10.1038/nmeth.1782. [DOI] [PMC free article] [PubMed] [Google Scholar]; e) Tsutsui H, Karasawa S, Okamura Y, Miyawaki A. Nat Meth. 2008;5:683–685. doi: 10.1038/nmeth.1235. [DOI] [PubMed] [Google Scholar]
- 8.Hochbaum DR, Zhao Y, Farhi SL, Klapoetke N, Werley CA, Kapoor V, Zou P, Kralj JM, Maclaurin D, Smedemark-Margulies N, Saulnier JL, Boulting GL, Straub C, Cho YK, Melkonian M, Wong GK-S, Harrison DJ, Murthy VN, Sabatini BL, Boyden ES, Campbell RE, Cohen AE. Nat Meth. 2014;11:825–833. doi: 10.1038/nmeth.3000. [DOI] [PMC free article] [PubMed] [Google Scholar]
- 9.Peterka DS, Takahashi H, Yuste R. Neuron. 2011;69:9–21. doi: 10.1016/j.neuron.2010.12.010. [DOI] [PMC free article] [PubMed] [Google Scholar]
- 10.Foley KJ, Shan X, Tao NJ. Anal Chem. 2008;80:5146–5151. doi: 10.1021/ac800361p. [DOI] [PubMed] [Google Scholar]
- 11.Huang B, Yu F, Zare RN. Anal Chem. 2007;79:2979–2983. doi: 10.1021/ac062284x. [DOI] [PubMed] [Google Scholar]
- 12.Lee CH, Ruben PC. Channels. 2008;2:407–412. doi: 10.4161/chan.2.6.7429. [DOI] [PubMed] [Google Scholar]
- 13.a) Debanne D. Nat Rev Neurosci. 2004;5:304–316. doi: 10.1038/nrn1397. [DOI] [PubMed] [Google Scholar]; b) Kole MHP, Stuart GJ. Nat Neurosci. 2008;11:1253–1255. doi: 10.1038/nn.2203. [DOI] [PubMed] [Google Scholar]
- 14.Kole MHP, Ilschner SU, Kampa BM, Williams SR, Ruben PC, Stuart GJ. Nat Neurosci. 2008;11:178–186. doi: 10.1038/nn2040. [DOI] [PubMed] [Google Scholar]
- 15.Korchev YE, Negulyaev YA, Edwards CRW, Vodyanoy I, Lab MJ. Nat Cell Biol. 2000;2:616–619. doi: 10.1038/35023563. [DOI] [PubMed] [Google Scholar]
- 16.Jordan CE, Frey BL, Kornguth S, Corn RM. Langmuir. 1994;10:3642–3648. [Google Scholar]
- 17.MacGriff C, Wang S, Wiktor P, Wang W, Shan X, Tao N. Anal Chem. 2013;85:6682–6687. doi: 10.1021/ac400475z. [DOI] [PubMed] [Google Scholar]
- 18.Cohen LB, Keynes RD, Hille B. Nature. 1968;218:438–441. doi: 10.1038/218438a0. [DOI] [PubMed] [Google Scholar]
- 19.a) Akkin T, Joo C, de Boer JF. Biophy J. 2007;93:1347–1353. doi: 10.1529/biophysj.106.091298. [DOI] [PMC free article] [PubMed] [Google Scholar]; b) Iwasa K, Tasaki I, Gibbons R. Science. 1980;210:338–339. doi: 10.1126/science.7423196. [DOI] [PubMed] [Google Scholar]; c) Kim G, Kosterin P, Obaid A, Salzberg B. Biophy J. 2007;92:3122–3129. doi: 10.1529/biophysj.106.103754. [DOI] [PMC free article] [PubMed] [Google Scholar]; d) Nguyen TD, Deshmukh N, Nagarah JM, Kramer T, Purohit PK, Berry MJ, McAlpine MC. Nat Nano. 2012;7:587–593. doi: 10.1038/nnano.2012.112. [DOI] [PubMed] [Google Scholar]; e) Zhang PC, Keleshian AM, Sachs F. Nature. 2001;413:428–432. doi: 10.1038/35096578. [DOI] [PubMed] [Google Scholar]
- 20.McDowell EJ, Ellerbee AK, Choma MA, Applegate BE, Izatt JA. J Biomed Opt. 2007;12(4):044008. doi: 10.1117/1.2753755. [DOI] [PubMed] [Google Scholar]
Associated Data
This section collects any data citations, data availability statements, or supplementary materials included in this article.