Abstract
Study Objectives:
In obstructive sleep apnea (OSA) esophageal pressure (Pes) is the gold standard for measurement of respiratory effort, and respiratory inductance plethysmography (RIP) is considered an accepted measurement technique. However, the use of RIP could lead to limited accuracy in certain cases and therefore suprasternal pressure (SSP) monitoring might improve the reliability of OSA diagnosis. We aimed to use SSP for the visual characterization of respiratory events in adults and compared results to those obtained by RIP from polysomnography (PSG).
Methods:
In patients with OSA, a 1-night SSP recording using the PneaVoX sensor (Cidelec, Sainte-Gemmes-sur-Loire, France) was done. In parallel, PSG was performed according to American Academy of Sleep Medicine criteria. A subgroup of patients agreed to have Pes measurement in addition. Characterizations of apneas as obstructive, central, and mixed as well as hypopneas as central and obstructive were done by visual evaluation of SSP, RIP, and Pes in random order by two independent scores (S1 and S2). The sensitivity and specificity of characterization by SSP compared to RIP and to Pes were calculated.
Results:
Synchronous recordings of SSP and PSG were analyzed from n = 34 patients with OSA (AHI 34.1 ± 24.2 events/h); 9 of them had synchronized Pes monitoring as well. Interscorer agreement for apnea characterization as obstructive, central, and mixed based on SSP, RIP, and Pes were found, with R2 values from 0.91–0.99. The sensitivity of SSP in apnea characterization with reference to RIP (S1/S2) was 91.5%/92.3% for obstructive, 82.7%/76.2% for central, and 87.4%/79.9% for mixed. The sensitivity of SSP in apnea characterization with reference to Pes was (S1/S2) 93.1%/92.1% for obstructive, 80.8%/81.6% for central, and 91.7%/90.8% for mixed. Hypopnea was only classified for the nine patients with Pes.
Conclusions:
This study demonstrated a good agreement in the detection of respiratory effort with the SSP signal using the PneaVoX sensor compared to the RIP belts signals as well as to the Pes signal. These findings were consistently found by two independent scorers. In summary, results suggest that SSP is a reliable signal for the classification of respiratory events and could be used as an additional tool for OSA characterization in clinical practice.
Citation:
Glos M, Sabil A, Jelavic KS, Schöbel C, Fietze I, Penzel T. Characterization of respiratory events in obstructive sleep apnea using suprasternal pressure monitoring. J Clin Sleep Med. 2018;14(3):359–369.
Keywords: apnea characterization, esophageal pressure, hypopnea characterization, obstructive sleep apnea, respiratory effort, respiratory inductance plethysmography, suprasternal pressure
BRIEF SUMMARY
Current Knowledge/Study Rationale: For characterization of apneas during sleep, reliable recording of respiratory effort is needed. In patients with obstructive sleep apnea, suprasternal pressure monitoring by the PneaVox sensor was tested in comparison with respiratory inductance plethysmography belts and esophageal pressure.
Study Impact: Apnea characterization based on suprasternal pressure monitoring had high interscorer agreement as well as high sensitivity and specificity compared to respiratory inductance plethysmography and esophageal pressure. As an additional sensor, it could improve accuracy of obstructive sleep apnea characterization in adults.
INTRODUCTION
Obstructive sleep apnea (OSA) is the most common form of sleep-disordered breathing and it affects between 6% and 13% of the adult population.1,2 Reliable and robust measurement techniques for detection and characterization of different patterns of disturbed breathing in these patients are mandatory for correct disease diagnosis and classification. For adults, apneas are defined as sleep-related events where respiratory flow is reduced by more than 90% for at least 10 seconds. Three types of apneas occur: (1) obstructive apneas with persistent or increased respiratory effort, (2) central apneas in the absence of respiratory effort, and (3) mixed apneas if the events start as central and the respiratory effort resumes during the events.3 Hypopneas are defined as sleep-related events where respiratory flow is reduced by more than 30% for at least 10 seconds accompanied by a drop in oxygen saturation by at least 3%. Hypopneas can be further distinguished between: (1) obstructive hypopneas with snoring, inspiratory nasal pressure flattening, or associated thoracoabdominal paradox during the event, and (2) central hypopneas in the absence of all criteria defined for obstructive events.3 To distinguish between those types of apneas and hypopneas, assessment of inspiratory effort during sleep is needed. According to the guidelines published by the American Academy of Sleep Medicine (AASM),3 recording of esophageal pressure (Pes) is considered the gold standard for respiratory effort measurements during sleep. However, due to its invasive nature, Pes is not well tolerated by many patients and is not recorded in routine clinical practice. Instead, noninvasive sensors, which are better tolerated by patients, are used to assess respiratory effort indirectly during sleep. At least for apnea characterization a reasonable surrogate measure of respiratory effort can be obtained by measuring changes in chest and abdominal volume, also known as plethysmography. For routine polysomnography (PSG), three primary methods of noninvasive chest and abdominal plethysmography are currently used: measurement of changes in elastic belt tension, electrical impedance, and electrical inductance. Respiratory inductance plethysmography (RIP) is recommended by the AASM3 as an alternative to Pes measurement and allows semi-quantitative assessment of tidal volume as well.4 However, reliable results by RIP belts are dependent on accurate placement and stability of the RIP sensors, which is challenging in some patients, particularly in young children and those who are pregnant or obese. In addition, accuracy during recording can be diminished by displacement of the RIP belts due to body movements during the night. Thus, there are circumstances where intrathoracic pressure changes do not correspond to changes in thoracic and abdominal belts, which could lead to misclassification of obstructive apneas as central.5,6 The differentiation of apneas as central and obstructive or mixed is important, because they are caused by different pathophysio-logical mechanisms and lead to different therapy strategies. In addition, for hypopnea classification results from uncalibrated RIP belts quite often fail to provide sufficient information for decision making, especially in cases where neither snoring nor clear flow limitation is observed.7
Adding new sensors for the detection of respiratory effort to the RIP belts would improve the reliability of the OSA diagnosis. Detection of tracheal sounds has already been evaluated for the measurement of sleep-related respiratory disorders in adults and children,8–11 with studies demonstrating a good agreement between reference methods and tracheal sound-based measurements. A tracheal sound sensor, the PneaVoX (Cidelec, Sainte-Gemmes-sur-Loire, France), that can simultaneously record tracheal sounds, snoring, and suprasternal pressure (SSP) has been compared to gold standard measurements.12–14 Van Surell et al. compared a polygraphy (PG) system that uses this sensor with a routine PSG recording in 50 patients and concluded that the sensor can be used to detect severe OSA.15 In a study that used visual analysis of tracheal sound signals, Meslier et al. showed a good correlation between the analysis of SSP and Pes signals in the measurement of respiratory effort for apnea classification.13 Amaddeo et al. recently evaluated SSP in a study with 20 children. They showed that compared to respiratory effort evaluation using the RIP signals, the SSP has a high degree of validity in children and that it is a useful tool for characterizing apneas in children.14 This technology has been used extensively in clinical practice in France for the past 25 years where the measurement of SSP is recommended for the classification of apnea events with level III evidence.16
Our study aimed to evaluate the use of SSP analysis for the visual assessment of respiratory effort in adults during sleep. The analysis was used for apnea classification and the results were compared to those obtained based on the recommended AASM apnea classification using thoracic and abdominal RIP belt movements. In a subgroup of patients receiving Pes recording in addition, the SSP classifications for both apneas and hypopneas were performed and compared to those obtained using the Pes signal.
METHODS
Patients
Forty-eight patients with a clinical suspicion of OSA were included in the study. The study was approved by the local ethics committee (application number: EA1/009/13) of the university hospital, Charité - Universitätsmedizin Berlin, and patients gave their written consent for participation in the study. Inclusion criteria were an apnea-hypopnea index (AHI) greater than 10 events/h, a minimum recording time of 6 hours, and age between 18 and 70 years. Exclusion criteria were drug use and excessive alcohol consumption, any medication intake that could influence sleep, the presence of any sleep disorder other than OSA, clinically unstable respiratory or cardiovascular disease, and prior OSA treatment. Participants who had taken part in a clinical pharmacological trial up to 4 weeks before entering the study were also excluded. In addition to a physical examination, a general medical case history, and a specific sleep disorder case history, patients were asked to complete the Epworth Sleepiness Scale (ESS) as well as the Insomnia Severity Index (ISI). Age, height, and weight as well as medication and diagnoses of the patients were recorded.
Study Procedure
After signing written consent for participation in the study, patients underwent PSG recordings using the EMBLA N7000 system (Embla Inc., Broomfield, Colorado, United States). Recorded data included electrophysiological signals for sleep evaluation and leg movements as well as airflow via nasal pressure and oronasal thermal sensors, body position, actigraphy, RIP thoracic and abdominal movements, and pulse oximetry (SpO2). In patients who were willing, Pes monitoring (Gaeltec, Isle of Sky, United Kingdom) was obtained in addition. The PSG was performed in a sleep laboratory certified by the German Sleep Society. In addition to the laboratory PSG recording, a PG CID102L equipped with the PneaVoX tracheal sound sensor (Cidelec, Sainte-Gemmes-sur-Loire, France) was installed. The sensor was placed on the skin about 2 cm above the suprasternal pit and laid above the trachea and then secured in place using adhesive tape and adhesive bandage (Figure 1). Correct positioning of the transducer is an essential element for the quality of the signal. Incorrect application of the transducer or not ensuring an airtight cavity between the skin and the transducer can result in poor quality or absence of SSP signal. The quality and amplitude of the signal were verified before starting the recording, and the signal gain was kept constant throughout the night. The signal from the nasal pressure cannula was split by a T-adapter and connected to both the EMBLA N7000 system and the CID102L for later synchronization of recordings from the two systems. Recordings were monitored throughout the night by trained personnel and the presence and quality of all signals was checked at least every hour. Only recordings with reliable signals for more than 6 hours were used in this study. Each PSG recording was scored manually by an experienced medical technician of the Charité Sleep Medical Center according to the AASM criteria.3 The presence of respiratory effort was evidenced by thoracoabdominal movements on RIP throughout the detected events, or when applicable by increased negative inspiratory Pes pressure swings. All respiratory signals from the EMBLA N7000 system were imported into the Cidelec system in European Data Format and a new anonymized PG file was created for each patient. The Cidelec software automatically validated sections where the signals of the pressure cannula, the sound signal, and the saturation were present. Sections that could not be synchronized via the signal from the pressure cannula were not validated. In addition, the SSP and the RIP belts signals as well as the Pes when applicable were visually evaluated to individually compare their scoring performance. These validation restrictions resulted in a high number of patients with recordings that did not meet the 6-hour criteria and were rejected from further evaluation.
Figure 1. Diagram of the PneaVoX transducer.
Respiratory Effort and Tracheal Sound Sensor
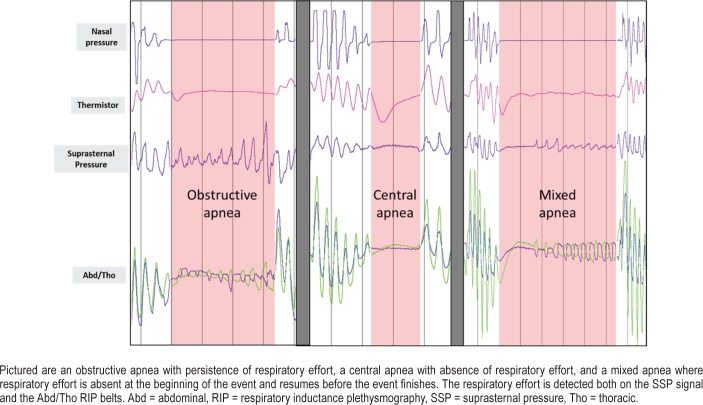
The tracheal sound sensor PneaVoX is a threefold sensor that measure: (1) the respiratory flow sound, (2) the pressure variations induced by the snoring sound, and (3) the SSP variations due to respiratory effort. The device is similar to a stethoscope and it combines an acoustic sensor and a pressure sensor. Both sensors are inserted into a protective plastic chamber that measures 24 mm in diameter and 13 mm thick. A 3-mm thick cuff creates a deep airtight space between the transducer and the skin of the patient (Figure 1). It measures pressure variations induced by (1) high-pitch respiratory flow sounds with an acoustic intensity less than 76 decibels and a frequency between 200 Hz and 2,000 Hz; (2) low-pitch snoring sounds with an acoustic intensity greater than 76 decibels in the transducer chamber and a frequency between 20 Hz and 200 Hz; and (3) a nonaudible low-frequency signal between 0.02 Hz and 20 Hz corresponding to pressure variations due to respiratory effort. The patient's respiratory effort caused variations of pharyngeal pressure, which induce pressure variations in the sensor chamber. These pressure variations are measured by means of a piezoelectric sensor via movements of the skin. Thus, the presence or absence of SSP variations can be used as a surrogate marker of respiratory effort and to characterize apneas in the same way as the RIP belts. Figure 2 shows an example of obstructive apnea with persistence of respiratory effort, a central apnea characterized by the absence of respiratory effort and a mixed apnea where respiratory effort is absent at the beginning of the event and resume before the event finishes, with SSP being used to evaluate respiratory effort. In the absence of effort, the RIP signal as well as the SSP signal can be limited to high-frequency cardiogenic oscillations.
Figure 2. Examples of apneas.
Data Analysis
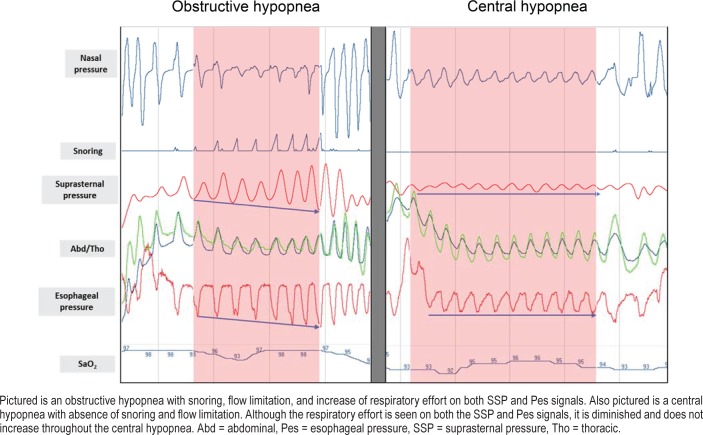
The synchronized recordings were independently scored by two examiners (S1 and S2) on two different files. We then generated a file where only events detected by both examiners were kept. The new generated file was then adopted as the reference file and both examiners used it to characterize the detected apnea and hypopnea events. Characterization of apneas was performed for all patients in two stages by the same examiner. First, only the SSP signal was displayed and analyzed after masking the RIP signal display. Second, only the RIP signals were displayed and analyzed after masking the SSP signal display. Analysis of the two signals was performed in random order. The two classifications of apneas were then compared. For patients receiving Pes monitoring, apnea characterization was also performed using this signal only. Characterization of hypopneas in this patient subgroup was performed also in two stages by the same examiner. First scoring used only the SSP, nasal pressure, and snoring signals. A second scoring, according to AASM, used the Pes, nasal pressure, RIP, and snoring signals. These two analyses were performed in random order. The two classifications of hypopneas were compared afterward. Figure 3 shows an example of an obstructive hypopnea compared to a central hypopnea.
Figure 3. Examples of hypopneas.
Statistical Analysis
Statistical analysis was performed using Matlab R2016a software (The MathWorks, Inc., Natick, Massachusetts, United States). Values are presented as mean ± standard deviation. The sensitivity and specificity of the suprasternal signal to classify apneas and hypopneas were calculated according to the following formulas:
Sensitivity = (true positives) / (true positives + false negatives) × 100
Specificity = (true negatives) / (true negatives + false positives) × 100
RESULTS
Patients
Of 48 patients initially included, 14 patients had some missing or poor signals during the recording and could not be analyzed. There were problems with the nasal pressure signal in seven cases, more frequently than with the thermistor which was only four cases. This could be caused by the fact that the nasal cannula was placed on the top of the thermistor and thus it was more susceptible to come off first. According to the AASM, alternative signals can be used in the case of sensors failure. However, because in this study the signals were evaluated individually, only those recordings were used in which all recorded signals could be analyzed.
Analyzed patient group of 34 subjects (6 females, 28 males) had a mean age of 52.9 ± 10.3 years and a mean body mass index of 30.0 ± 5.2 kg/m2. The AHI based on total sleep time from PSG was 34.1 ± 24.2 events/h. The mean total sleep time was 6.4 ± 1.0 hours and the time in bed was 7.8 ± 0.9 hours. The mean sleep efficiency was 81.7 ± 11.0%. Nine patients had mild OSA (AHI 5–15 events/h), 10 patients had moderate OSA (AHI > 15 to ≤ 30 events/h), and 15 patients had severe OSA (AHI > 30 events/h). Out of these 34 patients, 9 patients had additional Pes measurement.
Measurement of Respiratory Effort for Apnea Characterization: SSP, RIP, and Pes
Using the Cidelec software-synchronized recordings, a total of 4,080 apneas in all patients were identified that were scored in common by both examiners. The subgroup of patients receiving Pes had a total of 1,312 apneas. All respiratory events were then characterized by each examiner as described earlier.
Interscorer Agreement for the Methods
Table 1 shows the interscorer agreement for visual analysis of the apneas. Excellent strength of linear association between the two scorers was found for the classification methods with R2 values of 0.91, 0.99, and 0.97 for the three types of apnea classified with the SSP signals and slightly higher for RIP classification with 0.99, 0.98, and 0.99 for obstructive, central, and mixed apneas, respectively (Table 1). For classifications using Pes in a subgroup of patients, R2 values of 0.99, 0.99, and 0.99 for obstructive, central, and mixed apneas were found (Table 1).
Table 1.
Interscorer agreement for visual characterization of apneas.

Intrascorer Agreement of SSP Versus RIP and SSP Versus Pes for Each Scorer
Table 2 and Table 3 show the results of apnea classification for each scorer using just SSP, just RIP, and just Pes. The sensitivity and specificity of SSP with respect to the RIP and with respect to Pes are summarized in Table 4.
Table 2.
Apnea characterization for scorer 1.
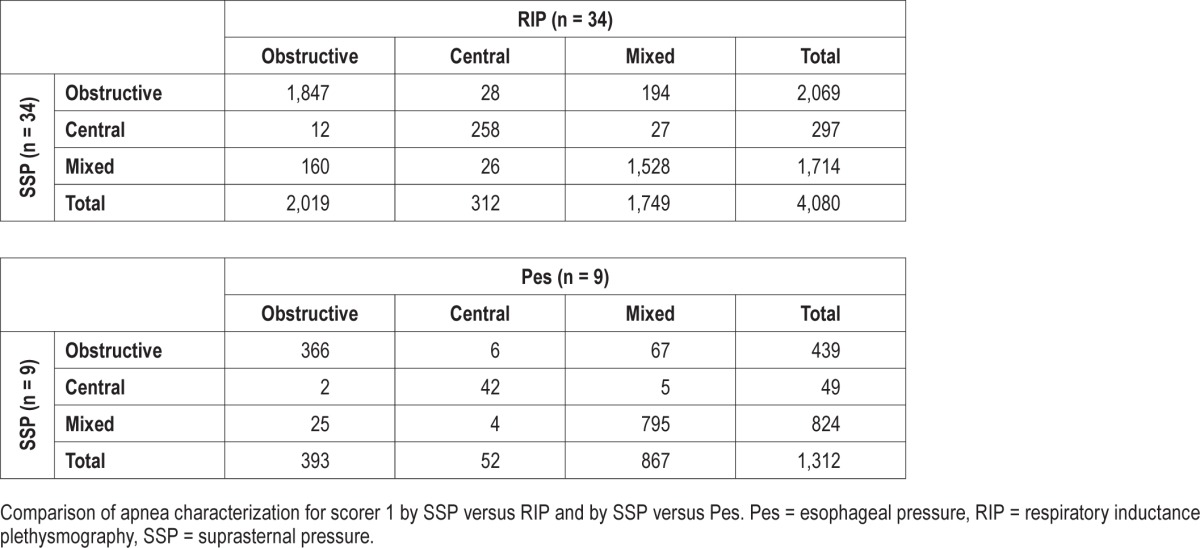
Table 3.
Apnea characterization for scorer 2.
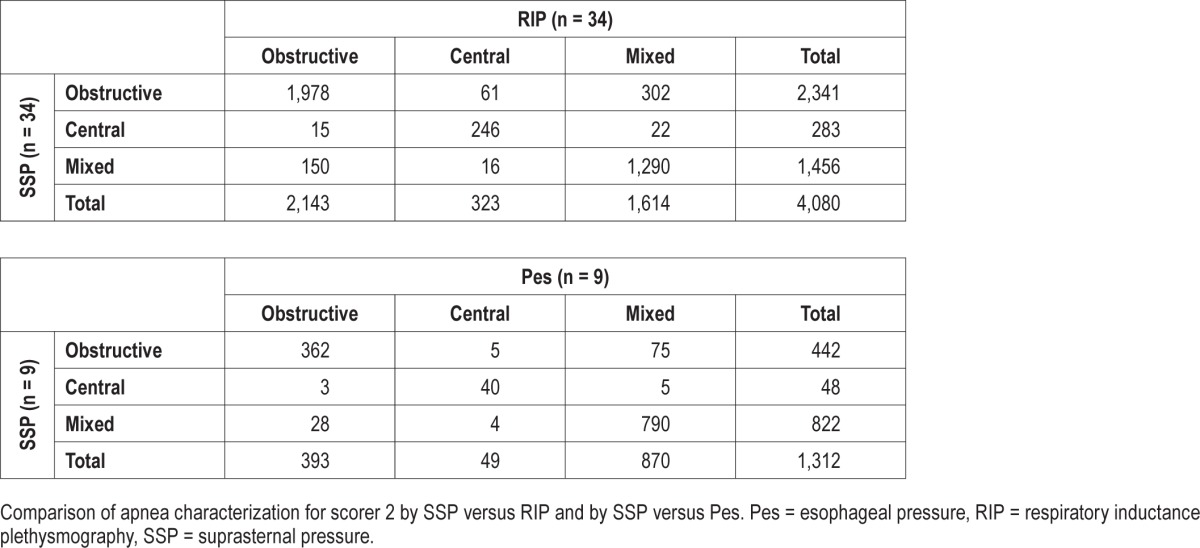
Table 4.
Sensitivity and specificity of apnea characterization using SSP.
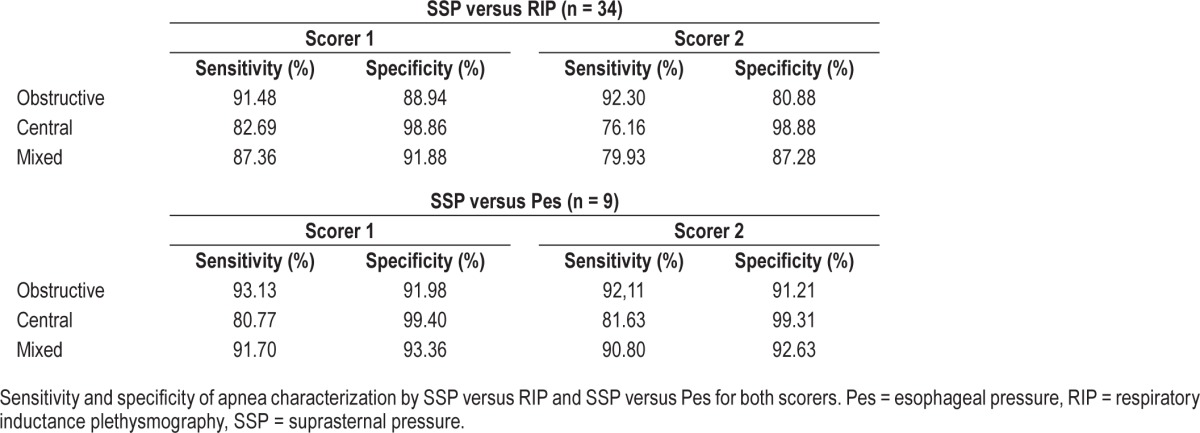
When discriminating the three types of apneas from each other, both scorers classified most apneas (89.04% for S1 and 86.13% for S2) the same way using SSP versus RIP, with a slightly lower performance with scorer S2. For the SSP versus Pes comparison, agreement was slightly higher in both scorers with values of 91.69% for S1 and 90.85% for S2. When comparing the SSP versus RIP methods for both scorers when determining just the presence of effort (obstructive or mixed apnea) from the absence of effort (central apnea) a high level of agreement was found: 97.57% for S1 and 97.20% for S2.
Scorer S1 classified more apneas as mixed with both methods (1,714 with SSP and 1,749 with RIP) than scorer S2 (1,456 with SSP and 1,614 with RIP) and with a higher sensitivity when comparing the apneas classified as mixed with the SSP (87.36%) to those classified as mixed with the RIP (79.93%). Most apneas that were not classified as mixed by scorer S2 were classified as obstructive. For comparing SSP with Pes, an increase in performance is observed if putting obstructive and mixed events together (98.70% for S1 and 98.70% for S2). The major reason for this is that both scorers classified a number of mixed apneas as obstructive (5.10% for S1 and 5.71% for S2).
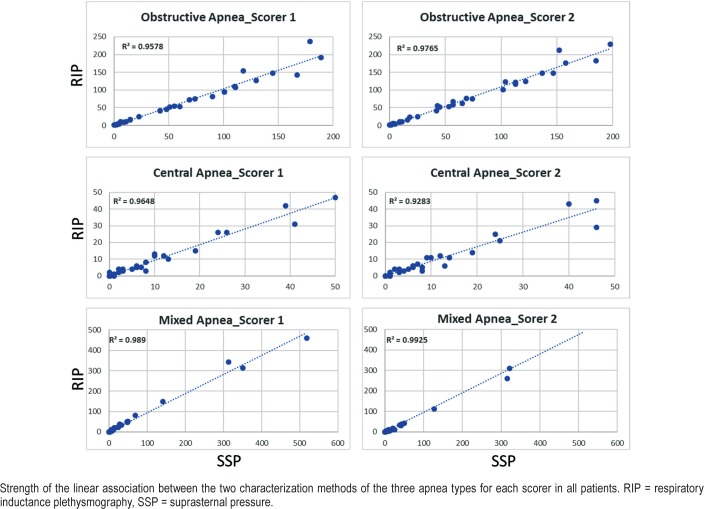
Figure 4 shows for all patients the strength of the linear association between the two characterization methods for the three types of apnea for each scorer. For scorer S1, the coefficient of determination R2 was 0.96, 0.96, and 0.99 for obstructive, central, and mixed apneas, respectively. For scorer S2, R2 was 0.98, 0.93, and 0.99 for obstructive, central, and mixed apneas, respectively.
Figure 4. Linear associated between SSP and RIP.
Measurement of Respiratory Effort for Hypopnea Characterization: SSP and Pes
For hypopneas, a total number of 793 events were scored in the subgroup of patients receiving Pes measurement in addition. All hypopneas were then characterized by each reader as described earlier.
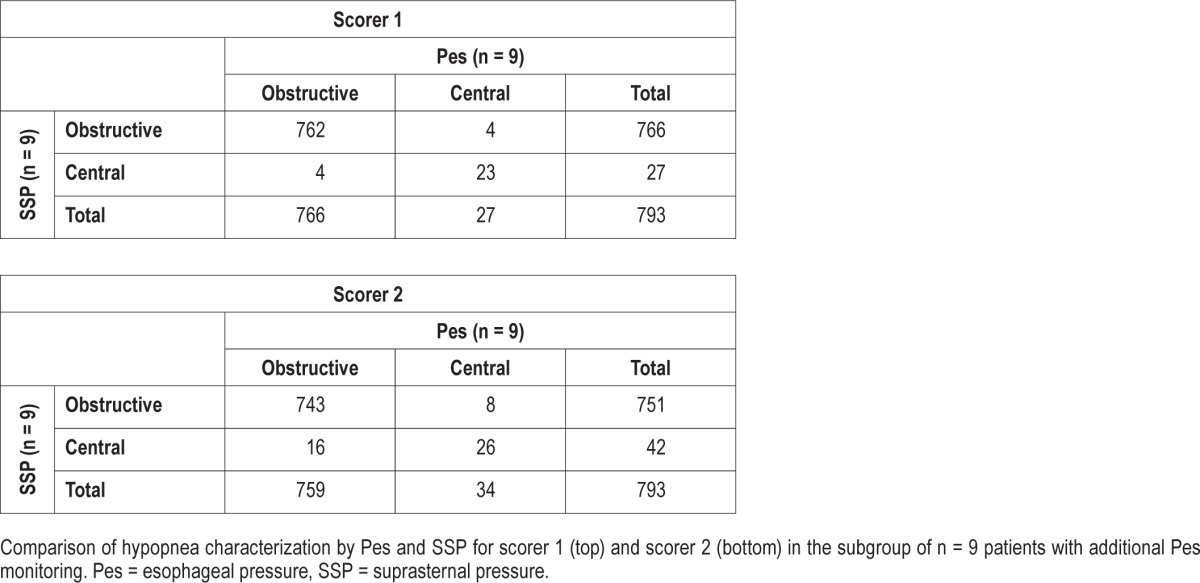
Linear association between the two observers was found with R2 values of 0.99 and 0.62 for obstructive and central hypopneas (Table 5). For scorer S1, 762 of 766 obstructive and 23 of 27 central hypopneas were correctly classified and for scorer S2, 743 of 751 and 26 of 42, respectively (Table 6). The sensibility of SSP in hypopnea characterization (S1/S2) was 99.5%/97.9% for obstructive and 85.2%/76.5% for central. The specificity was 85.2%/76.5% for obstructive and 99.5%/97.9% for central.
Table 5.
Interscorer agreement for visual characterization of hypopneas.

Table 6.
Comparison of hypopnea characterization between scorers.
DISCUSSION
This is the first study that compares, in an adult population, the characterization of apneas using the SSP signal with the RIP belts signals. Both characterizations were evaluated in 34 patients during in-hospital PSG recordings. In addition, in a subset of nine patients Pes measurement were taken and evaluated as well. Overall, there was good agreement in the detection of respiratory effort with the SSP signal using the PneaVoX sensor compared to the signals from RIP belts and Pes catheter, suggesting that SSP is a reliable signal for the classification of apneas in clinical practice.
The AASM recommends the use of Pes to evaluate respiratory effort and to confirm the absence of effort during central apneas.3 However, this measure has limitations: it is invasive, is often poorly tolerated, and is therefore difficult to use routinely in clinical practice. In addition, there is evidence that an esophageal catheter may modify pharyngeal airway dynamics,17 and its presence may itself be responsible for poor-quality sleep.18 As an alternative to Pes monitoring, one can use dual RIP belts signals to identify central apneas by a complete absence of thoracoabdominal movements. The limited data available on this subject suggest a high rate of misclassification by the RIP belts; the RIP signal can become unreliable because the sensor bands on the chest and the abdomen can move up or down during the night, leading to poor respiratory tracings and inaccurate apnea characterization.5,6,19 Misclassification of apneas by RIP can occur even if the RIP system has been calibrated.19 In a study examining the ability of thoracoabdominal movements to detect respiratory effort, Boudewyns et al. reported that 37% of apneas characterized as central were classified as obstructive apneas based on the Pes in their sample.5 This observation was confirmed in two other studies that showed one-third of central sleep apneas diagnosed by uncalibrated RIP belts could not be confirmed by either Pes or diaphragmatic electromyogram.6,20 The measurement of the thoracoabdominal movements is very sensitive to changes in sensor position that modify the tension of the sensors and, therefore, modify the signals. Moreover, for classification of hypopneas as obstructive or central, effort behavior throughout the event could not always be easily evaluated from RIP signals. Thus, characterization of hypopneas in the absence of flow limitation and snoring could become impossible when relying solely on the RIP signals. These limitations of RIP technology suggest that supplemental measurements could be useful.
The measurement of SSP using an acoustic transducer, the PneaVoX, placed over the trachea above the sternal notch has been suggested by Meslier et al.13 to accurately characterize apneas. Twenty-six patients (25 male) were monitored simultaneously with SSP and esophageal manometry during diagnostic or CPAP titration studies. Airflow was measured using a pneumotachograph. A total of 3,261 apneas were classified as obstructive, mixed, or central using Pes. Provided that the cuff was adequately sealed to the skin to ensure an airtight cavity, changes in intrathoracic pressure were well translated into a SSP signal that represents respiratory effort. The sensitivity and specificity of SSP for the detection of apneas with respiratory effort were 99.4% and 93.6%, respectively. Mixed apneas were noted predominantly during diagnostic studies, and the sensitivity and specificity in this subset of studies was 91.4% and 98.4%.13 One strength of the study by Meslier et al. is that Pes, the gold standard, was used as a reference standard measurement for comparison of the two methods; however, they did not compare RIP and SSP characterization and no data were made available on interscorer and intrascorer reliability. Furthermore, the acoustic sensor used in the study by Meslier et al. had nonlinear characteristics that limited the evaluation of intrathoracic pressure using this approach.
A new-generation PneaVoX sensor was recently developed using a combination of a pressure transducer and a microphone in a single device (Figure 1). In a recent study, Amaddeo et al.14 compared this sensor to the sensors recommended by the AASM (oronasal thermal sensor and RIP belts) for the characterization of sleep apneas in 20 children. Compared to the usual recommended PG sensors, the PneaVoX sensor had a high degree of signal validity in children and high levels of sensitivity and specificity for the classification of apneas. Furthermore, the sensor was well tolerated and accepted by children, regardless of their age (from 0.5 to 16.5 years), which makes this sensor a useful adjunct for detecting airflow and obstructive apneas in children.14
In our study, SSP proved to be a stable and reliable signal. The SSP signal was too weak to be analyzed in only 1 case out of 48, which indicates good applicability of the sensor. The sensor was fixed by means of a patch and did not get detached or displaced during sleep except for this one case, unlike other sensors. Compared to RIP belts, the SSP is robust to change of position and remains reliable even in the prone position.13,14 Although the sensor showed a high degree of reliability and was very well tolerated and accepted by all patients, its applicability remains to be tested further in additional studies, in particular, during ambulatory recordings.
The problem of interrater variability for the detection of apnea and hypopnea events was addressed in this study. A reference file was generated using the detection of events by the two scorers and characterization was performed on this file. The analysis of the recording using the Cidelec software and the evaluation of the SSP signal were new methods for one of the scorers (S2), leading to a learning effect. Thus, the scoring results on more familiar signals were closer between the two evaluators than on the SSP signal. Interscorer variability was recently assessed in a large study by Rosenberg et al. The study demonstrated that disagreements not only in scoring of apnea versus hypopnea but also in characterizing apneas were common.21
Finally, just like for any manual scoring, to avoid interscorer variability, the training of the scoring technicians has an important effect on the quality and the reliability of the scoring. For instance, certain events could be scored as central if the SSP signal is not amplified correctly. Furthermore, given the lack of consensus of how long the central part of a mixed apnea should last, scorers set their own criteria for differentiating between mixed and obstructive apneas. However, this misclassification does not have an effect on the detection of the presence of respiratory effort.
Even though we used an AHI of 10 events/h or more as inclusion criteria, patients whose events consisted mainly of hypopnea were included as well in the analysis even when their apnea index was very low. This explains the range of our data sample and the presence of outliers in the data results. However, this disparity in the data would also be interesting to examine in patients with a low apnea index to estimate the negative predictive value more accurately for events detection.
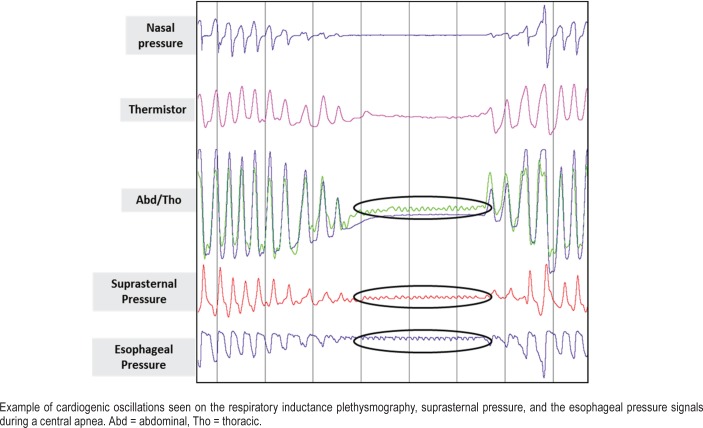
The presence of regular cardiogenic oscillations on a flow signal, which may be best visualized when thoracic muscles are inactive, has also been interpreted to suggest a central characteristic of apneic events.22 In a study of 52 patients undergoing CPAP titration, the presence of cardiogenic oscillations was seen to occur in 60% of events classified as central using respiratory effort signals, and not seen in conjunction with obstructive events.22 Indeed, these cardiogenic oscillations are of higher frequency than respiratory cycles. They are often, but not always, seen during central apneas on the RIP belts signals as well as on the Pes and the SSP signals (Figure 5). For the SSP signal, these oscillations correspond to pressure variations in the suprasternal transducer chamber, sometimes induced by large-amplitude pulsations of large neck vessels. The origin of these oscillations is the same as that of the oscillations observed on the Pes signal or airflow signal, proposed as a marker of central apnea.22,23 However, in certain patients, these cardiogenic oscillations are present even during respiratory effort. In those cases, the high-frequency cardiac signal is modulated in amplitude by the lower respiratory signal. Thus, adequate low-pass filtering of the SSP signal can make it easier to interpret.
Figure 5. Cardiogenic oscillations.
Comparison with Pes allows us to establish the true nature of apneas whenever the RIP and the SSP characterizations of events did not agree. The major limitation of our study is that we did not measure Pes, the gold standard method for respiratory effort detection, in all patients. Success of measuring Pes was not an inclusion criterion of this study and most patients did not tolerate Pes, resulting in only nine cases. Therefore, the effect of results for the characterization of apneas based on Pes and comparison to characterization using the SSP method is limited. Results of agreement between SSP and Pes are even higher than for RIP and SSP, although the data represent just a subgroup of patients and does not allow a generalized conclusion. Therefore, the origin of the unexpected number of apneas that were scored with effort by the RIP and without effort using SSP (37/283 for S1 and 39/295 for S2) could not be clarified systematically. Similar results were also observed in the study by Amaddeo et al.14 with one of the scorers (10/59). However, this failure of the SSP signal to detect respiratory effort was observed in only 4 patients, totaling 37 apneas for the first scorer and 39 apneas for the second scorer that were incorrectly classified as central apneas. Based on RIP classification, these apneas were 15 obstructive apneas and 22 mixed apneas for the first scorer and 12 obstructive apneas and 27 mixed apneas for the second scorer. Obesity does not appear to be responsible for this inadequate signal, as body mass index was ≤ 30 kg/m2 in these patients. However, cardiogenic oscillations were particularly strong in these recordings and the high- frequency pulse variations in the SSP signal may have veiled the lower frequency respiratory effort variations. Another limitation is that our sample included mainly males (82%) and more females should be tested in further studies. In addition, the stability of the SSP during REM sleep was not analyzed in our study. SSP measurement should not be affected by cardiovascular instability during REM sleep, but may reflect ventilatory instability. Whether this would hinder or facilitate apnea characterization in REM sleep remains to be assessed.
Finally, compared to hypopneas, apneas may be more easily characterized as central or obstructive because events may be classified on the sheer presence or absence of respiratory effort. In the nine patients with additional Pes measurement, characterization of hypopneas was possible by looking for flow limitation, snoring, thoracoabdominal paradox, and for the degree and time course of respiratory effort. Results for characterization of hypopneas by SSP in comparison to Pes are promising, but—as already mentioned—the limited number of patients tolerating Pes measurement in this study does not allow a generalized conclusion.
In conclusion, visual evaluation of respiratory effort was performed using two different noninvasive methods in a group of 32 patients with OSA. There was good agreement in the detection of respiratory effort between the SSP signal using the PneaVoX sensor and the thoracoabdominal movements using the RIP belts signals. In a subgroup of patients with additional Pes measurement agreement of SSP with Pes was even higher, suggesting that the PneaVoX sensor could be a reliable sensor for characterization of respiratory events. In addition, the PneaVoX sensor is easy to put in place, is well tolerated by the patient, and does not interfere with sleep. Last, it is not susceptible to artifacts. Thus, SSP represents at least a good additional sensor—and maybe an alternative sensor in the future—with the RIP belts to identify the presence of respiratory effort during PSG recordings. However, it would be useful to systematically measure simultaneously Pes, RIP, and SSP in a large number of patients to evaluate how the combination of the two noninvasive techniques can improve apnea characterization and how SSP can be useful to detect increased respiratory effort during obstructive hypopneas.
DISCLOSURE STATEMENT
This study was performed at Charité Universitätsmedizin Berlin. All authors have seen and approved the manuscript. The study was financially supported by an unrestricted grant by Cidelec, France. Thomas Penzel has received research grants from Heinen & Löwenstein, Itamar, Philips / Respironics, Resmed, Somnodent. He received speaker fees and travel support from Bayer, Itamar, Inspire, Somnodent, UCB, Weinmann. He is a shareholder of Advanced Sleep Research GmbH, The Siestagroup GmbH, Somnico GmbH. He was supported by the project no. LQ1605 from the National Program of Sustainability II (MEYS CR) and by the project FNUSAICRC no. CZ.1.05/1.1.00/02.0123 (OP VaVpI). Ingo Fietze has received research grants from Actelion, Eisai, Heinen & Löwenstein, Jazz Pharmaceuticals, Philips / Respironics, Resmed, Somnodent, UCB, Vanda. AbdelKebir Sabil is fully employed by Cidelec. All other authors report no conflicts of interest. The authors alone are responsible for the content and writing of the paper.
ACKNOWLEDGMENTS
The authors gratefully acknowledge Dr. Guillaume Baffet and Emmanuelle Emo for their support in study coordination as well as Claudia Biro and Beate Diecker for scoring of sleep recordings.
ABBREVIATIONS
- AASM
American Academy of Sleep Medicine
- AHI
apnea hypopnea index
- CPAP
continuous positive airway pressure
- EDF
European Data Format
- OSA
obstructive sleep apnea
- Pes
esophageal pressure
- PG
polygraphy
- PSG
polysomnography
- REM
rapid eye movement
- RIP
respiratory inductance plethysmography
- SpO2
pulse oximetry
- SSP
suprasternal pressure
- TST
total sleep time
REFERENCES
- 1.Heinzer R, Vat S, Marques-Vidal P, et al. Prevalence of sleep-disordered breathing in the general population: the HypnoLaus study. Lancet Respir Med. 2015;3(4):310–318. doi: 10.1016/S2213-2600(15)00043-0. [DOI] [PMC free article] [PubMed] [Google Scholar]
- 2.Peppard PE, Young T, Barnet JH, Palta M, Hagen EW, Hla KM. Increased prevalence of sleep-disordered breathing in adults. Am J Epidemiol. 2013;177(9):1006–1014. doi: 10.1093/aje/kws342. [DOI] [PMC free article] [PubMed] [Google Scholar]
- 3.Berry RB, Brooks R, Gamaldo CE, et al. for the American Academy of Sleep Medicine. The AASM Manual for the Scoring of Sleep and Associated Events: Rules, Terminology and Technical Specifications. Darien, IL: American Academy of Sleep Medicine; 2014. Version 2.1. [Google Scholar]
- 4.Carry PY, Baconnier P, Eberhard A, Cotte P, Benchetrit G. Evaluation of respiratory inductive plethysmography: accuracy for analysis of respiratory waveforms. Chest. 1997;111(4):910–915. doi: 10.1378/chest.111.4.910. [DOI] [PubMed] [Google Scholar]
- 5.Boudewyns A, Willemen M, Wagemans M, De Cock W, Van de Heyning P, De Backer W. Assessment of respiratory effort by means of strain gauges and esophageal pressure swings: a comparative study. Sleep. 1997;20(2):168–170. doi: 10.1093/sleep/20.2.168. [DOI] [PubMed] [Google Scholar]
- 6.Luo YM, Tang J, Jolley C, et al. Distinguishing obstructive from central sleep apnea events: diaphragm electromyogram and esophageal pressure compared. Chest. 2009;135(5):1133–1141. doi: 10.1378/chest.08-1695. [DOI] [PubMed] [Google Scholar]
- 7.Berry RB, Budhiraja R, Gottlieb DJ, et al. Rules for scoring respiratory events in sleep: update of the 2007 AASM manual for the scoring of sleep and associated events. Deliberations of the Sleep Apnea Definitions Task Force of the American Academy of Sleep Medicine. J Clin Sleep Med. 2012;8(5):597–619. doi: 10.5664/jcsm.2172. [DOI] [PMC free article] [PubMed] [Google Scholar]
- 8.Cummiskey J, Williams TC, Krumpe PE, Guilleminault C. The detection and quantification of sleep apnea by tracheal sound recordings. Am Rev Respir Dis. 1982;126(2):221–224. doi: 10.1164/arrd.1982.126.2.221. [DOI] [PubMed] [Google Scholar]
- 9.Beckerman RC, Wegmann MJ, Waring WW. Tracheal breath sounds for detection of apnea in infants and children. Crit Care Med. 1982;10(6):363–366. doi: 10.1097/00003246-198206000-00005. [DOI] [PubMed] [Google Scholar]
- 10.Nakano H, Hayashi M, Ohshima E, Nishikata N, Shinohara T. Validation of a new system of tracheal sound analysis for the diagnosis of sleep apneahypopnea syndrome. Sleep. 2004;27(5):951–957. doi: 10.1093/sleep/27.5.951. [DOI] [PubMed] [Google Scholar]
- 11.Yadollahi A, Giannouli E, Moussavi Z. Sleep apnea monitoring and diagnosis based on pulse oximetry and tracheal sound signals. Med Biol Eng Comput. 2010;48(11):1087–1097. doi: 10.1007/s11517-010-0674-2. [DOI] [PubMed] [Google Scholar]
- 12.Meslier N, Racineux JL. Use of Tracheal Sound Recordings to Monitor Airflow During Sleep. In: Peter JH, Podszus T, von Wichert P, editors. Sleep Related Disorders and Internal Diseases. Germany: Springer-Verlag Berlin Heidelberg; 1987. [Google Scholar]
- 13.Meslier N, Simon I, Kouatchet A, Ouksel H, Person C, Racineux JL. Validation of a suprasternal pressure transducer for apnea classification during sleep. Sleep. 2002;25(7):753–757. doi: 10.1093/sleep/25.7.753. [DOI] [PubMed] [Google Scholar]
- 14.Amaddeo A, Fernandez-Bolanos M, Olmo Arroyo J, Khirani S, Baffet G, Fauroux B. Validation of a suprasternal pressure sensor for sleep apnea classification in children. J Clin Sleep Med. 2016;12(12):1641–1647. doi: 10.5664/jcsm.6350. [DOI] [PMC free article] [PubMed] [Google Scholar]
- 15.Van Surell C, Lemaigre D, Leroy M, Foucher A, Hagenmuller MP, Raffestin B. Evaluation of an ambulatory device, CID 102, in the diagnosis of obstructive sleep apnoea syndrome. Eur Respir J. 1995;8(5):795–800. [PubMed] [Google Scholar]
- 16.Escourrou P, Meslier N, Raffestin B, et al. [Which clinical approach and which diagnostic procedures for obstructive sleep apnea syndrome?] Rev Mal Respir. 2010;27(Suppl 3):S115–S123. doi: 10.1016/S0761-8425(10)70017-6. [DOI] [PubMed] [Google Scholar]
- 17.Kushida CA, Giacomini A, Lee MK, Guilleminault C, Dement WC. Technical protocol for the use of esophageal manometry in the diagnosis of sleep-related breathing disorders. Sleep Med. 2002;3(2):163–173. doi: 10.1016/s1389-9457(01)00143-5. [DOI] [PubMed] [Google Scholar]
- 18.Chervin RD, Aldrich MS. Effects of esophageal pressure monitoring on sleep architecture. Am J Respir Crit Care Med. 1997;156(3 Pt 1):881–885. doi: 10.1164/ajrccm.156.3.9701021. [DOI] [PubMed] [Google Scholar]
- 19.Chediak AD, Demirozu MC, Nay KN. Alpha EEG sleep produced by balloon catheterization of the esophagus. Sleep. 1990;13(4):369–370. doi: 10.1093/sleep/13.4.369. [DOI] [PubMed] [Google Scholar]
- 20.Stoohs RA, Blum HC, Knaack L, Butsch-von-der-Heydt B, Guilleminault C. Comparison of pleural pressure and transcutaneous diaphragmatic electromyogram in obstructive sleep apnea syndrome. Sleep. 2005;28(3):321–329. [PubMed] [Google Scholar]
- 21.Rosenberg RS, Van Hout S. The American Academy of Sleep Medicine Inter-scorer Reliability program: respiratory events. J Clin Sleep Med. 2014;10(4):447–454. doi: 10.5664/jcsm.3630. [DOI] [PMC free article] [PubMed] [Google Scholar]
- 22.Ayappa I, Norman RG, Rapoport DM. Cardiogenic oscillations on the airflow signal during continuous positive airway pressure as a marker of central apnea. Chest. 1999;116(3):660–666. doi: 10.1378/chest.116.3.660. [DOI] [PubMed] [Google Scholar]
- 23.Morrell MJ, Badr MS, Harms CA, Dempsey JA. The assessment of upper airway patency during apnea using cardiogenic oscillations in the airflow signal. Sleep. 1995;18(8):651–658. doi: 10.1093/sleep/18.8.651. [DOI] [PubMed] [Google Scholar]


