

Abstract
Study Objectives:
Recently, the Icelandic Sleep Apnea Cohort (ISAC) identified three subgroups in patients with obstructive sleep apnea (OSA) recruited from the sleep clinic based on clinical symptoms and comorbidities: excessively sleepy, minimally symptomatic, and disturbed sleep. This study sought to determine whether the three OSA subgroups are applicable to a population-based cohort in Korea.
Methods:
Study subjects are participants of an ongoing cohort study in Korea. Of the 2,918 participants, 422 new moderate to severe OSA cases (apneahypopnea index [AHI] ≥ 15 events/h) were diagnosed by home sleep studies. All participants completed a detailed questionnaire on sleep-related symptoms, comorbidities, medication, and other information. A latent class analysis was performed.
Results:
When examining solutions for up to 10 clusters, the a priori three-cluster solution was the optimal clustering solution. The three-cluster solution demonstrated a subgroup presentation similar to the clusters identified in the ISAC. The minimally symptomatic subgroup was most prevalent (55.7%) in the Korean cohort. Among the three subgroups, there were no differences in mean AHI and body mass index; however, the disturbed sleep subgroup was older and had more females.
Conclusions:
Combined with the ISAC data, we suggest that the three-symptom cluster solution for patients with OSA may be more widely applicable, irrespective of ethnicity and study population.
Citation:
Kim J, Keenan BT, Lim DC, Lee SK, Pack AI, Shin C. Symptom-based subgroups of koreans with obstructive sleep apnea. J Clin Sleep Med. 2018;14(3):437–443.
Keywords: Asian population, insomnia, latent cluster analysis, obstructive sleep apnea, sleepiness, symptom
BRIEF SUMMARY
Current Knowledge/Study Rationale: Increasing evidence indicates that obstructive sleep apnea is heterogeneous in its clinical presentations and prognosis. Recently, the Icelandic Sleep Apnea Cohort study suggested three distinct symptom-based subtypes of obstructive sleep apnea: (1) disturbed sleep, presenting with insomnia symptoms but little daytime sleepiness; (2) excessively sleepy, presenting with excessive drowsiness during the daytime, but little complaints about disturbed sleep; and (3) a minimally symptomatic subtype.
Study Impact: Using similar symptom questionnaires, the current study examined whether the three subtypes are applicable to other racial/ethnic populations. We found that the three symptom subtypes are relevant in a population-based sample with lower symptom burden in Korea.
INTRODUCTION
Obstructive sleep apnea (OSA), characterized by repeated obstruction of the upper airway during sleep, is one of the most common sleep disorders that increases risk of cardiovascular and metabolic diseases and mortality.1,2 Increasing evidence indicates that OSA is heterogeneous in its clinical presentations and prognosis.3–5 Frequently assessed symptoms in patients with OSA, such as excessive daytime sleepiness, morning headaches, nonrestorative sleep, and insomnia,6,7 are not present in all patients and may vary widely in severity between patients. Identification of subgroups based on symptoms is critical to understand disease causality and ultimately develop optimal care strategies customized for each subgroup.
Recently, Ye et al.3 identified three distinct subgroups within the patients with moderate to severe OSA in the Icelandic Sleep Apnea Cohort (ISAC), using 19 daytime and nighttime symptoms and four comorbidities. The excessively sleepy subgroup presented with typical excessive daytime sleepiness; the disturbed sleep subgroup reported insomnia-related sleep problems and little daytime sleepiness; and the minimally symptomatic subgroup had higher rates of cardiovascular comorbidities.3 Subsequently, several other European studies have used cluster analyses to identify OSA subgroups.5,8,9 These studies used a broader range of patients (including controls) and when including OSA severity, demographic factors, and depression in analyses,5,8,9 they not surprisingly found different patient subgroups. However, with respect to patients' symptoms, there were similarities to the ISAC results,3 such as “predominant insomnia symptoms typical for daytime sleepiness” and “less symptomatic.” A next step is to examine generalizability of the three symptom clusters in different racial and ethnic populations, as suggested in a recent commentary.10
Repeatedly, studies show Asian patients with OSA are different from their Western counterparts. Morphologically, Asian patients are less obese,11,12 have more crowded upper airways, and have more craniofacial restriction than Caucasian patients.13,14 Despite the differences in morphology across countries, however, previous studies in Asian populations have reported OSA symptoms similar to those in Caucasians, including excessive daytime sleepiness, unrefreshed sleep, loud snoring, loss of concentration, and morning headaches.15–17 There is a lack of information on ethnic differences or similarities in symptom manifestation and clinical consequences of OSA. In addition to ethnic differences, a recent study performed in Iceland that utilized a general population sample, as in the current study, suggests that OSA is highly prevalent within the general population, but the overall symptom burden is low.18 Although they did not study how this reduced symptom burden in a population-based sample affected clinical OSA subtypes, one obvious hypothesis is an increase in the prevalence of minimally symptomatic patients when utilizing a general population sample.
This study was designed to assess whether the three OSA subgroups—excessively sleepy, disturbed sleep, and minimally symptomatic subgroup—are applicable to a population-based sample in Korea, using daytime and nighttime symptoms and comorbidities similar to the Iceland study.3 We hypothesized that the OSA subgroups identified in the Iceland clinical sample should be replicated in an Asian population sample. We also hypothesized that prevalence of minimally symptomatic patients in the Korean population-based sample will be higher than in the Iceland clinical sample.
METHODS
Study Sample
Study subjects are participants in an ongoing population study, the Korean Genome and Epidemiology study (KoGES), which opened in 2001 enrolling middle-aged and older adults in Korea.19,20 KoGES was approved by an institutional review committee at Korea University Ansan Hospital, and written consent was obtained from all participants. The primary purpose of KoGES is to investigate the prevalence, incidence, and clinical consequences of chronic diseases in Korean adults, as well as the genetic, environmental, and lifestyle risk factors. A total of 5,020 randomly selected residents in Ansan, a suburb just south of the Seoul National Capital Area of Korea, underwent a comprehensive health examination including interviews at baseline and biennial follow-up studies thereafter. Home-based sleep studies were introduced to the KoGES in 2011 (fifth follow-up examination). Among those who participated in the core follow-up studies of the KoGES between 2011 and 2015 (n = 3,175), a total of 2,918 individuals underwent home-based sleep studies: 1,362 (46.7%) had a diagnosis of OSA (apnea-hypopnea index [AHI] > 5 events/h) and 422 (14.5%) with moderate to severe OSA (AHI > 15 events/h).
For this study, as in the original ISAC study, analyses were restricted to the 422 participants with moderate to severe OSA, which allows more direct comparisons of results.
Home Sleep Study
Home sleep studies were performed using a portable sleep monitoring device (Embletta X-100; Embla Systems, Broom-field, Colorado, United States), consisting of one channel for each of the following: electroencephalogram, electrooculo-gram, chin-muscle electromyogram, and electrocardiogram. Respiration was assessed by pulse oximetry, as well as a pressure transducer airflow sensor and a chest and abdominal respiratory movement sensor. A trained sleep technologist connected the device to the patient at bedtime, recorded an unattended overnight recording, collected the equipment the following morning, and manually scored the breathing events. Apneas were defined as ≥ 90% drop in airflow on the oronasal thermistor and nasal pressure cannula for at least 10 seconds. Hypopneas were defined as ≥ 30% drop in airflow for at least 10 seconds associated with at least a 4% oxygen desaturation.21
AHI was calculated as the mean number of apneas and hypopneas per hour of sleep. Total sleep duration at night was confirmed by self-reported total sleep time.
Symptom Questionnaire
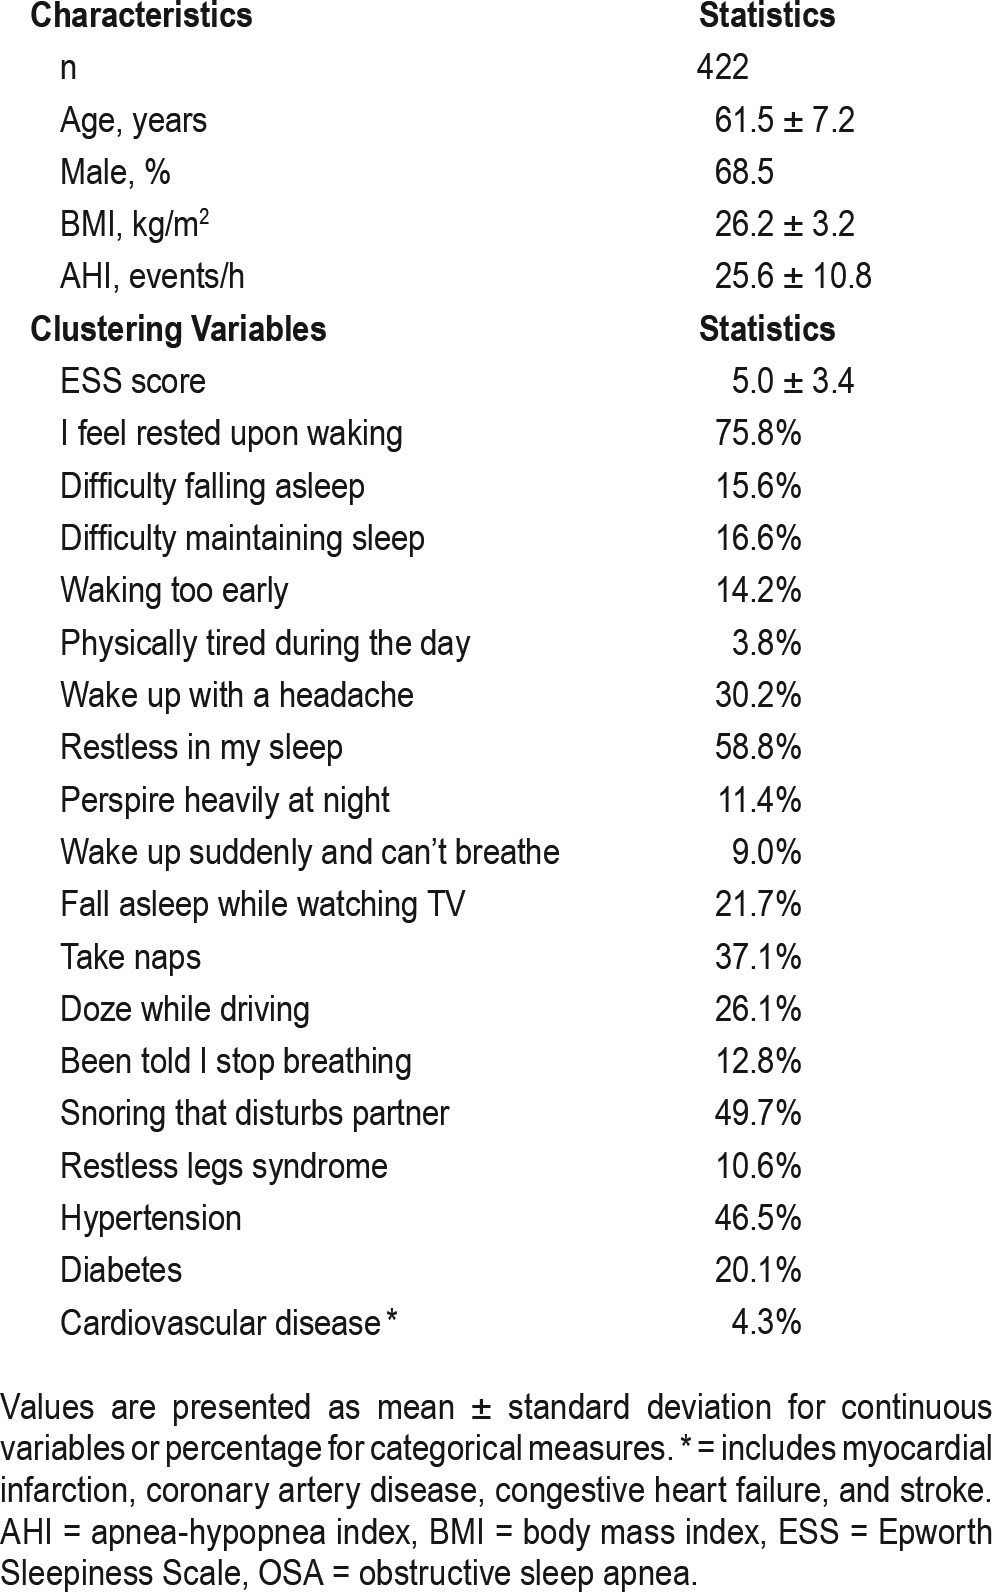
All KoGES participants completed a general questionnaire that includes information on demographics, comorbidities, and current medications. Specific symptom-related questionnaires include daytime sleepiness assessed by the Epworth Sleepiness Scale (ESS),22 as well as questions about nighttime sleep disturbances including insomnia, restless legs syndrome, snoring, and other daytime symptoms. Participants answered questions using the same scale used in ISAC3: 1 = never or less than once per month, 2 = less than once a week, 3 = once or twice a week, 4 = three to five times a week, and 5 = every night or almost daily. In addition to 19 sleep-related symptoms ISAC added four comorbidities to the cluster analyses: hypertension, diabetes, cardiovascular disease, and obstructive pulmonary disease.3 With the intent of examining the applicability of ISAC's three subgroups using KoGES data, we used data from 16 symptoms and 3 comorbidities that were similar to ISAC (see Table 1). To determine the test-retest reliability of the symptom questions, a subset of the participants (n = 200) were retested 4 weeks after the first test; the kappa values were substantial, ranging between 0.60 and 0.72. The three comorbidities—hypertension, diabetes, and cardiovascular disease—were included if diagnosed by a physician or if the patient was currently on medications for these diseases. Cardiovascular diseases included myocardial infarction, other coronary artery diseases, congestive heart failure, and stroke. Obstructive pulmonary disease was excluded because of its very low prevalence (n = 1). Frequency of the symptoms and comorbidities are summarized in Table 1.
Table 1.
Characteristics and clustering variables of patients with moderate to severe OSA.
Statistical Analysis
Clustering analysis was performed using latent class analysis (LCA).23,24 For symptom frequency variables, 16 symptoms and 3 comorbidities were categorized as present if they occurred at least once per week, as done previously in the ISAC analysis.3 For clustering purposes, patients were categorized into four groups based on the ESS score: 0–5, 6–10, 11–15 or > 15, consistent with the criteria suggested in previous studies25,26; continuous values were used when comparing across clusters. In addition to evaluating the a priori three-cluster solution of interest, to determine the optimal number of clusters within KoGES, we used the LCA to obtain clustering solutions for 1 to 10 clusters and compared the resulting Bayesian information criterion (BIC) for each solution. Lower BIC values indicate better model fit; thus, the “optimal clustering solution” was determined as the number of clusters that resulted in the lowest BIC. After determining the optimal number of clusters (C*), we examined, in addition, the clinical interpretations for C* − 1, C* and C* + 1 clustering solutions. The final clustering solution was chosen as whichever gave the clearest clinical interpretations; if all clusters had reasonable interpretations, then C* clusters were chosen as the final solution.
Once the optimal clustering solution was determined, we compared continuous and categorical characteristics across clusters to examine specific cluster characteristics. Continuous variables are summarized with means and standard deviations and comparisons among clusters were done using analysis of variance; results were similar when using nonparametric tests that do not rely on assumptions of normality. Categorical variables are summarized using frequencies and percentages and compared among clusters using chi-square or Fisher exact tests. When a significant difference was observed among clusters (P < .05), we performed between-cluster comparisons to understand which between-group differences were driving overall associations. Results of these comparisons are presented as mean differences for continuous variables or differences in proportions for binary variables, along with associated 95% confidence intervals; given three pairwise comparisons, a value of P < .0167 was considered statistically significant between-cluster difference.
Analyses were performed using SAS Version 9.4 (SAS Institute, Cary, North Carolina, United States), including PROC LCA Version 1.3.2 (Pennsylvania State University, Old Main, State College, Pennsylvania, United States)23 and Stata/SE Version 14.1 (StataCorp LP, College Station, Texas, United States).
RESULTS
Sample Characteristics
A total of 422 KoGES patients with an AHI > 15 events/h were selected to undergo clustering analyses (see Table 1). Mean age was 61.5 years and mean AHI was 25.6 events/h. Participants were predominantly male (68.5%) and overweight (26.2 kg/m2) on average, based on body mass index (BMI).
Clustering Analyses
The a priori three-cluster solution was the optimal clustering solution based on BIC when testing between 1 and 10 clusters in KoGES (see Table 2). Characteristics of the three subgroups are presented in Table 3. Of the three subgroups, the most severely symptomatic in KoGES is Cluster 1 (n = 61 [14.5% of the sample]), which mirrors the disturbed sleep subgroup in ISAC.3 Cluster 1 had the lowest rates of feeling rested upon waking (26%) and the highest ESS score (6.7 ± 4.5). In addition, Cluster 1 had the highest rates of early (77%), middle (89%), and late (56%) insomnia symptoms and the highest rates of hypertension (69%) and diabetes (27.9%). The between-cluster comparisons showed that rates of all insomnia-related symptoms were significantly higher in Cluster 1 than in the other two clusters, whereas no differences in insomnia symptoms, except for difficulty falling asleep, were seen between the other two clusters.
Table 2.
Model-fit statistics for latent class analysis results in KoGES ordered by BIC.
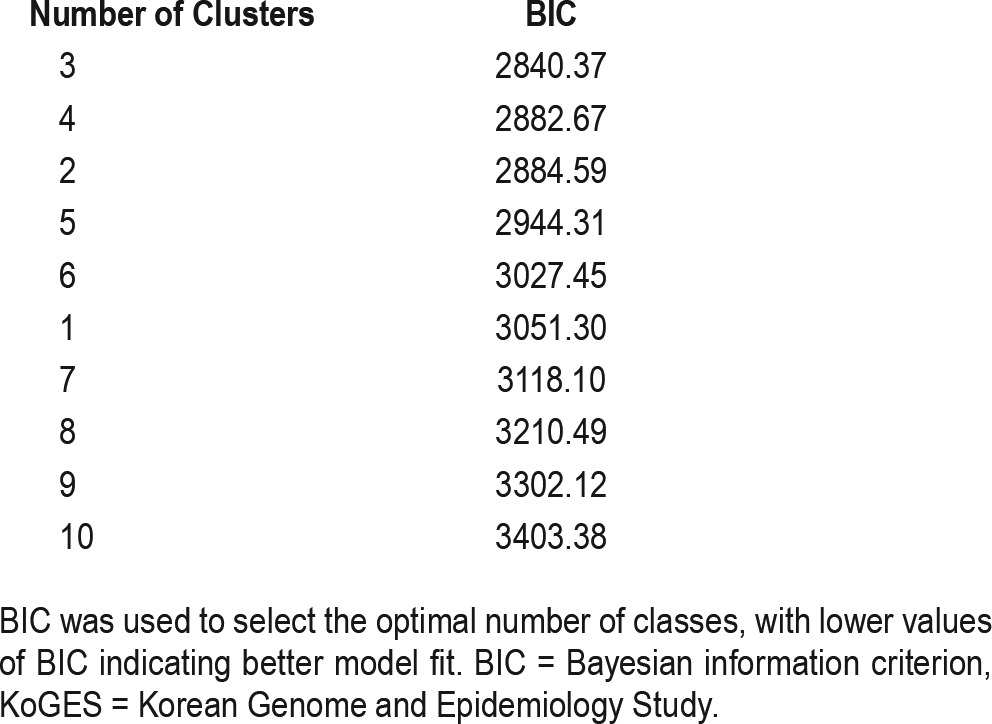
Table 3.
Symptom summary for three-cluster solution.
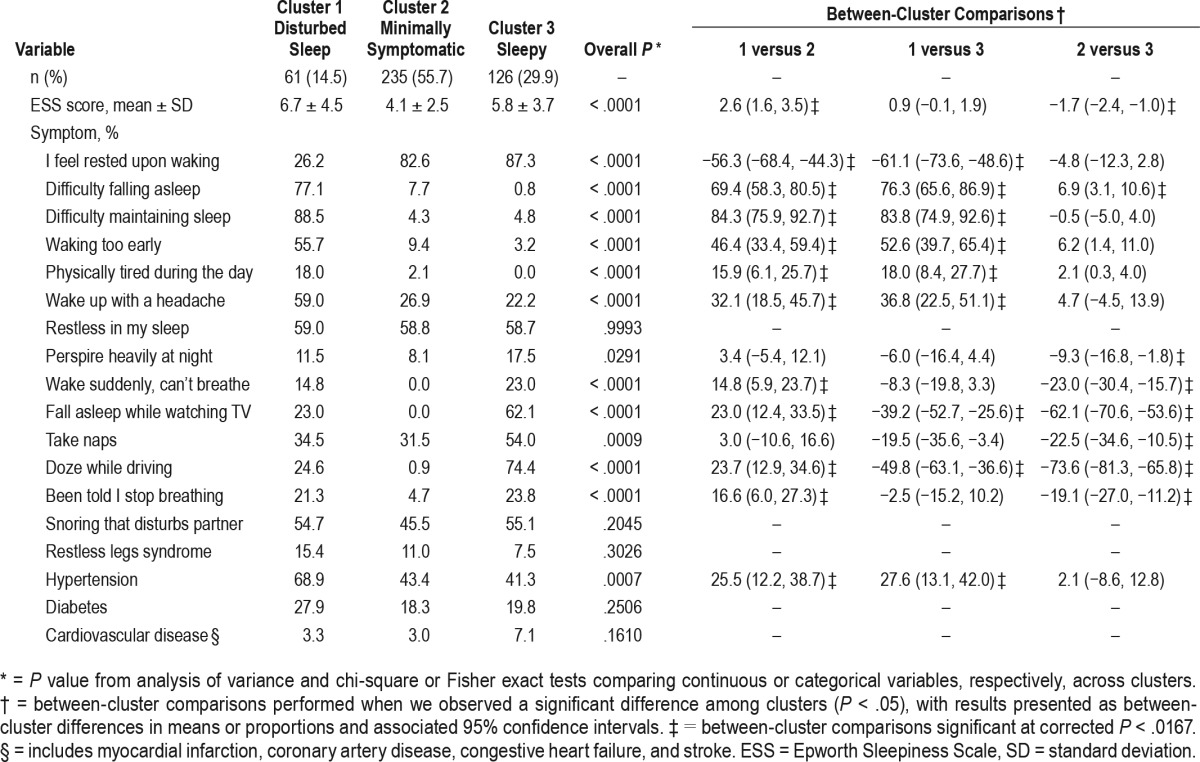
Cluster 2 is the most prevalent cluster, consisting of 55.7% of the population (n = 235), and mirrors the minimally symptomatic subgroup in ISAC. In Cluster 2, < 5% reported gasping or witnessed apneas, < 10% reported insomnia symptoms, and there were generally few complaints of sleepiness. The mean ESS score in this cluster was 4.1 ± 2.5 and 82.6% of subjects reported feeling refreshed upon awakening. A number of variables showed significantly lower prevalence/values in Cluster 2 compared to Clusters 1 and 3 in pairwise comparisons (Table 3), including upper airway symptoms, ESS, and drowsy driving.
Cluster 3 (n = 126 [29.9% of the sample]) most closely resembles the excessively sleepy subgroup in ISAC.3 Cluster 3 has the highest rates of most sleepiness measures, with the exception of ESS scores (5.8 ± 3.7), which reflects the low average ESS throughout the KoGES cohort. Measures corresponding to higher rates of sleepiness in this cluster include 62% falling asleep while watching TV, 54% taking a nap during the day, and 74% reporting drowsy driving. This cluster also has high rates of OSA-associated symptoms, including witnessed apneas and snoring that disturbs a spouse. In pairwise comparisons, rates of these upper airway symptoms were similar to Cluster 1, but more than in Cluster 2. Consistent with high rates of sleepiness, but falling into a distinct cluster other than disturbed sleep patients, < 5% of Cluster 3 reported early, middle, or late insomnia symptoms.
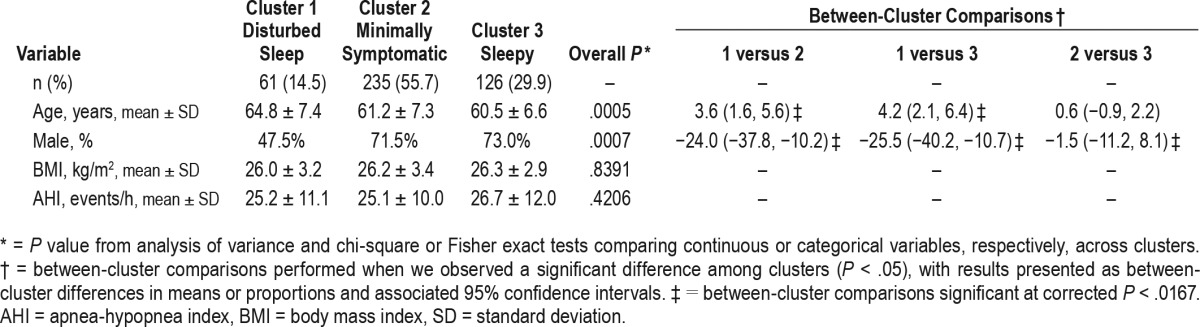
We also compared age, sex, BMI, and OSA severity among the three clusters (Table 4). There were significant differences in age (P = .0005) and sex (P = .0007), but no differences in BMI (P = .839) or AHI (P = .421) between the three clusters. Cluster 1, which includes the highest rates of insomnia-related symptoms, was older and had a much higher proportion of females compared to the other clusters.
Table 4.
Demographic and other characteristics of three-cluster solution.
DISCUSSION
This study identifies three OSA subgroups within Asians from a population-based cohort study that are similar to the three OSA subgroups reported within Caucasians from a clinical sample in Iceland (ISAC): disturbed sleep, excessively sleepy, and minimally symptomatic. Our results suggest that within moderate to severe OSA, the three subgroups may be more widely applicable, irrespective of ethnicity and sample population. Similar to a recent population study in Iceland,18 OSA cases from the KoGES population-based cohort had a lower overall burden of symptoms compared to Iceland's clinical cohort. Thus, the minimally symptomatic subgroup was most prevalent (55.7%) in KoGES, followed by the sleepy (22.9%) subgroup, and the disturbed sleep (14.5%) subgroup was the least prevalent. This is in contrast to the observation that the excessive sleepiness subgroup was most prevalent (42.6%) in the clinical sample from ISAC.3 This difference in overall symptom burden within the KoGES population sample is also reflected in less subjectively reported sleepiness within the clusters and less severe AHI and BMI compared to the ISAC clinical sample. The disturbed sleep subgroup was older and comprised more females than the other subgroups. However, as in the original Iceland study, there were no differences in AHI or BMI among the three subgroups, suggesting differences in individual clinical symptoms despite similar disease severity.
Signs and symptoms reported by patients are critical to early disease detection, as well as evaluation of disease progression and treatment efficacy. Separating patients into subgroups could lead to more patient-centered strategies for personalized care within each subgroup. Several recent studies have clustered patients with OSA into subgroups5,8,9; however, the number of subgroups and characteristics of each subgroup have varied widely because different variables and statistical approaches were used. The ISAC study3 included only daytime and nighttime symptoms and four common comorbidities for the cluster analysis, whereas other studies have included physiological indices of OSA severity or demographics such as age, sex, and BMI.5,8,9 Although the ISAC study focused on clustering patients with moderate to severe OSA, who are relatively consistent in the severity of the disease and presence of the symptoms, Vavougios et al. proposed a classification of all patients who visit sleep clinics.5 Specifically, they retrospectively examined the records of 1,472 consecutive patients to determine subgroups of patients with OSA in Greece.5 Considering the severity of OSA, based on AHI, as well as daytime sleepiness and comorbidity scores, they suggested six OSA subgroups ranging from a healthy subgroup with nighttime sleep-related symptoms to a severe OSA subgroup with severe comorbidities.
Another study from Italy identified three different groups: (1) very severe OSA with obese younger people and a higher comorbidity; (2) moderate-severe OSA with lower hypoxia; and (3) very severe OSA with moderately obese older people who were minimally sleepy.8 All patients with OSA with AHI ≥ 5 events/h were included and the authors, similar to the Greek study, also clustered markers of disease severity. A more recent clustering study, performed by Bailly and colleagues,9 used a large database in the French national registry of sleep apnea, consisting of the records of 18,263 patients with AHI ≥ 15 events/h, thus aligning with the inclusion criteria in the ISAC study.3 In this study, they included various potential correlates, such as demographic characteristics, obesity, lifestyle factors (drinking and smoking habits), sleep duration, and depression, as well as OSA symptoms, in the cluster analysis. Disease severity measurements—AHI or oxygen desaturation levels—were not considered to define the subgroups. As a result, they suggested six OSA subgroups: (1) young, over-weight, minimally symptomatic; (2) young, overweight, symptomatic; (3) old, obese, minimally symptomatic; (4) old, obese, multimorbid; (5) middle age, sleepy, but few symptoms and comorbidities; and (6) middle age, symptomatic, multimorbid.9
Collectively, there is significant discrepancy when clustering OSA into subgroups. Major differences in subgroups are due to the specific clinical features included in analyses—from the addition of polysomnographic variables, to the inclusion criteria of the patients—as well as different statistical methods. Regardless of the specific approaches used, all studies agree on the importance of recognizing and characterizing the heterogeneity of patients with OSA. The strength of the KoGES and ISAC studies lies in both their simplicity and the focus on very specific questions related to symptoms. Focusing on the most common symptoms and comorbidities associated with OSA may allow clinicians to more quickly assess the specific subgroup in which an individual patient belongs.
An important difference between the current study and the ISAC study,3 other than ethnicity, is that KoGES is a population-based sample, whereas ISAC is made up of patients with OSA recruited from the sleep clinic. A recent study conducted within a population-based sample from Iceland18 suggests a high prevalence of moderate to severe OSA within the general population (15.6% of the participants), consistent with that observed in KoGES (14.5%). The relatively low symptom burden of participants with OSA in KoGES is also consistent with results in the Iceland population sample,18 including low average ESS scores (5.0 in KoGES and approximately 7.0 in Iceland) and < 50% of the population reporting most sleep-related symptoms and comorbidities. The lower daytime sleepiness in KoGES, even within the sleepy subgroup, was a clear difference from the original ISAC clinical study.3 However, when questioning about other daytime-sleepiness symptoms—taking naps, falling asleep while watching TV, and dozing while driving—it was determined that these symptoms were highly prevalent in this subgroup in KoGES. This inconsistency between low ESS and high frequency of other daytime sleepiness symptoms among Korean adults has not yet been explored. However, in a Japanese study of urban male workers, the mean ESS score in moderate OSA was also very low (6.4 ± 3.6), and no significant difference in ESS score emerged among different severities of OSA.27 Interestingly, in another Korean study using clinical OSA cases, daytime sleepiness as measured by ESS did not correlate with objective OSA metrics such as AHI and oxygen desaturation.28 Collectively, the data suggest that Koreans may underreport the severity of sleepiness based on the subjective ESS questionnaire, potentially reflecting a cultural norm to not “complain” about sleepiness. In support of this concept, in a study involving multiethnic cancer survivors Asian Americans reported lower pain scores than other ethnic groups.29 Thus, whether ESS is a good indicator to distinguish level of daytime sleepiness among patients with OSA warrants further study in the Korean population. Regardless, insomnia and daytime sleepiness are two of the most common symptoms in subjects with OSA in Korea.30,31
The current study is the first to cluster OSA subjects based on clinical symptoms in Asians from a population-based sample. Thus, additional studies are needed in other Asian ethnicities or other ancestry groups in general, as well as in patient groups who present clinically (as in the original ISAC study), to confirm the generalizability of the three clusters. A potential limitation of this study is the first-night effect, with most participants never experiencing prior sleep studies. However, sleep studies were conducted at participants' homes and only data from those who successfully completed the study with sufficient sleeping time (> 3 hours) were used in the current analysis; therefore, we expect that the first-night effect was minimal.
In conclusion, we propose that the three OSA subgroups— excessively sleepy, disturbed sleep, and minimally symptomatic—originally identified among Caucasians recruited from a sleep clinic, are applicable to those of Asian ancestry with OSA recruited from a population sample. Moreover, these subgroups are present despite the lower symptom burden of the population sample. Because there was no significant difference in OSA severity, determined by AHI, across the three subgroups, the current findings suggest that comprehensive assessment of clinical presentations in OSA, rather than relying on the severity of AHI, will be needed for more precise characterization of patients with OSA at the early stage of diagnosis. Further studies are required to investigate possible differences in prognosis and response to treatment among the three OSA subtypes, which may lead to personalized care-management plans, customized for each symptom subtype. In addition, underlying mechanisms and biomarkers that may differentiate the three OSA symptom subtypes warrant further investigation.
DISCLOSURE STATEMENT
This study was conducted as part of the Korea Genome and Epidemiology Study. This research was supported by a research fund (2011-E71004-00, 2012-E71005-00, 2013-E71005-00, 2014-E71003-00, 2015-P71001-00) by research of Korea Centers for Disease Control and Prevention and NIH grant HL-094307. All authors have seen and approved the manuscript. Dr. Allan I. Pack is the John Miclot Professor of Medicine. Funds for this endowment are provided by the Philips Respironics Foundation (unrelated to this manuscript). All the other authors report no conflicts of interest.
ABBREVIATIONS
- AHI
apnea-hypopnea index
- BIC
Bayesian information criterion
- BMI
body mass index
- ESS
Epworth Sleepiness Scale
- ISAC
Iceland Sleep Apnea Cohort
- KoGES
Korean Genome and Epidemiology Study
- LCA
latent class analysis
- OSA
obstructive sleep apnea
REFERENCES
- 1.Chami HA, Resnick HE, Quan SF, Gottlieb DJ. Association of incident cardiovascular disease with progression of sleep-disordered breathing. Circulation. 2011;123(12):1280–1286. doi: 10.1161/CIRCULATIONAHA.110.974022. [DOI] [PMC free article] [PubMed] [Google Scholar]
- 2.Hla KM, Young T, Hagen EW, et al. Coronary heart disease incidence in sleep disordered breathing: the Wisconsin Sleep Cohort Study. Sleep. 2015;38(5):677–684. doi: 10.5665/sleep.4654. [DOI] [PMC free article] [PubMed] [Google Scholar]
- 3.Ye L, Pien GW, Ratcliffe SJ, et al. The different clinical faces of obstructive sleep apnoea: a cluster analysis. Eur Respir J. 2014;44(6):1600–1607. doi: 10.1183/09031936.00032314. [DOI] [PMC free article] [PubMed] [Google Scholar]
- 4.Oksenberg A, Arons E, Nasser K, Shneor O, Radwan H, Silverberg DS. Severe obstructive sleep apnea: sleepy versus nonsleepy patients. Laryngoscope. 2010;120(3):643–648. doi: 10.1002/lary.20758. [DOI] [PubMed] [Google Scholar]
- 5.Vavougios GD, George DG, Pastaka C, Zarogiannis SG, Gourgoulianis KI. Phenotypes of comorbidity in OSAS patients: combining categorical principal component analysis with cluster analysis. J Sleep Res. 2016;25(1):31–38. doi: 10.1111/jsr.12344. [DOI] [PubMed] [Google Scholar]
- 6.Baldwin CM, Griffith KA, Nieto FJ, O'Connor GT, Walsleben JA, Redline S. The association of sleep-disordered breathing and sleep symptoms with quality of life in the Sleep Heart Health Study. Sleep. 2001;24(1):96–105. doi: 10.1093/sleep/24.1.96. [DOI] [PubMed] [Google Scholar]
- 7.Young T, Palta M, Dempsey J, Skatrud J, Weber S, Badr S. The occurrence of sleep-disordered breathing among middle-aged adults. N Engl J Med. 1993;328(17):1230–1235. doi: 10.1056/NEJM199304293281704. [DOI] [PubMed] [Google Scholar]
- 8.Lacedonia D, Carpagnano GE, Sabato R, et al. Characterization of obstructive sleep apnea-hypopnea syndrome (OSA) population by means of cluster analysis. J Sleep Res. 2016;25(6):724–730. doi: 10.1111/jsr.12429. [DOI] [PubMed] [Google Scholar]
- 9.Bailly S, Destors M, Grillet Y, et al. Obstructive sleep apnea: a cluster analysis at time of diagnosis. PLoS One. 2016;11(6):e0157318. doi: 10.1371/journal.pone.0157318. [DOI] [PMC free article] [PubMed] [Google Scholar]
- 10.Ryan CM, Kendzerska T, Wilton K, Lyons OD. The different clinical faces of obstructive sleep apnea (OSA), OSA in older adults as a distinctly different physiological phenotype, and the impact of OSA on cardiovascular events after coronary artery bypass surgery. Am J Respir Crit Care Med. 2015;192(9):1127–1129. doi: 10.1164/rccm.201507-1472RR. [DOI] [PubMed] [Google Scholar]
- 11.Genta PR, Marcondes BF, Danzi NJ, Lorenzi-Filho G. Ethnicity as a risk factor for obstructive sleep apnea: comparison of Japanese descendants and white males in Sao Paulo, Brazil. Braz J Med Biol Res. 2008;41(8):728–733. doi: 10.1590/s0100-879x2008000800015. [DOI] [PubMed] [Google Scholar]
- 12.Li KK, Kushida C, Powell NB, Riley RW, Guilleminault C. Obstructive sleep apnea syndrome: a comparison between Far-East Asian and white men. Laryngoscope. 2000;110(10 Pt 1):1689–1693. doi: 10.1097/00005537-200010000-00022. [DOI] [PubMed] [Google Scholar]
- 13.Sutherland K, Lee RW, Cistulli PA. Obesity and craniofacial structure as risk factors for obstructive sleep apnoea: impact of ethnicity. Respirology. 2012;17(2):213–222. doi: 10.1111/j.1440-1843.2011.02082.x. [DOI] [PubMed] [Google Scholar]
- 14.Lam B, Ip MS, Tench E, Ryan CF. Craniofacial profile in Asian and white subjects with obstructive sleep apnoea. Thorax. 2005;60(6):504–510. doi: 10.1136/thx.2004.031591. [DOI] [PMC free article] [PubMed] [Google Scholar]
- 15.Ip MS, Lam B, Lauder IJ, et al. A community study of sleep-disordered breathing in middle-aged Chinese men in Hong Kong. Chest. 2001;119(1):62–69. doi: 10.1378/chest.119.1.62. [DOI] [PubMed] [Google Scholar]
- 16.Udwadia ZF, Doshi AV, Lonkar SG, Singh CI. Prevalence of sleep-disordered breathing and sleep apnea in middle-aged urban Indian men. Am J Respir Crit Care Med. 2004;169(2):168–173. doi: 10.1164/rccm.200302-265OC. [DOI] [PubMed] [Google Scholar]
- 17.Kim J, In K, Kim J, et al. Prevalence of sleep-disordered breathing in middle-aged Korean men and women. Am J Respir Crit Care Med. 2004;170(10):1108–1113. doi: 10.1164/rccm.200404-519OC. [DOI] [PubMed] [Google Scholar]
- 18.Arnardottir ES, Bjornsdottir E, Olafsdottir KA, Benediktsdottir B, Gislason T. Obstructive sleep apnoea in the general population: highly prevalent but minimal symptoms. Eur Respir J. 2016;47(1):194–202. doi: 10.1183/13993003.01148-2015. [DOI] [PubMed] [Google Scholar]
- 19.Baik I, Seo HS, Yoon D, Kim SH, Shin C. Associations of sleep apnea, NRG1 polymorphisms, alcohol consumption, and cerebral white matter hyperintensities: analysis with genome-wide association data. Sleep. 2015;38(7):1137–1143. doi: 10.5665/sleep.4830. [DOI] [PMC free article] [PubMed] [Google Scholar]
- 20.Kim J, Pack A, Maislin G, Lee SK, Kim SH, Shin C. Prospective observation on the association of snoring with subclinical changes in carotid atherosclerosis over four years. Sleep Med. 2014;15(7):769–775. doi: 10.1016/j.sleep.2014.03.009. [DOI] [PMC free article] [PubMed] [Google Scholar]
- 21.Iber C, Ancoli-Israel S, Chesson AL, Quan SF for the American Academy of Sleep Medicine. The AASM Manual for the Scoring of Sleep and Associated Events: Rules, Terminology and Technical Specifications. 1st ed. Westchester, IL: American Academy of Sleep Medicine; 2007. [Google Scholar]
- 22.Cho YW, Lee JH, Son HK, Lee SH, Shin C, Johns MW. The reliability and validity of the Korean version of the Epworth sleepiness scale. Sleep Breath. 2011;15(3):377–384. doi: 10.1007/s11325-010-0343-6. [DOI] [PubMed] [Google Scholar]
- 23.Lanza ST, Collins LM, Lemmon DR, Schafer JL. PROC LCA: a SAS procedure for latent class analysis. Struct Equ Modeling. 2007;14:671–694. doi: 10.1080/10705510701575602. [DOI] [PMC free article] [PubMed] [Google Scholar]
- 24.Lanza ST, Dziak JJ, Huang L, et al. PROC LCA & PROC LTA Users' Guide Version 1.3.2. [Accessed January 30, 2018]. https://methodology.psu.edu/downloads/proclcalta. Published 2015.
- 25.Johns MW. A new method for measuring daytime sleepiness: the Epworth sleepiness scale. Sleep. 1991;14(6):540–545. doi: 10.1093/sleep/14.6.540. [DOI] [PubMed] [Google Scholar]
- 26.Ball S, Bax A. Self-care in medical education: effectiveness of health-habits interventions for first-year medical students. Academic Med. 2002;77(9):911–917. doi: 10.1097/00001888-200209000-00023. [DOI] [PubMed] [Google Scholar]
- 27.Chin K, Oga T, Takahashi K, et al. Associations between obstructive sleep apnea, metabolic syndrome, and sleep duration, as measured with an actigraph, in an urban male working population in Japan. Sleep. 2010;33(1):89–95. doi: 10.1093/sleep/33.1.89. [DOI] [PMC free article] [PubMed] [Google Scholar]
- 28.Ryu HS, Lee SA, Lee GH, Chung YS, Kim WS. Subjective apnoea symptoms are associated with daytime sleepiness in patients with moderate and severe obstructive sleep apnoea: a retrospective study. Clin Otolaryngol. 2016;41(4):395–401. doi: 10.1111/coa.12659. [DOI] [PubMed] [Google Scholar]
- 29.Im EO, Ko Y, Chee W. Symptom clusters among multiethnic groups of cancer patients with pain. Palliat Support Care. 2013;11(4):295–305. doi: 10.1017/S1478951512000314. [DOI] [PMC free article] [PubMed] [Google Scholar]
- 30.Chung KF. Insomnia subtypes and their relationships to daytime sleepiness in patients with obstructive sleep apnea. Respiration. 2005;72(5):460–465. doi: 10.1159/000087668. [DOI] [PubMed] [Google Scholar]
- 31.Smith S, Sullivan K, Hopkins W, Douglas J. Frequency of insomnia report in patients with obstructive sleep apnoea hypopnea syndrome (OSAHS) Sleep Med. 2004;5(5):449–456. doi: 10.1016/j.sleep.2004.03.005. [DOI] [PubMed] [Google Scholar]