Abstract
Objectives
To compare outcomes and healthcare utilization of older patients who did versus did not fill opioid prescriptions within 90 days of initiating care for low back pain.
Materials and Methods
For patients ≥ 65 years with new back pain visits, we used propensity scores to match those who filled no opioid prescriptions to those who filled ≥2 opioid prescriptions within 90 days (and the first opioid prescription within 30 days) of the index visit. Over 24 months, we examined patient-reported outcomes, healthcare utilization, and subsequent opioid prescription fills.
Results
Among 1954 patients eligible for matching, 238 (12%) filled ≥2 opioid prescriptions within 90 days; 200 of these were matched to controls. Patients with versus without early opioid prescriptions had similar patient-reported outcomes but were more likely to have filled ≥1 opioid prescription 18–24 months after the index visit (odds ratio (95% CI) = 2.4 (1.5–3.9)) and to have had ≥1 visit to the emergency department in the subsequent 24 months (OR 1.6; 95% CI 1.0–2.5).
Discussion
Among older patients with new back pain visits, filling ≥2 opioid prescriptions within 90 days of a the visit was associated with similar back pain-related outcomes but increased likelihood of filling opioid prescriptions 18–24 months later compared to matched patients who did not fill early opioid prescriptions.
Keywords: Low back pain, Opioids, Patient-reported outcomes, Roland-Morris Disability Questionnaire (RDQ)
Introduction
Low back pain in older adults is common and can result in substantial disability [1, 2]. Opioids are widely prescribed early in the course of low back pain, in spite of guideline recommendations against this practice [3–7]. Furthermore, some research has shown associations between opioid prescriptions and poor outcomes, including worse pain and function after six months [8], increased likelihood of surgery [9], increased risk of long-term disability [9, 10], and increased likelihood of use of opioids up to two years later [9]. Additionally, chronic opioid therapy has been associated with more overall healthcare utilization as well as increased risk of opioid dependence, abuse, and overdose [11–13].
Although much research has been devoted to characterizing opioid use among middle-aged and younger low back pain patients [14, 15], less research has focused on opioid use among older adults. This is of particular importance because the proportion of the U.S. population 65 years and older is increasing dramatically. Additionally, older adults are more susceptible to the adverse effects of opioids such as falls [16], sedation, constipation, and confusion [17]. Although rates of opioid abuse are lower in older adults compared to younger populations, the mortality rate resulting from misuse of opioids among older adults has increased steadily in the past decade [18].
We used data from a longitudinal cohort study of older patients with new episodes of care for low back pain. The purpose of these secondary analyses was to compare patient-reported outcomes (PROs), subsequent opioid use, and healthcare utilization over 24 months among patients who filled ≥2 prescriptions for opioids within 90 days of initiating care to a matched group of patients who received no opioid prescriptions during this time. We hypothesized that patients who filled ≥2 opioid prescriptions within 90 days would have, on average, worse subsequent pain, function, and quality of life and greater healthcare utilization compared to otherwise similar patients who did not fill opioid prescriptions within 90 days of their index low back pain visits.
Materials and Methods
Study Design
The Back pain Outcomes using Longitudinal Data (BOLD) study was a prospective, longitudinal cohort study of patients aged 65 years or older seeking care for low back pain at primary care clinics, urgent care clinics, or emergency departments who did not have healthcare visits for back pain within the previous six months [19, 20]. Of the 13,376 patients identified as potentially eligible, 15% could not be contacted, 15% were ineligible, and 27% declined to participate [20]. Index visits took place between March 2011-March 2013 at three study sites: Henry Ford Health System, Kaiser Permanente Northern California (Kaiser), and Harvard Vanguard Medical Associates. However, analyses for this manuscript were restricted to participants from Kaiser because that was the only site with complete filled prescription data. All participants provided informed consent and we obtained institutional review board approval from each institution.
Opioid Exposure Assessment
We counted dispensed prescriptions from Kaiser electronic pharmacy data as opioids if any words in the drug name fields for each prescription matched to the terms for brand name or generic opioids listed in Supplemental Digital Content 1. We defined patients who filled ≥2 prescriptions for opioids within 90 days (with the first opioid prescription being filled within ≤30 days) of their index visit dates, including prescriptions filled on the date of the index visit, as early opioid recipients. We also calculated the mean daily morphine equivalent dose (MED) from the day of the index back pain visit through 90 days later for the early opioid group [21].
Patient-Reported Outcome Measures
At the initial assessment, which occurred 0–31 days after the index visit, we collected demographic data and patients provided information about their back pain, including how long they had had back pain and their level of confidence that the back pain would resolve in three months (on a scale of 0–10). At the initial assessment and at 3, 6, 12, and 24 months after the initial assessment, patients completed measures of back pain-related disability, pain severity, and health-related quality of life. The pre-specified primary outcome was the Roland-Morris Disability Questionnaire (RDQ), consisting of 24 questions, modified to assess both back and leg pain-related physical disability [22, 23]. Scores range from 0–24, with higher scores indicating worse function. We also analyzed the number of patients who had ≥30% improvement (which some consider to be the minimal clinically important improvement) [24] in RDQ scores between the initial and 24-month assessments. We also queried patients on the Brief Pain Inventory (BPI) Interference scale [25], which assessed back pain interference with usual activities. This score ranges from 0–10, with higher scores indicating greater interference with activities [26]. We assessed quality of life using the EuroQoL Group (EQ-5D) Index, a measure that examines mobility, self-care, usual activities, pain/discomfort, and anxiety/depression [27]. This score ranges from 0–1, with 0 indicating death and 1 indicating perfect health. We also investigated the EQ visual analog scale (EQ-5D-VAS), a quality of life assessment scored from 0 (worst imaginable health state) to 100 (best imaginable health state) [27]. We also included the Patient Health Questionnaire-4 (PHQ-4), a screen for depression and anxiety [28]. The scale ranges from 0–12, with higher scores indicating greater depression/anxiety. Finally, patients reported their average back and leg pain intensity in the previous week, rated separately on a 0–10 numerical rating scales (NRS) [29].
Relative Value Units (RVUs)
We obtained electronic health record (EHR) data from 12 months prior to the index visit date until 24 months later. These data contained information about hospitalizations and outpatient visits, including Current Procedural Terminology (CPT) codes [30] for each procedure or visit. We mapped each CPT code to its year-specific relative value unit (RVU) [31–34]. For each patient, we summed RVUs accumulated from the index visit date through 24 months later and separately summed all RVUs accumulated in the 12 months prior to the index visit date. Similarly, we summed RVUs that were specific to the diagnosis and treatment of back pain (hereafter termed “spine-specific” RVUs) for healthcare utilization between the index visit and 24 months. When possible, we used an algorithm that combined CPT and International Classification of Diseases, Clinical Modification (ICD-9-CM) codes [35] to determine whether RVUs were spine-specific; however, most of the data did not include ICD-9-CM codes. Because some CPT codes are generic (e.g., evaluation and management visits), we only counted procedures as spine-related if they took place on the same date as other spine-related CPT codes (e.g., x-ray of lumbar spine) or if they occurred on the index visit date. We subdivided spine RVUs into those for injection therapy, spine imaging, and spine surgery. We included physical therapy in overall, but not spine-related, RVUs, because we often could not be certain that physical therapy was spine-related. Additionally, some data in the EHR included patient encounters for procedures such as vaccinations that did not include CPT codes. We assigned these the year-appropriate RVUs for CPT code 99211, a 5-minute evaluation and management visit that did not involve physician interaction.
Opioid Prescription, Emergency Department Visits, and Hospitalization Outcomes
We counted the number of opioid prescriptions filled from the end of month 3 until the end of 24 months, as well as in the 3- <6, 6- <12, 12-<18, and 18–24 month periods following the index visit dates. We also used the EHR data beginning with the index visit through 24 months to assess the number of emergency department (ED) visits and hospitalizations.
Exclusion Criteria
Prior to matching, we excluded patients who had had lumbar spine surgery in the year before their index visit dates and patients who withdrew from the study or died within 24 months of their index visits. We also excluded patients who had filled prescriptions for ten or more days’ supply of opioids within the six months prior to their index visits because we wanted our analysis to exclude patients with substantial recent opioid use, but allow patients who filled short-term opioid prescriptions for indications such as dental procedures. We also excluded patients who filled only one opioid prescription in days 0–90, because some evidence indicates that opioid users often consume less opioid medication than they are prescribed [36] and we assumed that patients who filled at least two prescriptions were more likely to have actually consumed the medication. Finally, we excluded patients who filled their first opioid prescriptions >30 days after their index back pain visits because they might have differed importantly from patients who filled opioids prescriptions soon after their index visits.
Propensity Matching
We matched patients who filled early opioid prescriptions to patients who did not. We used propensity score matching because filling two or more early opioid prescriptions was infrequent in this population and propensity-score matching was a statistically efficient method to adjust for the many variables that we suspected would act as confounders in the relationship between filling early opioid prescriptions and the outcomes of interest [37]. We constructed a propensity score [38] as the logit function of the probability of receiving ≥2 early opioid prescriptions for patients with specific characteristics that have previously been found to be associated with receipt of opioid prescriptions [39], including gender [40, 41], age [40, 41], race [40], Hispanic ethnicity [40], education [40], smoking status [42], marital status [41], Quan co-morbidity category [40, 43], and initial patient-reported back pain and function scores [41]. We also matched for back pain characteristics that we theorized were related to opioid prescriptions, including back pain diagnosis at the index visit (categorized as axial back pain, back and leg pain, spinal stenosis, or other), back pain duration, and confidence that the back pain would resolve within three months. We also believed that RVUs in the 12 months prior to the index visit would be associated with receipt of early opioid prescriptions as well as utilization in the 24 months after the index back pain visits. Because initial PROs were almost always assessed after first opioid prescriptions had been filled and therefore might have been affected by opioid use, we also matched on the number of days between the index back pain visit and the initial PRO assessment. We matched each patient who filled ≥2 early opioid prescriptions to the closest control patient using a greedy algorithm, which found the closest match of early opioid prescription recipients to non-early opioid prescription recipients without replacement until no further matches could be identified [44].
Statistical analysis
To compare characteristics of patients who filled early opioid prescriptions with those of matched patients who did not, we used McNemar’s tests for categorical variables and paired t-tests for continuous variables. We used linear mixed effects models to compare each PRO measured at the initial assessment, and at 3, 6, 12, and 24 months of those who filled early opioid prescriptions to those who did not. We used generalized linear regression to compare total RVUs and spine-specific RVUs from the index visit through 24 months later for patients who filled early opioid prescriptions versus those who did not. We also used generalized linear models with log link and Poisson distribution to evaluate the relationships between filling ≥2 early opioid prescriptions and counts of ED visits, hospitalizations and the number of opioid prescriptions filled from days 91–730. Because most patients did not have any ED visits or hospitalizations, we compared counts of ED visits and hospitalizations only among patients with at least one of these in each respective analysis.
We used conditional logistic regression to analyze the odds of having ≥30% improvement in RDQ between the initial PRO assessment and 24 months, having ≥1 ED visit, having ≥1 hospitalization between the index visit and 24 months, and having ≥1 fill of opioid prescriptions in the 3-<6, 6-<12, 12-<18, and 18–24 month periods after the index back pain visits. We decided a priori to adjust all models for sex, age, baseline back/leg pain diagnosis category, baseline back pain duration, and RVUs in the 12 months prior to the index visit, even after matching for these variables, because we hypothesized that there might be residual confounding due to these variables. Finally, to examine differences in trends in utilization over time, we examined unadjusted, summed RVUs per month between the 12 months prior to the index visit through 24 months after the index visit, stratified on early receipt of opioid prescriptions. We then performed t-tests to examine the unadjusted differences between cumulative RVUs between the two opioid groups: one t-test examined the difference in cumulative RVUs in the pre-index visit period and the other test analyzed the post-index visit period. We performed all analyses using SAS 9.4 (Cary, NC).
Sensitivity Analyses
We performed several sensitivity analyses of these data. First, we conducted all of the analyses described above, except we did not include initial PROs and the number of days between the index back pain visit and the first PRO assessment as matching variables. We also performed the same analyses as above except we included the patients who filled only one opioid prescription in days 0–90. Finally, we considered assessing and adjusting for pain medications besides opioids, but we did not have access to data on over-the-counter pain medications. We did, however, perform the same analyses described above and included an adjustment variable for prescription fills of acetaminophen, non-steroid anti-inflammatory drugs (NSAIDs), and skeletal muscle relaxants.
Results
Patient characteristics
The flow of patients in the study is shown in Figure 1. Among the 1210 excluded patients, 497 (41% of those excluded) filled prescriptions for 10+ days’ supply of opioids in the 6 months before the index visit date; 3 (0.2%) had lumbar spine surgery in the year prior to the index visit; 131 (11%) withdrew from the study within 24 months; 37 (3%) died within 24 months, 135 (11%) filled two opioids within 90 days of the index visit, but filled their first prescription more than 30 days after the index visit; and 407 (34%) filled only one opioid prescription in days 0–90. Of the 1954 patients eligible for the matched analysis, 238 (12%) received at least two opioid prescriptions within 90 days (and the first prescription within 30 days) of their index back pain visits. The final matched analysis included 200 patients who did not have early opioid prescriptions and 200 patients who did.
Figure 1.
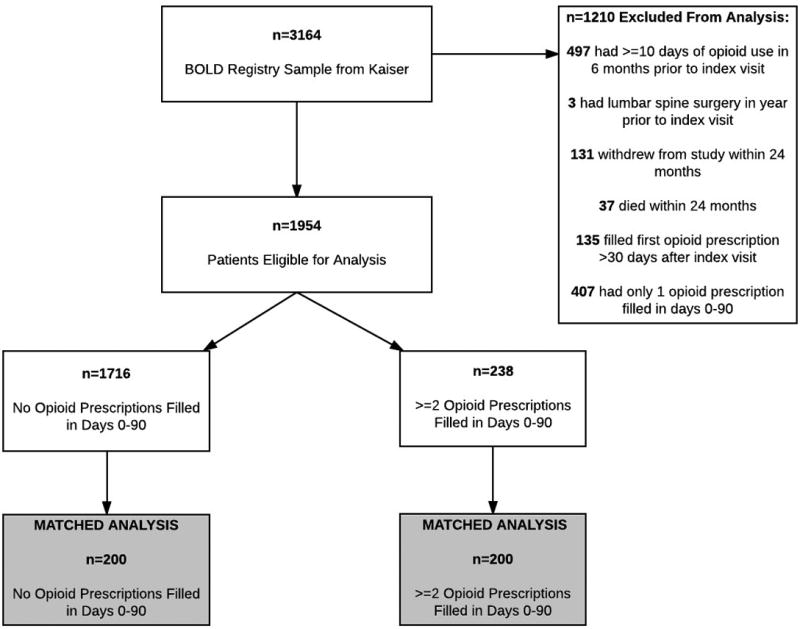
Study Sample.
Table 1 shows characteristics of the matched group of patients who did not fill early opioid prescriptions compared to those who did. We observed no statistically significant differences on the matching variables between the two groups. Patients who received early opioid prescriptions filled their first prescriptions a mean of 3 days after their index visits; 63% of patients filled their first opioid prescription on the same day as their index visits (data not shown). Patients who filled early opioid prescriptions were also more likely to have filled non-opioid pain medications in the first 90 days after the index back pain visit. The number of days between the index back pain visit and the first PRO assessment were closely matched between the group that did and did not fill early opioid prescriptions (Supplemental Digital Content 2).
Table 1.
Characteristics of patients with no early opioid prescriptions compared to those with ≥2 opioid prescriptions. Shaded rows indicate variables used for propensity matching.
| No Opioid Rx Days 0–90 (n, %) n=200 |
≥2 Opioid Rx Days 0–90 (n, %) n=200 |
p-value | |
|---|---|---|---|
| Female | 129 (65%) | 131 (66%) | 0.83 |
| Age (Mean ± Std. Dev) | 73 ± 6 | 73 ± 7 | 0.56 |
| Race | |||
| Black | 9 (5%) | 14 (7%) | |
| Native American | 1 (1%) | 1 (1%) | |
| Hawaiian/Pacific Islands | 3 (2%) | 2 (1%) | 0.92 |
| Asian | 10 (5%) | 10 (5%) | |
| White | 159 (80%) | 157 (79%) | |
| Other/multiple | 18 (9%) | 16 (8%) | |
| Hispanic Ethnicity | 15 (8%) | 13 (7%) | 0.70 |
| Education | |||
| High school or less | 55 (28%) | 47 (24%) | |
| Some college | 72 (36%) | 74 (37%) | 0.64 |
| College graduate or more | 73 (37%) | 79 (40%) | |
| Smoking Status | |||
| Never smoked | 97 (49%) | 95 (48%) | |
| Quit>1 year ago | 91 (46%) | 94 (47%) | 0.95 |
| Current smoker | 12 (6%) | 11 (6%) | |
| Living with partner | 129 (65%) | 126 (63%) | 0.76 |
| Quan Comorbidity 0–1 | 47 (24%) | 43 (22%) | |
| Quan Comorbidity 2 | 66 (33%) | 75 (38%) | 0.64 |
| Quan Comorbidity 3–17 | 87 (44%) | 82 (41%) | |
| Baseline Diagnosis | |||
| Axial Back Pain | 122 (61%) | 114 (57%) | |
| Back and Leg Pain | 61 (31%) | 67 (34%) | |
| Spinal Stenosis | 5 (3%) | 8 (4%) | 0.73 |
| Other | 12 (6%) | 11 (6%) | |
| Back Pain Duration | |||
| <1 month | 101 (51%) | 110 (55%) | |
| 1–6 months | 64 (32%) | 54 (27%) | 0.54 |
| >6 months | 35 (18%) | 36 (18%) | |
| RVUs year prior (Mean ± Std. Dev) | 33 ± 71 | 33 ± 56 | 0.97 |
| Confidence (0–10) back pain would be gone in 3 months (Mean ± Std. Dev) | 7 ± 3 | 7 ± 3 | 0.99 |
| Days between index visit and initial PRO assessment (Mean, ± Std. Dev) | 16 ± 4 | 16 ± 4 | 0.94 |
| Initial PROs (Mean ± Std. Dev) | |||
| RDQ | 12.3 ± 5.5 | 13.1 ± 5.7 | 0.86 |
| BPI | 4.7 ± 2.4 | 4.7 ± 2.3 | 0.78 |
| EQ-5D Index | 0.7 ± 0.2 | 0.7 ± 0.2 | 0.51 |
| EQ-5D VAS | 72.4 ± 18.1 | 69.6 ± 18.8 | 0.11 |
| PHQ4 | 2.5 ± 2.9 | 2.6 ± 2.7 | 0.88 |
| Back Pain Intensity (0–10) Past Week | 5.7 ± 2.6 | 5.7 ± 2.7 | 0.94 |
| Leg Pain Intensity (0–10) Past Week | 4.1 ± 3.3 | 4.2 ± 3.5 | 0.71 |
|
| |||
| Index Visit Setting | |||
| Primary Care Provider | 198 (99%) | 195 (98%) | |
| Urgent Care | 2 (1%) | 2 (1%) | 0.22 |
| Emergency Room | 0 | 3 (2%) | |
| Baseline Interview Method | |||
| Phone | 194 (97%) | 193 (97%) | 0.78 |
| 6 (3%) | 7 (3%) | ||
| Missed Follow-Up | |||
| 3 Months | 19 (10%) | 16 (8%) | 0.60 |
| 6 Months | 17 (9%) | 21 (11%) | 0.50 |
| 12 Months | 16 (8%) | 16 (8%) | 0.99 |
| 24 Months | 27 (14%) | 25 (13%) | 0.77 |
| Days between index visit and 1st opioid Rx (Mean ± Std. Dev) | -- | 3 ± 7 | -- |
| Average daily Mg MED from Days 0–90 (Mean ± Std. Dev) | -- | 9.0 ± 8.8 | -- |
| ≥1 Fill of Prescription Non-Opioid Pain Medications from Days 0–90 | 85 (43%) | 113 (57%) | 0.01 |
Abbreviations:
Rx=Prescription; Std. Dev=Standard deviation; RVUs=Relative value units; PRO=Patient-reported outcome; RDQ=Roland Morris Disability Questionnaire (scale 0–24); higher=worse function; BPI=Brief Pain Index (scale 0–10); higher=worse interference with activities; EQ-5D Index=EuroQol Group Index (scale 0–1); 0=death; 1=perfect health; EQ-5D VAS=EuroQol Group Visual Analog Scale (scale 0–100); 0=worst imaginable health state, 100=best imaginable health state; PHQ4=Patient Health Questionnaire (scale 0–12); higher=greater depression/anxiety; MED=Morphine Equivalent Dose; Mg=Milligrams
Patient Outcomes
Pain and functional outcomes among patients who did and did not fill prescriptions for early opioids improved over the 24-month study period are shown in Figures 2a-2g. While pain and functional outcomes improved in both groups, we observed no meaningful differences in PROs at any time point between those who filled early opioid prescriptions compared to those who did not. In the sensitivity analyses in which we did not match on initial PROs and the number of days from the index back pain visit until the initial PRO interview (Supplemental Digital Content 3a-3g), we observed that patients in the early opioid group had worse pain and function at the first PRO assessment relative to those who did not fill early opioid prescriptions. Patients in both groups improved over time on average, but the scores of early opioid prescription recipients were generally worse through the 24-month assessments. In the sensitivity analyses in which we included patients who filled only 1 opioid prescription among the early opioid group (Supplemental Digital Content 4a-4g) and the analyses in which we adjusted for non-opioid prescription pain medication fills (Supplemental Digital Content 5a-5g), we observed similar trends as the primary analysis; that is, no meaningful differences in PROs at any time points.
Figure 2.
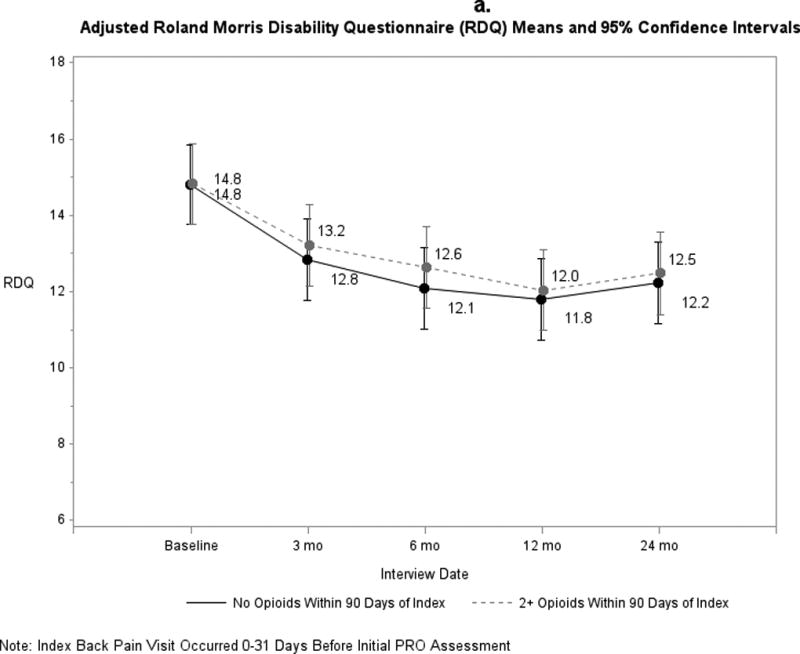
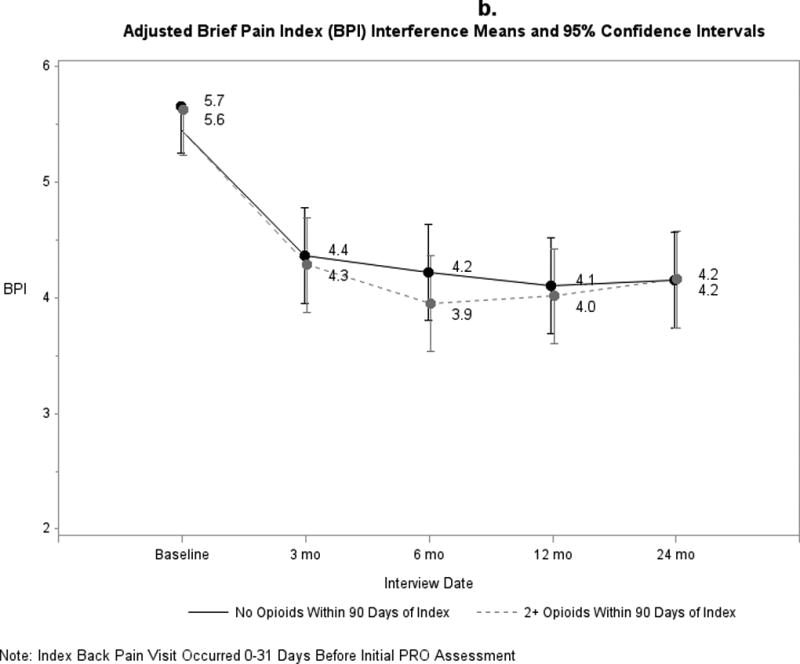
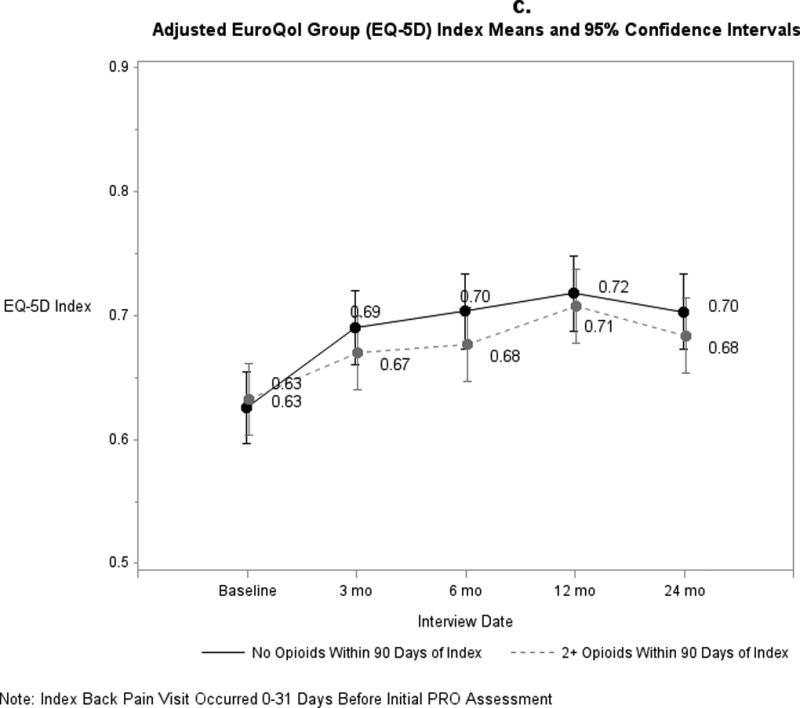
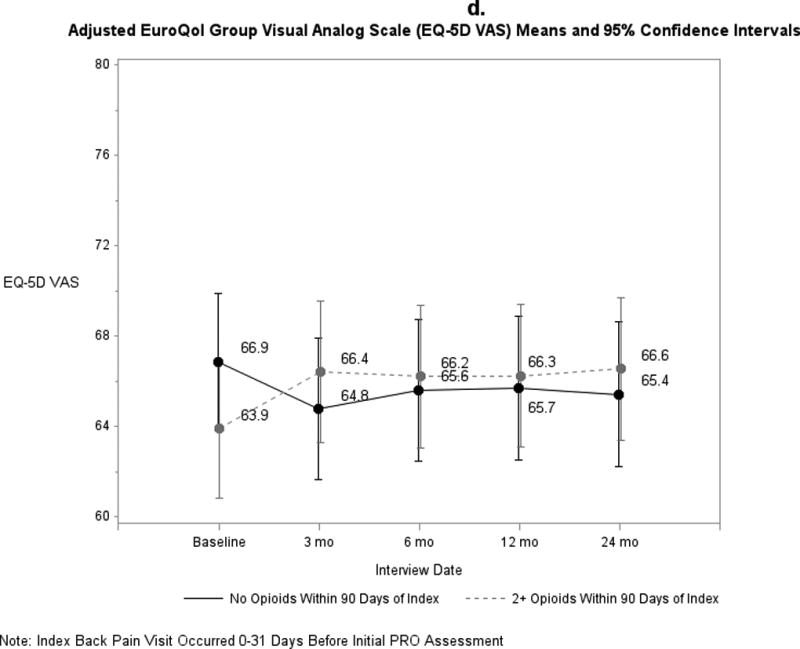
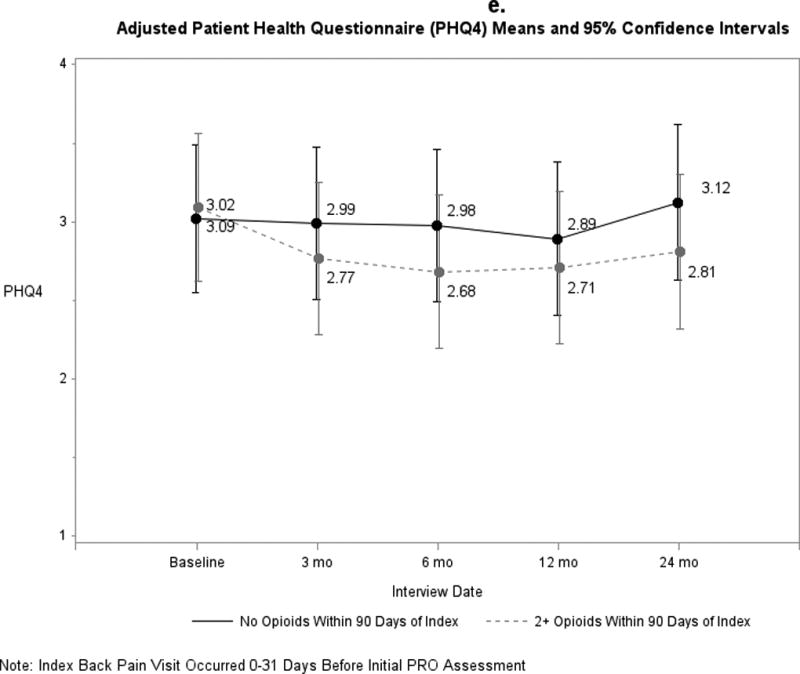
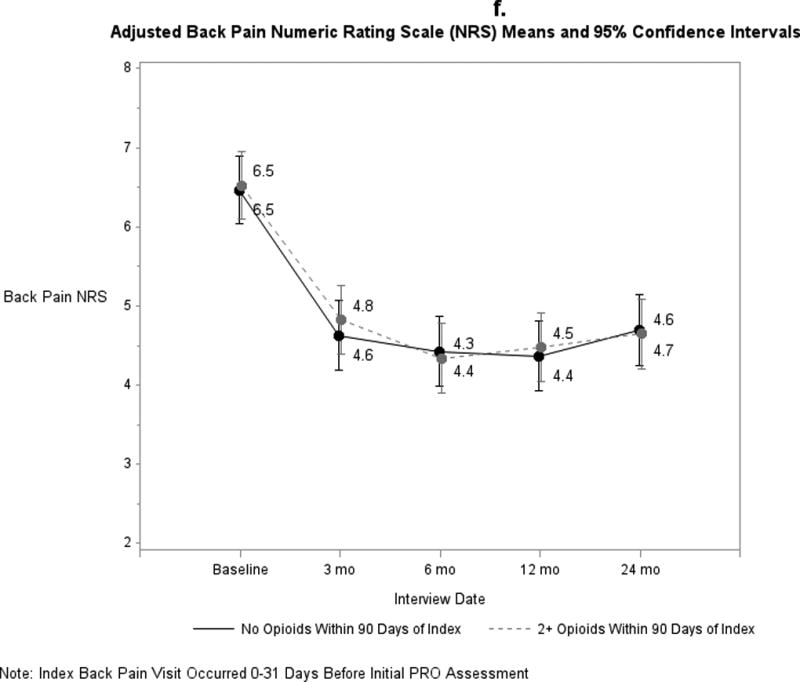
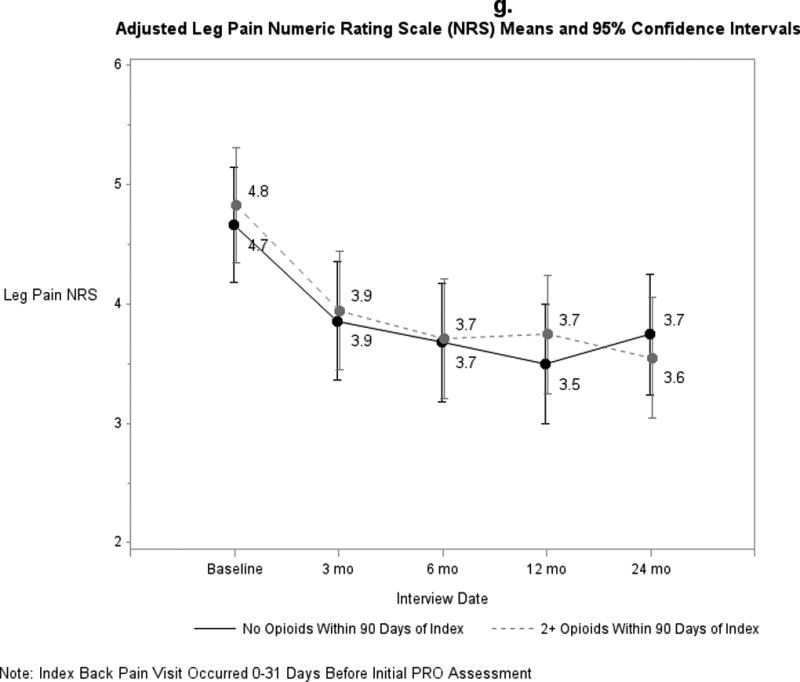
a-g. Adjusted means and 95% confidence intervals of patient-reported outcomes (PROs) among patients who had ≥2 early opioid prescriptions compared to those who did not.
Compared with those who did not, patients who filled early opioid prescriptions did not differ significantly in overall utilization (adjusted mean difference in 24-month cumulative RVUs of 38; 95% confidence interval (95% CI): −5.4, 82) (Table 2) or spine-specific RVUs. We did observe a borderline statistically significant difference in spine injection RVUs (adjusted mean difference of 2.0; 95% CI: 0.8, 3.3).
Table 2.
Associations between utilization and ≥2 opioid prescriptions.
| No Early Opioid Rx (n=200) |
≥2 Early Opioid Rx’s (n=200) |
Generalized Linear Regression Estimate (95% CI)a |
p-value | |
|---|---|---|---|---|
| 24-month RVUs, mean, median (IQR) | ||||
| Overall | 130, 55 (31–140) | 170, 81 (39–170) | 38 (−5.4, 82) | 0.09 |
| Overall Spine | 24, 3.3 (1.5–13) | 51, 3.7 (1.7–18) | 25 (−4.4, 55) | 0.90b |
| Spine Injections | 0.8, 0 (0); (n=16)c | 2.9, 0 (0); (n=45)c | 2.0 (0.8, 3.3) | 0.05b |
| Spine Imaging | 5.0, 1.0 (0–11); (n=105)c | 7.2, 1.2 (0–12); (n=139)c | 2.3 (0.5, 4.0) | 0.16b |
| Spine Surgery | 14, 0 (0); (n=5) | 35, 0 (0); (n=10)c | 19 (−7.7, 45) | 0.90b |
| Physical Therapy-Any | 4.4, 2.2 (0–5.8); (n=114)c | 4.6, 3.1 (0–7.1); (n=116)c | 0.2 (−1.1, 1.5) | 0.90b |
| # ED Visits among patients with ≥1 ED visit, mean, median (IQR) | 2.6, 2 (1–3) | 2.5, 2 (1–3) | 0.03 (−0.2, 0.3) | 0.81 |
| # Hospitalizations among patients with ≥1, mean, median (IQR) | 1.6, 1 (1–2) | 1.4, 1 (1–2) | −0.2 (−0.3, −0.004) | 0.05 |
| # of Opioid Prescriptions between months >3–24, mean, median (IQR) | 1.2, 0 (0–2) | 4.5, 1.5 (0–7) | 3.3 (2.3, 4.4) | <0.0001 |
|
| ||||
|
No Early Opioid Rx (n=200) |
≥2 Early Opioid Rx’s (n=200) |
Odds Ratio Estimate (95% CI)a | p-value | |
|
| ||||
| ≥1 ED Visit in 24 mo. after index visit | 78 (39%) | 95 (47%) | 1.6 (1.0–2.5) | 0.04 |
| ≥1 Hospitalization in 24 mo. after index visit | 44 (22%) | 44 (22%) | 1.1 (0.6, 1.9) | 0.75 |
| RDQ Improved ≥30% between baseline and 24 months, n (%) | 70 (40%) | 71 (41%) | 1.2 (0.6, 2.1) | 0.63 |
| ≥1 opioid Rx 3-<6 months after index visit, n (%) | 35 (18%) | 85 (43%) | 3.0 (1.8, 5.0) | <0.0001 |
| ≥1 opioid Rx 6-<12 months after index visit, n (%) | 37 (19%) | 93 (47%) | 3.8 (2.2, 6.6) | <0.0001 |
| ≥1 opioid Rx 12-<18 months after index visit, n (%) | 39 (20%) | 90 (45%) | 4.0 (2.2, 7.3) | <0.0001 |
| ≥1 opioid Rx 18-<24 months after index | 36 (18%) | 81 (41%) | 3.0 (1.7, 5.1) | <0.0001 |
Adjusted for sex, age, diagnosis (non-specific, back and leg, or other), back pain duration, and total RVUs in the year prior to the index visit.
p-values adjusted using the stepdown Bonferroni method
Number of people who had >0 RVUs in that category
Abbreviations: Rx=Prescription; CI=Confidence interval; RVUs=Relative value units; IQR=Interquartile Range (quartile 1 to quartile 3); RDQ=Roland Morris Disability Questionnaire (scale 0–24); higher=worse function
Patients who filled early opioid prescriptions filled a greater number of opioid prescriptions from months 3–24 (mean difference 3.3 (2.3, 4.4) but had slightly fewer hospitalizations in the subsequent 24 months (adjusted mean difference −0.2 (−0.3, −0.004) relative to patients who did not fill early opioid prescriptions. Patients who filled early opioid prescriptions were more likely to have had at least 1 ED visit in the 24 months after index and to have filled at least 1 opioid prescription in the 3-<6, 6-<12, 12-<18, and 18–24 month periods after the index visit. Similar proportions in each group had RDQ improvement by at least 30% between the initial PRO assessment and 24 months.
Results were similar in the sensitivity analyses (Supplemental Digital Content 6–8), We also found equal proportions of patients with ≥30% RDQ improvement among patients who did and did not fill prescriptions for early opioids. .
The number of RVUs accumulated per month between 12 months prior to the index visit and 24 months after the index visit, stratified by whether ≥2 early opioid prescriptions were filled, is shown in Figure 3. Prior to their index visits, patients who did not fill early opioid prescription had similar utilization compared to those who did (p=0.99 for differences in cumulative RVUs). However, following the index visit, those who filled ≥2 early opioid prescriptions had significantly greater cumulative utilization compared to those who did not (p=0.001). Similar results were observed in the sensitivity analyses (Supplemental Digital Content 9 and 10).
Figure 3.
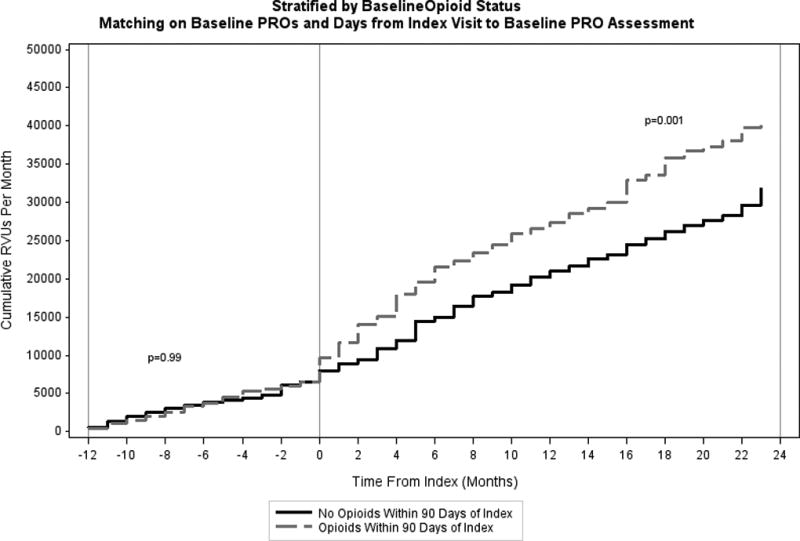
Cumulative Relative Values Units (RVUs) Per Month Stratified by Baseline Opioid Status.
Discussion
In this cohort of older adults with new visits for low back pain, those who filled two or more opioid prescriptions within 90 days of the index visit had similar adjusted PROs at each study time point compared to a matched group of patients who did not fill early opioid prescriptions. Patients who filled ≥2 early opioid prescriptions were also significantly more likely to have filled prescriptions for non-opioid pain medications in the first 90 days and to have filled one or more opioid prescriptions well after their index back pain visits. These findings may indicate both a propensity to use opioids and to use prescription pain medications in general in this group. Although most guidelines recommend that opioid use for acute low back pain, if any, be limited to 2 weeks or less [17], we found that early opioid recipients were more likely to fill opioid prescriptions months after initiating care for their low back pain. Although our study sample consisted of “young” older patients, with a mean age of 73 years, this finding is of particular concern in older populations due to their increased susceptibility to adverse events linked to opioids such as delirium [45, 46], pneumonia [47], constipation, nausea, dizziness [48], mortality [49], and falls [16].
We cannot be certain what factors caused some patients in our analyses to receive early opioid prescriptions while others did not, since both groups were similar in terms of baseline back pain, disability, and sociodemographic factors. Evidence indicates that opioid prescribing patterns vary widely among individual providers in emergency departments [50]. We did not have enough patients per provider to examine whether some providers were more likely than others to prescribe opioids, but we speculate that individual provider preferences and practice patterns may have played a role in determining whether patients received opioids soon after their index visits.
Although we did not observe statistically significant adjusted differences in overall or spine-specific RVUs between the group that received early opioid prescriptions and the group that did not, we did find increased utilization in the early opioid group in terms of unadjusted, per month RVUs after the index visit, as well as the summed 24-month RVUs from spine injections. Prior studies have also reported associations between opioid prescriptions and increased short-term healthcare utilization [11, 51]. One of the contributors to the greater RVUs may have been that opioid prescriptions require provider visits, and those visits have associated RVUs; however, RVUs associated with evaluation and management visits are minimal, ranging from 0.2 to 2.1 in 2012.
A major strength of this study was the availability of PRO and EHR data from a large sample of older adults with low back pain. However, an important limitation of our study is that, in almost all cases, the PROs of the patients in cohort who filled early opioid prescriptions were not assessed until after the opioid prescriptions had been filled, and therefore we cannot know the effect the early opioids had on the initial PROs. It remains possible that those who received opioids within 90 days of the index visit were different in important ways not measured in this study; for example, the two groups may have differed in opioid use prior to the 6 months before the index visit or in provider characteristics associated with both tendency to prescribe opioids and patient outcomes. However, when we performed sensitivity analyses that did not match on initial PROs or the number of days between the index back pain visit and the initial PRO assessment, we found results in terms of utilization and subsequent opioid use that were similar to those in the primary analyses.
Another limitation of our study is that we had data only on prescription fills of opioid medications, which does not necessarily indicate that the patients consumed the medications. Our intent in limiting the early opioid group to those who had ≥2 fills within 90 days was to increase the likelihood that they actually consumed opioids. We also did not have information on the indications for the opioid prescriptions, so we cannot be certain that the patients were filling the opioid prescriptions for their low back pain. We hoped to increase the likelihood that the opioids were prescribed for the back pain that was associated with the index visit by requiring fills of opioid prescriptions within 90 days. Another limitation is that it is possible that some patients who were classified as non-opioid recipients may have filled prescriptions for opioids outside of the Kaiser system; however, because Kaiser patients incurred out-of-pocket costs if they filled their prescriptions at outside pharmacies, we do not expect that many patients did so. Additionally, patients who were more likely to ask for and fill early opioid prescriptions might also have been more likely to have had high subsequent healthcare utilization. We attempted to adjust for this patient characteristic by including RVUs from the prior year in the propensity score and as an adjustment variable.
Conclusions
Among older adults with new visits for back pain, those who filled ≥2 opioid prescriptions within the next 90 days had similar scores on measures of pain and function across all time points, and similar healthcare utilization over the next 24 months, but were more likely to have filled prescriptions for opioids well after their index back pain visits compared to a matched cohort of patients who did not. Further research is indicated to determine optimal pharmacologic and non-pharmacologic strategies for treating older adults initiating care for low back pain.
Supplementary Material
Acknowledgments
We thank the research staff for data collection and their overall dedication to this study: Kaiser Permanente Northern California-Luisa Hamilton, MD; Jennifer Ireland, MA; Rebecca Rogot, BA; Karen Hansen, BA; Cynthia Huynh, MN; Daniel Fernandez, BS. The above did not receive compensation for their contributions other than their usual salary support.
Funding/Support: This work was supported by the Agency for Healthcare Research and Quality (AHRQ): grants 1R01HS01922201 and 1R01HS022972-01.
Role of the Sponsors: The study sponsors had no role in the design and conduct of the study; collection, management, analysis, and interpretation of the data; preparation, review, or approval of the manuscript; or decision to submit the manuscript for publication.
Footnotes
Conflict of Interest Disclosures:
Dr. Jarvik has the following potential conflicts of interest, although they do not relate directly to the subject of this manuscript, he lists them in the spirit of full disclosure. He is a co-founder and stockholder of PhysioSonics, a high intensity focused ultrasound company, and receives royalties for intellectual property. He is also a consultant for both HealthHelp, a radiology benefits management company, and for Google.
Dr. Deyo has received honoraria as a member of the board of directors of the Informed Medical Decisions Foundation, a non-profit organization. He receives royalties from UpToDate for authoring topics on acute low back pain. His university has received an endowment from Kaiser Permanente that supports part of his salary. He has current and pending grants from U.S. federal agencies. No conflicts of interest were reported by the remaining authors.
References
- 1.Eggermont LH, Leveille SG, Shi L, et al. Pain characteristics associated with the onset of disability in older adults: the maintenance of balance, independent living, intellect, and zest in the Elderly Boston Study. J Am Geriatr Soc. 2014;62:1007–1016. doi: 10.1111/jgs.12848. [DOI] [PMC free article] [PubMed] [Google Scholar]
- 2.Buchbinder R, Blyth FM, March LM, et al. Placing the global burden of low back pain in context. Best Pract Res Clin Rheumatol. 2013;27:575–589. doi: 10.1016/j.berh.2013.10.007. [DOI] [PubMed] [Google Scholar]
- 3.Stover BD, Turner JA, Franklin G, et al. Factors associated with early opioid prescription among workers with low back injuries. J Pain. 2006;7:718–725. doi: 10.1016/j.jpain.2006.03.004. [DOI] [PubMed] [Google Scholar]
- 4.Ivanova JI, Birnbaum HG, Schiller M, et al. Real-world practice patterns, health-care utilization, and costs in patients with low back pain: the long road to guideline-concordant care. Spine J. 2011;11:622–632. doi: 10.1016/j.spinee.2011.03.017. [DOI] [PubMed] [Google Scholar]
- 5.Deyo RA, Von Korff M, Duhrkoop D. Opioids for low back pain. BMJ. 2015;350:g6380. doi: 10.1136/bmj.g6380. [DOI] [PMC free article] [PubMed] [Google Scholar]
- 6.Chou R, Qaseem A, Snow V, et al. Diagnosis and treatment of low back pain: a joint clinical practice guideline from the American College of Physicians and the American Pain Society. Ann Intern Med. 2007;147:478–491. doi: 10.7326/0003-4819-147-7-200710020-00006. [DOI] [PubMed] [Google Scholar]
- 7.Low Back Pain: Early Management of Persistent Non-specific Low Back Pain. London: 2009. National Institute for Health and Care Excellence (NICE) [Google Scholar]
- 8.Ashworth J, Green DJ, Dunn KM, et al. Opioid use among low back pain patients in primary care: Is opioid prescription associated with disability at 6-month follow-up? Pain. 2013;154:1038–1044. doi: 10.1016/j.pain.2013.03.011. [DOI] [PMC free article] [PubMed] [Google Scholar]
- 9.Webster BS, Verma SK, Gatchel RJ. Relationship between early opioid prescribing for acute occupational low back pain and disability duration, medical costs, subsequent surgery and late opioid use. Spine. 2007;32:2127–2132. doi: 10.1097/BRS.0b013e318145a731. [DOI] [PubMed] [Google Scholar]
- 10.Franklin GM, Stover BD, Turner JA, et al. Early opioid prescription and subsequent disability among workers with back injuries: the Disability Risk Identification Study Cohort. Spine. 2008;33:199–204. doi: 10.1097/BRS.0b013e318160455c. [DOI] [PubMed] [Google Scholar]
- 11.Kern DM, Zhou S, Chavoshi S, et al. Treatment patterns, healthcare utilization, and costs of chronic opioid treatment for non-cancer pain in the United States. Am J Manag Care. 2015;21:e222–234. [PubMed] [Google Scholar]
- 12.Bohnert AS, Valenstein M, Bair MJ, et al. Association between opioid prescribing patterns and opioid overdose-related deaths. JAMA. 2011;305:1315–1321. doi: 10.1001/jama.2011.370. [DOI] [PubMed] [Google Scholar]
- 13.Dowell D, Haegerich TM, Chou R. CDC Guideline for Prescribing Opioids for Chronic Pain--United States, 2016. JAMA. 2016;315:1624–1645. doi: 10.1001/jama.2016.1464. [DOI] [PMC free article] [PubMed] [Google Scholar]
- 14.Busse JW, Ebrahim S, Heels-Ansdell D, et al. Association of worker characteristics and early reimbursement for physical therapy, chiropractic and opioid prescriptions with workers' compensation claim duration, for cases of acute low back pain: an observational cohort study. BMJ Open. 2015;5:e007836. doi: 10.1136/bmjopen-2015-007836. [DOI] [PMC free article] [PubMed] [Google Scholar]
- 15.Anderson JT, Haas AR, Percy R, et al. Chronic Opioid Therapy after Lumbar Fusion Surgery for Degenerative Disc Disease in a Workers' Compensation Setting. Spine. 2015 doi: 10.1097/BRS.0000000000001054. [DOI] [PubMed] [Google Scholar]
- 16.Rolita L, Spegman A, Tang X, et al. Greater number of narcotic analgesic prescriptions for osteoarthritis is associated with falls and fractures in elderly adults. J Am Geriatr Soc. 2013;61:335–340. doi: 10.1111/jgs.12148. [DOI] [PMC free article] [PubMed] [Google Scholar]
- 17.Knight CLDR, Staiger TO, Wipf JE. [Accessed 20 June, 2016];Treatment of acute low back pain [Web Page] Available at http://www.uptodate.com/contents/treatment-of-acute-low-back-pain.
- 18.West NA, Severtson SG, Green JL, et al. Trends in abuse and misuse of prescription opioids among older adults. Drug Alcohol Depend. 2015;149:117–121. doi: 10.1016/j.drugalcdep.2015.01.027. [DOI] [PubMed] [Google Scholar]
- 19.Jarvik JG, Comstock BA, Bresnahan BW, et al. Study protocol: the Back Pain Outcomes using Longitudinal Data (BOLD) registry. BMC Musculoskelet Disord. 2012;13:64. doi: 10.1186/1471-2474-13-64. [DOI] [PMC free article] [PubMed] [Google Scholar]
- 20.Jarvik JG, Comstock BA, Heagerty PJ, et al. Back pain in seniors: the Back pain Outcomes using Longitudinal Data (BOLD) cohort baseline data. BMC Musculoskelet Disord. 2014;15:134. doi: 10.1186/1471-2474-15-134. [DOI] [PMC free article] [PubMed] [Google Scholar]
- 21.Dowell D, Haegerich TM, Chou R. CDC Guideline for Prescribing Opioids for Chronic Pain-United States, 2016. JAMA. 2016 doi: 10.1001/jama.2016.1464. [DOI] [PMC free article] [PubMed] [Google Scholar]
- 22.Roland M, Morris R. A study of the natural history of back pain. Part I: development of a reliable and sensitive measure of disability in low-back pain. Spine. 1983;8:141–144. doi: 10.1097/00007632-198303000-00004. [DOI] [PubMed] [Google Scholar]
- 23.Bergner M, Bobbitt RA, Carter WB, et al. The Sickness Impact Profile - Development and Final Revision of a Health-Status Measure. Med Care. 1981;19:787–805. doi: 10.1097/00005650-198108000-00001. [DOI] [PubMed] [Google Scholar]
- 24.Ostelo RW, Deyo RA, Stratford P, et al. Interpreting change scores for pain and functional status in low back pain: towards international consensus regarding minimal important change. Spine. 2008;33:90–94. doi: 10.1097/BRS.0b013e31815e3a10. [DOI] [PubMed] [Google Scholar]
- 25.Cleeland CS, Ryan KM. Pain assessment: global use of the Brief Pain Inventory. Ann Acad Med Singapore. 1994;23:129–138. [PubMed] [Google Scholar]
- 26.Dworkin RH, Turk DC, Wyrwich KW, et al. Interpreting the clinical importance of treatment outcomes in chronic pain clinical trials: IMMPACT recommendations. J Pain. 2008;9:105–121. doi: 10.1016/j.jpain.2007.09.005. [DOI] [PubMed] [Google Scholar]
- 27.Barton GR, Sach TH, Avery AJ, et al. A comparison of the performance of the EQ-5D and SF-6D for individuals aged >or= 45 years. Health Econ. 2008;17:815–832. doi: 10.1002/hec.1298. [DOI] [PubMed] [Google Scholar]
- 28.Kroenke K, Spitzer RL, Williams JB. The Patient Health Questionnaire-2: validity of a two-item depression screener. Med Care. 2003;41:1284–1292. doi: 10.1097/01.MLR.0000093487.78664.3C. [DOI] [PubMed] [Google Scholar]
- 29.Farrar JT, Young JP, Jr, LaMoreaux L, et al. Clinical importance of changes in chronic pain intensity measured on an 11-point numerical pain rating scale. Pain. 2001;94:149–158. doi: 10.1016/S0304-3959(01)00349-9. [DOI] [PubMed] [Google Scholar]
- 30.American Medical Association (AMA) [Accessed May 8, 2013];CPT - Current Procedural Terminology [Web Page] Available at http://www.ama-assn.org/ama/pub/physician-resources/solutions-managing-your-practice/coding-billing-insurance/cpt.page.
- 31.Centers for Medicare and Medicaid Services. Medicare program; payment policies under the physician fee schedule and other revisions to Part B for CY 2010. Final rule with comment period. Fed Regist. 2009;74:61737–62188. [PubMed] [Google Scholar]
- 32.Centers for Medicare and Medicaid Services. Medicare program; payment policies under the physician fee schedule and other revisions to Part B for CY 2011. Final rule with comment period. Fed Regist. 2010;75:73169–73860. [PubMed] [Google Scholar]
- 33.Centers for Medicare and Medicaid Services. Medicare program; payment policies under the physician fee schedule, five-year review of work relative value units, clinical laboratory fee schedule: signature on requisition, and other revisions to part B for CY 2012. Final rule with comment period. Fed Regist. 2011;76:73026–73474. [PubMed] [Google Scholar]
- 34.Centers for Medicare and Medicaid Services. Medicare Program; Revisions to Payment Policies Under the Physician Fee Schedule, DME Face-to-Face Encounters, Elimination of the Requirement for Termination of Non-Random Prepayment Complex Medical Review and Other Revisions to Part B for CY 2013. Fed Regist. 2012 [PubMed] [Google Scholar]
- 35.ICD-9-CM. International Classification of Diseases, 9th revision, Clinical Modification. 3d edition, volumes 1, 2 and 3. Official authorized addendum effective October 1, 1990--HCFA. J Am Med Rec Assoc. 1990;61(suppl):1–35. [PubMed] [Google Scholar]
- 36.Broekmans S, Dobbels F, Milisen K, et al. Pharmacologic pain treatment in a multidisciplinary pain center: do patients adhere to the prescription of the physician? Clin J Pain. 2010;26:81–86. doi: 10.1097/AJP.0b013e3181b91b22. [DOI] [PubMed] [Google Scholar]
- 37.D'Agostino RB., Jr Propensity score methods for bias reduction in the comparison of a treatment to a non-randomized control group. Stat Med. 1998;17:2265–2281. doi: 10.1002/(sici)1097-0258(19981015)17:19<2265::aid-sim918>3.0.co;2-b. [DOI] [PubMed] [Google Scholar]
- 38.Stukel TA, Fisher ES, Wennberg DE, et al. Analysis of observational studies in the presence of treatment selection bias: effects of invasive cardiac management on AMI survival using propensity score and instrumental variable methods. JAMA. 2007;297:278–285. doi: 10.1001/jama.297.3.278. [DOI] [PMC free article] [PubMed] [Google Scholar]
- 39.Austin PC. An Introduction to Propensity Score Methods for Reducing the Effects of Confounding in Observational Studies. Multivariate Behav Res. 2011;46:399–424. doi: 10.1080/00273171.2011.568786. [DOI] [PMC free article] [PubMed] [Google Scholar]
- 40.Kuo YF, Raji MA, Chen NW, et al. Trends in Opioid Prescriptions Among Part D Medicare Recipients From 2007 to 2012. Am J Med. 2016;129:221, e221–230. doi: 10.1016/j.amjmed.2015.10.002. [DOI] [PMC free article] [PubMed] [Google Scholar]
- 41.Green DJ, Bedson J, Blagojevic-Burwell M, et al. Factors associated with primary care prescription of opioids for joint pain. Eur J Pain. 2013;17:234–244. doi: 10.1002/j.1532-2149.2012.00185.x. [DOI] [PubMed] [Google Scholar]
- 42.Chapman SL, Wu LT. Associations between cigarette smoking and pain among veterans. Epidemiol Rev. 2015;37:86–102. doi: 10.1093/epirev/mxu008. [DOI] [PMC free article] [PubMed] [Google Scholar]
- 43.Quan H, Li B, Couris CM, et al. Updating and validating the Charlson comorbidity index and score for risk adjustment in hospital discharge abstracts using data from 6 countries. Am J Epidemiol. 2011;173:676–682. doi: 10.1093/aje/kwq433. [DOI] [PubMed] [Google Scholar]
- 44.Parsons LS Performing a 1: N case-control match on propensity score; Proceedings of the 29th Annual SAS Users Group International Conference Cary, NC: SAS Institute; 2004. pp. 165–129. [Google Scholar]
- 45.Clegg A, Young JB. Which medications to avoid in people at risk of delirium: a systematic review. Age Ageing. 2011;40:23–29. doi: 10.1093/ageing/afq140. [DOI] [PubMed] [Google Scholar]
- 46.Morrison RS, Magaziner J, Gilbert M, et al. Relationship between pain and opioid analgesics on the development of delirium following hip fracture. J Gerontol A Biol Sci Med Sci. 2003;58:76–81. doi: 10.1093/gerona/58.1.m76. [DOI] [PubMed] [Google Scholar]
- 47.Dublin S, Walker RL, Jackson ML, et al. Use of opioids or benzodiazepines and risk of pneumonia in older adults: a population-based case-control study. J Am Geriatr Soc. 2011;59:1899–1907. doi: 10.1111/j.1532-5415.2011.03586.x. [DOI] [PMC free article] [PubMed] [Google Scholar]
- 48.Papaleontiou M, Henderson CR, Jr, Turner BJ, et al. Outcomes associated with opioid use in the treatment of chronic noncancer pain in older adults: a systematic review and meta-analysis. J Am Geriatr Soc. 2010;58:1353–1369. doi: 10.1111/j.1532-5415.2010.02920.x. [DOI] [PMC free article] [PubMed] [Google Scholar]
- 49.Solomon DH, Rassen JA, Glynn RJ, et al. The comparative safety of opioids for nonmalignant pain in older adults. Arch Intern Med. 2010;170:1979–1986. doi: 10.1001/archinternmed.2010.450. [DOI] [PubMed] [Google Scholar]
- 50.Barnett ML, Olenski AR, Jena AB. Opioid-Prescribing Patterns of Emergency Physicians and Risk of Long-Term Use. N Engl J Med. 2017;376:663–673. doi: 10.1056/NEJMsa1610524. [DOI] [PMC free article] [PubMed] [Google Scholar]
- 51.Eriksen J, Sjogren P, Bruera E, et al. Critical issues on opioids in chronic non-cancer pain: an epidemiological study. Pain. 2006;125:172–179. doi: 10.1016/j.pain.2006.06.009. [DOI] [PubMed] [Google Scholar]
Associated Data
This section collects any data citations, data availability statements, or supplementary materials included in this article.


