

Abstract
Growth of abdominal aortic aneurysms (AAA), localized aortal wall expansions, is driven by the disruption and subsequent loss of aortal wall elastic fibers by matrix metalloproteases (MMPs). Since elastic fibers do not naturally regenerate or repair, arresting/reversing AAA growth has not been possible. Previously, we showed utility of doxycycline (DOX), an MMP inhibitor drug, to stimulate elastic matrix neoassembly and crosslinking at low μg/ml doses in addition to inhibiting MMPs. We currently show in aneurysmal smooth muscle cell (SMC) cultures, that effects of exogenous DOX in this dose range are linked to its upregulation of transforming growth factor beta (TGF-β1) via its inhibition of the regulatory protein c-Jun-N-terminal kinase 2 (JNK 2). We have identified a DOX dose range that stimulates elastogenesis and crosslinking without adversely impacting cell viability. Using JNK 2 inhibition as a metric for pro-regenerative matrix effects of DOX, we further demonstrate that sustained, steady state release of DOX at the useful dose, from poly(ethylene glycol)-poly(lactic glycolic acid) nanoparticles (NPs) provides pro-elastogenic and anti-proteolytic effects that could potentially be more pronounced than that of exogenous DOX. We attribute these outcomes to previously determined synergistic effects provided by cationic amphiphile groups functionalizing the polymer NP surface. Released DOX inhibited expression and phosphorylation of JNK to likely increase expression of TGF-β1, which is known to increase elastogenesis and lysyl oxidase-mediated crosslinking of elastic matrix. Our results suggest that JNK inhibition is a useful metric to assess pro-elastic matrix regenerative effects and point to the combinatorial regenerative benefits provided by DOX and cationic-functionalized NPs.
Keywords: Nanoparticles, Elastic Matrix Regeneration, Abdominal Aortic Aneurysms, Drug Delivery
Introduction
Abdominal aortic aneurysms (AAAs) are localized expansions of the abdominal aorta wall that grow slowly over several years until potentially fatal rupture. Chronic upregulation of matrix metalloproteases (MMP) in the injured aorta wall and their disruption of elastic fibers within the extracellular matrix (ECM) of the aorta wall results in wall thinning, loss of elasticity, and gradual weakening [1–3]. The risk of AAA rupture increases dramatically as the maximal diameter of the AAA segment exceeds a critical size of 5.5 cm [4]. Rupture of the abdominal aorta requires immediate surgery and is fatal in 90% of cases [5]. While this motivates early treatment of small, growing AAAs, there are currently no drug-based treatments to arrest or reverse the growth of small AAAs.
MMPs are involved in matrix remodeling and homeostasis in healthy tissues, but overexpression of MMP-2 and MMP-9 by inflammatory cells leads to degradation of the elastic matrix in the AAA wall [6,7]. Adult aortic smooth muscle cells (SMCs) are unable to regenerate the elastic matrix thus necessitating the development of new platform technologies to stimulate such regeneration [7,8]. Previous studies have shown oral dosing of doxycycline (DOX), a modified tetracycline, to non-specifically inhibit a wide array of MMP types [7,9] by directing the coordination with the catalytic site of the enzymes and also inhibiting MMP mRNA transcription [7]. Our lab has for the first time, shown that at low, sub-clinical doses (< 10 μg/mL), DOX, in addition to maintaining its anti-MMP effects seen at clinically approved doses, also exhibits pro-elastogenic effects [7]. These effects appear to mimic the effects of a drug, SP600125, which has been shown to inhibit, though with limited specificity, the intracellular regulatory protein, c-Jun-N-terminal Kinase (JNK) [10]. JNK inhibition with SP600125 has been linked to downstream effects of MMP inhibition, and thwarted AAA growth when delivered in vivo [7,10]. However, effects on the elastic matrix were not studied, and the drug is known to have off-target effects and minimally inhibit MMP-2, which is central to AAA development and growth. JNK, whose chronic overexpression has also been shown to antagonize transforming growth factor beta 1 (TGF-β1) [11], which we have shown in prior studies to stimulate synthesis of the elastic matrix by aneurysmal SMCs [7,12,13]. In a separate, parallel study pending publication, we confirmed that the anti-MMP and pro-elastogenic effects of DOX at a low μg/mL dose on cultured AAA SMCs is mediated by its inhibition of JNK. In the present work, we investigate DOX-dose dependency of JNK attenuation and if it is a reliable metric to assess quantity and quality of induced elastic matrix regenerative repair.
In situ regenerative repair of the elastic matrix within the AAA wall demands modalities for localized, predictable, and sustained delivery of matrix regenerative/anti-proteolytic drugs such as DOX, to assure dose-specific biological responses in target tissues, avoid systemic MMP inhibition and body wide side effects of systemic DOX dosing. In a prior study, we developed cationic amphiphile-modified poly-lactic-co-glycolic acid nanoparticles (PLGA-NPs) for this purpose, and demonstrated significant anti-MMP and pro-elastogenic/crosslinking effects on cultured aneurysmal SMCs that we attributed to both the DOX released in the desired low μg/mL range and the pendant amphiphiles on the NP surface [7,14].
Thus, in this work, we have also sought to investigate delivery of DOX from these multifunctional PLGA NPs, utilizing polyethlyene glycol (PEG) as a diblock copolymer to improve circulation time in vivo. We have sought to investigate the effectiveness of DOX, released at doses optimized based on the metric of significant JNK inhibition, in both stimulating elastic matrix neoassembly and inhibiting proteolysis in aneurysmal SMC cultures, and also if these effects are synergistically improved by the cationic-amphiphile-surface functionalized PEG-PLGA nanocarriers. We hypothesize that DOX release from PEG-PLGA NPs will have pro-elastogenic and anti-proteolytic effects which will be beneficial to augment the assembly of crosslinked elastic fibers.
Materials and Methods
Isolation and culture of SMCs from elastase perfusion-induced rat AAAs
All animal procedures were conducted with approval of the Institutional Animal Care and Use Committee (IACUC) at the Cleveland Clinic (ARC # 2016–1581). The Clinic animal facility is AAALAC-approved and has animal assurance (#A3145-01; Expires 12/31/2017). Aneurysmal rat aortic SMCs (EaRASMCs) were isolated from several adult male Sprague-Dawley rats at 14-days post-AAA induction via elastase infusion, as described in an earlier study by our group [6]. The aortae were cut open longitudinally and the intimal layer scraped off carefully with a scalpel. The medial layer was then separated from the underlying adventitial layer, cut into ~0.5 mm long slices, and washed twice with warm sterile phosphate buffered saline (PBS). These were then pooled and enzymatically digested in DMEM-F12 cell culture medium (Invitrogen, Carlsbad, CA) containing 125 U/mg collagenase (Worthington Biochemicals, Lakewood, NJ) and 3 U/mg elastase (Worthington Biochemicals) for 30 min at 37 °C, centrifuged (400 g, 5 min), and cultured over 2 weeks in T-75 flasks. The cells were cultured in DMEM-F12 medium supplemented with 10% v/v fetal bovine serum (FBS; PAA Laboratories, Etobicoke, Ontario) and 1% v/v PenStrep (Thermo Fisher, South Logan, UT). The primary EaRASMCs obtained from these tissue explants were propagated over 2 weeks, passaged to confluence, and cells pooled from multiple rats were used in culture studies at passages 2–6. Healthy rat aortic SMCs (RASMCs) were similarly isolated from rats not induced with AAAs, and cultured identically to the EaRASMCs.
Experimental design for DOX dosing cell culture studies
A summary of the experimental design for our culture studies is presented in Table 1a and 1b. Previously, our lab showed that low levels of DOX (< 10 μg/mL) attenuates JNK expression by cytokine-activated EaRASMCs and observed the downstream effects of such inhibition on proteolytic activity and elastic matrix neoassembly. These new studies (experiment 1) sought to investigate the effects of DOX dosing on anti-MMP and pro-elastogenic properties of cytokine-activated EaRASMCs at 7 and 21 days post-seeding. In this experiment, exogenous DOX was supplemented to EaRASMCs at doses of 0.1, 1, 10, 20, and 50 μg/mL in parallel with cytokine stimulation.
Table 1A.
Design of experiment to assess exogenous DOX dosing effects on cytokine (TNF-α and IL-1β; 10 ng/ml each)-injured EaRASMC cultures.
| Case | Cell Amount/ Type/# Cultures | Day 7, Serum Starve: 3 h Treatment: 30 min |
|---|---|---|
| 1% FBS | ||
| Healthy Cell Controls | 30K, RASMC, n=3 | – |
| Treatment Controls | 30K, EaRASMC, n=3 | Cytokines |
| DOX (0.1 μg/mL) | 30K, EaRASMC, n=3 | DOX, Cytokines |
| DOX (1 μg/mL) | 30K, EaRASMC, n=3 | DOX, Cytokines |
| DOX (10 μg/mL) | 30K, EaRASMC, n=3 | DOX, Cytokines |
| DOX (20 μg/mL) | 30K, EaRASMC, n=3 | DOX, Cytokines |
| DOX (50 μg/mL) | 30K, EaRASMC, n=3 | DOX, Cytokines |
Table 1B.
Design of experiment to assess effects of exogenous DOX dose on elastic matrix neoassembly and proteolytic activity in cytokine (TNF-α and IL-1β; 10 ng/ml each)-injured EaRASMC cultures. Outcomes were measured in harvested cell layers at 21 days post-seeding.
| Case | Cell Amount/ Type/# Cultures | Day 7 Serum Starve: 3 h Treatment: 30 min |
Treatment Day 8 and Day 14 (Till Harvest on Day 21) |
|---|---|---|---|
| 1% FBS | 10% FBS | ||
| Healthy Cell Controls | 30K, RASMC, n=3 | – | – |
| Treatment Controls | 30K, EaRASMC, n=3 | Cytokines | Cytokines |
| DOX (0.1 μg/mL) | 30K, EaRASMC, n=3 | DOX, Cytokines | DOX, Cytokines |
| DOX (1 μg/mL) | 30K, EaRASMC, n=3 | DOX, Cytokines | DOX, Cytokines |
| DOX (10 μg/mL) | 30K, EaRASMC, n=3 | DOX, Cytokines | DOX, Cytokines |
| DOX (20 μg/mL) | 30K, EaRASMC, n=3 | DOX, Cytokines | DOX, Cytokines |
| DOX (50 μg/mL) | 30K, EaRASMC, n=3 | DOX, Cytokines | DOX, Cytokines |
To study the anti-proteolytic effects of the different DOX doses, RASMCs (healthy cell controls) and EaRASMCs were seeded in 6 well plates (A = 10 cm2; USA Scientific, Ocala, FL,) at 30,000 cells per well and cultured for 7 days in DMEM F-12 medium with 10% v/v FBS and 1% v/v PenStrep. Medium was changed on day 3 post-seeding. Briefly, on day 7 post-seeding, the cultures were serum starved for 3 h in DMEM F-12 with 1% v/v FBS and 1% v/v PenStrep before treatment for 30 min with 10 ng/mL each of the cytokines tumor necrosis factor-alpha (TNF-α; PeproTech, Rocky Hill, NJ) and interleukin-1 beta (IL-1β; Bio Basic Inc, Ontario, Canada) with or without doxycycline hyclate (DOX) (Sigma Aldrich, St. Louis, MO) supplemented at the various doses. Immediately following the treatment, cell culture supernatants were collected and the cell layers were harvested. RASMCs cultured with no cytokines and no DOX were designated healthy cell controls. EaRASMC cultures treated with cytokines, but not DOX, served as the treatment controls. These 7-day cultures were analyzed using western blots and ELISA for key signaling proteins such as JNK, active phosphorylated JNK (pJNK), TGF-β1, tissue inhibitor of matrix metalloprotease 1 (TIMP-1), lysyl oxidase (LOX), and the elastolytic MMP-2 and -9, and gel zymography for MMP enzyme activities, as will be detailed in subsequent sections.
Additionally, cell layers intended for biochemical analysis of deposited elastic matrix and crosslinking were cultured for 21 days. Similar to the above experiment, at 7 days post-seeding following a 3 h serum starvation period, the EaRASMC cultures were incubated for 30 min with the cytokines, in parallel with, or without DOX (0.1, 1, 10, 20, 50 μg/ml; treatment controls). These cultures were then switched back to culture in DMEM F-12 medium containing 10% v/v FBS and 1% v/v Penstrep and cultured further. RASMCs were also cultured for 21 days and evaluated as healthy cell controls. On days 8 and 14 post-seeding, following the collection and replacement of medium, the DOX-treated cultures received additional DOX treatment at their respective dose. After the initial cytokine-induced injury event, the EaRASMC cultures also received additional cytokine treatment on days 8 and 14 post-seeding to simulate chronic cytokine exposure. The treated and control cell layers were all harvested at 21 days post-seeding for biochemical analysis.
Western blot for JNK, pJNK, MMP-2 and -9, TIMP-1, and LOX proteins
In the experiments described above, expression of JNK (isoforms 1, 2, and 3), pJNK, MMP-2 and -9, TIMP-1, and LOX in control and DOX-treated cultures were semi-quantitatively assessed with Western blots. After 7 days of culture and subsequent treatment, the cell layers of two adjacent wells from a 6 well plate were pooled and harvested with RIPA buffer (Thermo Scientific, Waltham, MA) containing 1% v/v Halt™ protease inhibitor (Thermo Scientific) and 1% v/v Halt™ phosphatase inhibitor (Thermo Scientific). A total of n = 3 replicate samples were thus analyzed in each group. Total protein content per sample was measured using a bicinchoninic acid (BCA) assay kit (Thermo Scientific). Maximum volumes of protein sample (15.6 μL) were loaded under reducing conditions to lanes of a NuPAGE® Novex® 10% Bis-Tris or 4–12% Bis-Tris pre-cast polyacrylamide gels (Thermo Scientific). SeeBlue® Pre-stained protein standard (Invitrogen) was also loaded in a well to form a protein ladder for determination of molecular weight. Following electrophoresis in NuPAGE® MOPS or MES SDS Running Buffer (Thermo Scientific), the gels were transferred onto nitrocellulose membranes using the iBlot® Western Blotting System (Invitrogen) and then blocked for 1 h at room temperature with a 1:1 mixture of PBS and Odyssey Blocking Buffer (LI-COR Biosciences, Lincoln, NE). The membranes were immunolabeled for 16 h at 4 °C with one of the following antibodies - rabbit monoclonal antibody against JNK isoforms 1, 2, 3 (1:1000 v/v dilution; Abcam, Cambridge, MA), polyclonal rabbit IgG antibody against (active) p-JNK (1 μg/mL dilution; R&D Systems, Minneapolis, MN), or polyclonal rabbit antibodies against MMP-2 (1:500 v/v dilution; Abcam), MMP-9 (1:500 v/v dilution; Abcam), TIMP-1 (1:100 v/v dilution; Santa Cruz Biotechnology, Dallas, TX), and LOX (2.5 μg/mL dilution; Abcam), and with a mouse monoclonal antibody against β-actin (1:1000 v/v dilution; Sigma-Aldrich), as the loading control. Secondary antibody labeling was performed for 1 h at room temperature using IRDye® 680LT goat-anti-rabbit (1:15,000 dilution) and IRDye® 800CW goat-anti-mouse (1:20,000 dilution) polyclonal antibodies (LI-COR Biosciences). A LI-COR Odyssey laser-based scanning system was used to image the protein bands. Target protein band intensities were quantified with Image Studio software and normalized to the intensities of the β-actin bands, for the respective cultures. These values were further normalized to the treatment control culture for comparison.
Gel zymography for MMP activity
Enzyme activities of the elastolytic MMPs-2 and -9 were assessed via gel zymography. After 7 days of culture and subsequent treatment, the contents of 2 wells from each 6-well culture plate were pooled and harvested with RIPA buffer (Thermo Scientific) containing 1% v/v Halt™ protease inhibitor (Thermo Scientific) to create n = 3 replicate samples/ treatment group for analysis. After BCA analysis, volumes of cell lysate equivalent to 5 μg of total protein were loaded into each lane of a 10% zymogen gel (Invitrogen), along with a SeeBlue® pre-stained protein standard (Invitrogen), and MMP-2 and MMP-9 protein standards (EMD Millipore, Billerica, MA). The gels were run for 2 h at 125 V and then washed in 2.5% v/v Triton-X-100 for 30 min to remove traces of SDS. The gels were then incubated for 48 h at 37 °C in Novex® Zymogen Developing Buffer (Thermo Scientific) to activate the MMPs. Following incubation, the gels were washed with water 3× for 10 min and stained for 1 h with SimplyBlue™ SafeStain (Thermo Scientific). The gels were de-stained with distilled water until clear bands were visible. The gels were scanned and the band intensities quantified with Image J, which were then normalized to the treatment control for comparison.
ELISA for TGF-β1 expression
TGF-β1 secreted into the cell culture medium, collected from 7 day cultures post-treatment, were quantified using an enzyme-linked immunosorbent assay (ELISA) (Abcam) per the manufacturer instructions. TGF-β1 levels determined using the ELISA were normalized to the treatment control for comparison.
DNA assay
The DNA content of the harvested cell layers from the 21 day cultures was measured via a fluorometric assay of Labarca and Paigen to determine cell proliferation over the culture period [15]. After 1 and 21 days of culture, the cell layers were harvested in Pi buffer, sonicated on ice, and assayed for DNA content. Cell density was calculated assuming 6 pg of DNA per cell. DNA content was normalized to the treatment controls for comparison. Elastic matrix amounts measured in the cell layers were also normalized to their respective DNA contents to allow comparison between groups.
Fastin assay for elastin
Total elastin content in the 21 day cell cultures was quantified using a Fastin assay (Accurate Scientific and Chemical, Westbury, NY), as described in recent publications by our lab [4,13]. Cell layers from two wells each were pooled to create each sample and harvested in Pi Buffer and sonicated (n = 3 samples per culture group). To extract elastin, 500 μL of the cell suspensions were digested in 100 μL of 1.5 M oxalic acid at 95 °C for 90 min, centrifuged at 14,000 g, and the supernatant containing the solubilized elastin was collected. The remaining pellet was further digested with 400 μL of 0.25 M oxalic acid at 100 °C for 1 h and centrifuged again at 14,000 g. The two supernatants were pooled and the elastin content was assessed using the Fastin assay. Total elastin amounts in each case was measured and was also normalized to their respective DNA contents and to the treatment controls for comparison.
Desmosine assay
After 21 days of culture, RASMC and EaRASMC layers were harvested in PBS and pelleted by centrifugation. The cell pellets were hydrolyzed with 6 N HCl for 48 h, evaporated to dryness and reconstituted in 400 μL of water. The samples were then filtered through a 0.45 μm filter and desmosine levels were determined using a competitive ELISA assay [16]. Desmosine crosslinker amounts were normalized to the total protein content in the respective samples, which was measured via a ninhydrin assay [17].
DOX-free NP formulation
Polyethylene glycol (PEG, 5,000 Da)-Poly (dl-lactic-co-glycolic acid) (PLGA, 55,000 Da, 50:50 lactide: glycolide) methyl ether nanoparticles (NPs) (PEG-PLGA, Sigma Aldrich, St. Louis, MO) were fabricated via a single emulsion-solvent evaporation based technique. PEG-PLGA was dissolved in chloroform (Fisher Scientific, Fair Lawn, NJ) at a ratio of 25 mg of polymer to 1 mL of solvent. The water-in-oil emulsion was formed via sonication (Q500; QSonica LLC, Newtown, CT, 2 cycles of 30 s on ice at 20% amplitude) of an aqueous solution containing various cationic amphiphile stabilizers with the polymer solution. Various cationic stabilizers namely Hexadecyltrimethylammonium bromide (CTAB, Sigma Aldrich, St. Louis, MO), Didodecyldimethylammonium bromide (DMAB, Sigma Aldrich, St. Louis, MO), Dodecyltrimethylammonium bromide (DTAB, Sigma Aldrich, St. Louis, MO), Octadecyltrimethylammonium bromide (OTAB, Sigma Aldrich, St. Louis, MO) at 0.25, 0.5, 1, and 1.5% w/v were evaluated to assess NP stability. This resulting emulsion was stirred overnight at room temperature, and then desiccated for 1 h under vacuum, to remove any residual chloroform. The NPs formed were recovered by ultracentrifugation at 35,000 rpm (Beckman L-80, Beckman Instruments, Inc., Palo Alto, CA) for 30 min at 4 °C. The NPs were washed twice with nanopure water to remove residual stabilizer (and unencapsulated DOX when applicable) and lyophilized for 48 h to obtain a dry powder.
DOX-loaded NP formulation
DOX-loaded PEG-PLGA NPs were fabricated as described above with minor modifications. PEG-PLGA NPs loaded with DOX were prepared via a double emulsion-solvent evaporation technique. Briefly, the polymer was dissolved in chloroform at the same ratio. An aqueous DOX solution at three different theoretical loadings (2%, 5% and 10% w/w ratios of DOX: PEG-PLGA) was emulsified into the PEG-PLGA solution using a probe sonicator for 2 cycles of 30 s on ice, at an amplitude setting of 20%. The water-in-oil emulsion formed and was further emulsified into an aqueous solution of 1% w/v DMAB using the probe sonicator for 2 cycles at 30 s on ice at 20 % amplitude setting, to form the double emulsion. This second emulsion was stirred overnight at room temperature and NP fabrication was carried out as previously described.
Measuring DOX encapsulation efficiency
The supernatants from the washing/ultracentrifugation steps were pooled for each individual NP formulation. The unencapsulated DOX was quantified via UV-Spectrophotometry using the wavelength for DOX at λ = 270 nm (SpectraMax M2, Molecular Devices, Inc., Sunnyvale, CA). The total amount of DOX encapsulated in the NPs and the overall encapsulation efficiencies were determined by subtracting the total amount of unencapsulated DOX from the total weighed amounts of DOX added during NP formulation.
Size and surface charge of DOX-loaded PLGA NPs
Mean hydrodynamic diameters of the NPs were quantified using a dynamic light scattering (DLS) technique and the surface charge (mean zeta potentials) of these NPs due to the cationic surfactants were determined via a phase analysis light scattering technique using a commercial particle-sizing system (PSS/NICOMP 380/ZLS, Particle Sizing Systems, Santa Barbara, CA). For size determination, 5 μL of NP solution was added to 495 μl of nanopure water. Each sample was run at 2 cycles for 5 min per cycle. For determination of surface charge, 500 μl of the NP solution was combined with 2.5 mL of nanopure water. Samples were run for 2 cycles at 120 s per cycle.
DOX release from NPs
DOX release from NPs was carried out in phosphate buffer saline (PBS, pH 7.4; Sigma-Aldrich) at 37 °C on a shaker at 250 rpm. Briefly, 1.5 mL polypropylene microcentrifuge tubes (n = 3 per formulation) were filled with 0.6 mL of NP suspensions containing 0.2 and 0.5 mg/mL of NPs, respectively. Release studies were carried out for either 60 (2%, 5%, 10% DOX, 0.5 mg/mL) or 30 days (10% DOX, 0.2 mg/mL) in each case. At each analysis time point, the samples were centrifuged (14,000 rpm, 30 min) in a microcentrifuge (Beckman Microfuge 16®, Beckman Coulter, Inc., Pasadena, CA), the supernatants withdrawn to quantify DOX content, and volume-replenished with fresh PBS. UV-spectrophotometry was used to quantify the DOX release. DOX absorbance at λ = 270 nm was calibrated to its concentration using serial dilutions of a 0.2 mg/mL DOX solution. The DOX standards were incubated under the same conditions as the NP samples, to avoid any time and temperature-dependent degradation of DOX.
Surface hydrophobicity of NPs
PEG-PLGA NPs were formulated as described above and the hydrophobicity assay was performed after the second washing step prior to lyophilization. A stock Rose Bengal (RB; Sigma Aldrich) solution was prepared by adding 20 mg of RB to 10 mL of nanopure water. This solution was then added to the NPs (10 μL/1 mL of NPs), covered to prevent light-generated degradation, and incubated on a shaker at 250 rpm for 3 h. Following the incubation, the NPs were ultracentrifuged at 35,000 rpm at 4 °C for 30 min to collect the NP pellet from the supernatant. The supernatant was centrifuged again (Eppendorf Centrifuge, 5810R, 15 amps) at 4,000 rpm for 10 min to pellet any remaining NPs.
The absorbance of the resulting supernatant was measured in a 96 well plate (Greiner Bio-one, Kremsmünster, Austria) via spectrophotometry (λ = 538 nm) and the absorbance was calibrated against serial dilutions of RB solution in nanopure water (20 μg/mL, 15 μg/mL, 10 μg/mL, 5 μg/mL, 2.5 μg/mL, and 0 μg/mL). Each surfactant (CTAB, DMAB, DTAB, and OTAB) was run individually and each surfactant concentration for each stabilizer (0.25%, 0.5%, 1%, and 1.5%) was run in triplicate.
NP degradation profile
NP degradation was qualitatively assessed over 20 days. NPs were weighed out and resuspended in PBS in 15 mL centrifuge tubes (USA Scientific) at concentrations of 0.2 mg/mL and 0.5 mg/mL per batch. The NPs were then pelleted by centrifugation (4,000 rpm for 10 min) and incubated at 37 °C (4, 6, 13, and 20 days respectively, n = 3 at each time point). At each time point, the supernatant was withdrawn and the samples were placed back, uncovered, in the incubator for 2 h to remove residual moisture. The masses were then recorded and the tubes were replenished with PBS per the appropriate concentration till the next assay time point.
NP effects on cell viability
The cytotoxicity of PEG-PLGA NPs was assessed using a LIVE/DEAD® viability assay (Invitrogen). Briefly, EaRASMCs were seeded at 30,000 cells/well in sterile, 6-well plates (Nalge Nunc International, Penfield, NY) and cultured over 7 days in DMEM-F12 cell culture medium supplemented with 10% v/v FBS and 1% v/v PenStrep. The 10% DOX-PEG-PLGA NPs were added to medium at a concentration of 0.2 mg/mL for 24 h to offset the burst release and were then added to the EaRASMCs and incubated for 24 h prior to assessing their viability. PEG-PLGA NPs containing no DOX were tested as active agent controls. The cells were stained with a Live/Dead® assay kit and viewed using an Olympus IX51 fluorescence microscope (Olympus America, Center Valley, PA). Cells fluorescing red were identified as dead and those fluorescing green, as viable. Six different regions were assessed for each condition.
Experimental design for cell culture studies to assess effects of NP treatment
After determining an optimal DOX dose and NP formulation, the cell culture experiments previously described were repeated with the replacement of exogenous DOX treatments with treatments of DOX loaded NPs in experiment 2, outlined in Table 2a and 2b. Other than this, the treatment of the 7 day cultures was consistent. Briefly, 0.2 mg/mL of DOX encapsulated NPs (DOX NPs) were reconstituted in DMEM F12 medium with 1% v/v FBS and 1% v/v PS two days prior to treatment to eliminate effects of the initial burst release of DOX. On day 7 post-seeding, following the 3 h serum starvation period, this medium was added to the cell layers in parallel with cytokine stimulation for 30 min. The medium was collected and the cell layers were harvested for analysis. In addition to the previously described RASMC healthy cell controls and treatment controls, cytokine-activated EaRASMCs were treated with 0.2 mg/mL of NPs with no DOX (Blank NPs), prepared in the same manner described above, as a NP control culture.
Table 2A.
Design of culture experiments to assess effects of DOX NPs on cytokine (TNF-α and IL-1β; 10 ng/ml each)-injured EaRASMC layers (7 days).
| Case | Cell Amount/ Type /# Cultures | Day 7 Serum Starve: 3 h Treatment: 30 min |
|---|---|---|
| 1% FBS | ||
| Healthy Cell Controls | 30K, RASMC, n=3 | – |
| Treatment Controls | 30K, EaRASMC, n=3 | Cytokines |
| Blank NPs | 30K, EaRASMC, n=3 | Blank NPs, Cytokines |
| DOX NPs | 30K, EaRASMC, n=3 | DOX NPs, Cytokines |
Table 2B.
Design of experiment to assess effects of DOX NPs on elastic matrix neoassembly and proteolytic activity in cytokine (TNF-α and IL-1β; 10 ng/ml each)-injured EaRASMC cultures. Outcomes were measured in harvested cell layers at 21 days post-seeding.
| Case | Cell Amount/ Type/# Cultures | Day 7 Serum Starve: 3 h Treatment: 30 min | Treatment Day 8 and Day 14 (Till Harvest on Day 21) |
|---|---|---|---|
| 1% FBS | 10% FBS | ||
| Healthy Cell Controls | 30K, RASMC, n=3 | – | – |
| Treatment Controls | 30K, EaRASMC, n=3 | Cytokines | Cytokines |
| Blank NPs | 30K, EaRASMC, n=3 | Blank NPs, Cytokines | Blank NPs, Cytokines |
| DOX NPs | 30K, EaRASMC, n=3 | DOX NPs, Cytokines | DOX NPs, Cytokines |
Separately, cell layers intended for biochemical analysis and imaging of elastic matrix deposition and crosslinking were cultured for a total of 21 days. Similar to the above experiment, at 7 days post-seeding following a 3 h serum starvation period, the EaRASMC cultures were incubated for 30 min with the cytokines, in parallel with, or without NPs (DOX NPs; Blank NPs; treatment controls). Healthy cell control and treatment control cultures were then switched back to culture in DMEM F-12 medium containing 10% v/v FBS and 1% v/v Penstrep. In the NP treated cultures, medium was collected and centrifuged to pellet any NPs not bound to the cell layer. The NP pellets were then re-suspended in fresh DMEM F-12 medium containing 10% v/v FBS and 1% v/v Penstrep and saved for re-application on day 8 post-seeding. This procedure was followed again for medium changes on day 14 post-seeding, with normal medium changes for the healthy cell control and treatment control cultures. After the initial cytokine-induced injury event, the EaRASMC cultures also received additional cytokine treatment on days 8 and 14 post-seeding to simulate chronic cytokine exposure. The treated and control cell layers were all harvested at 21 days post-seeding for imaging and biochemical analysis. The medium was also collected and pooled at every subsequent media change.
The conditions for performing Western blots, gel zymography, ELISA, DNA assay, Fastin assay, and the Desmosine assay described for experiment 1 were followed for experiment 2.
Amplex red peroxide assay for LOX enzyme activity
LOX activity in the cell culture medium collected from the periodic medium changes over the 21 day culture period was analyzed with an Amplex® Red Hydrogen Peroxide assay kit (ThermoFisher). Briefly, a working solution of 100 μM Amplex® Red and 0.2 U/mL horseradish peroxidase in PBS was added to an equal volume of cell layer supernatant to detect hydrogen peroxide produced by active LOX.
Immunofluorescence (IF) detection of elastic matrix
In the NP treatment studies, elastin in the extracellular matrix was visualized using immunofluorescence. Cell cultures (21 days) as described in Table 2b were seeded in glass chamber slides (Nunc™ Lab-Tek™ II Chamber Slide™ System, Thermo Scientific) at 15,000 cells/well. Cell layers were subjected to the stated treatments at 7 days of culture and further cultured until day 21 post-seeding. On day 21 post-seeding, the cell layers were washed with PBS and then fixed in methanol (Fisher Scientific; 4 °C, 30 min). The fixed cell layers were washed with PBS and blocked for 20 min with PBS containing 5% v/v goat serum (ThermoFisher Scientific) and were then immunolabeled with rabbit anti-rat polyclonal antibody against elastin (1:100 v/v dilution, EMD Millipore, Billerica, MA) for 1 h at room temperature. After washing the cell layer 2× with PBS, the secondary antibody labeling step was performed using AlexaFluor 633 goat anti-rabbit (1:1000 v/v dilution, Invitrogen) for 1 h at room temperature in the dark. Cell layers were mounted with Vectashield containing the nuclear stain 4′,6-Diamidino-2-Phenylindole, Dihydrochloride (DAPI; Vector Laboratories, Burlingame, CA). EaRASMC layers treated with the secondary probe alone (no primary antibody) were imaged as IF controls. Cell layers were imaged (Leica SP8 confocal microscope, Leica Microsystems Inc, Buffalo Grove, IL) and 3D reconstructions of Z-stack overlays (0.74 μm intervals) was performed using Volocity® (PerkinElmer, Waltham, MA), and labeled elastic matrix was pseudo-colored to appear green.
Transmission electron microscopy (TEM) of deposited elastic matrix
TEM was first performed to qualitatively assess and compare the shape and size homogeneity of non-hydrated blank and DOX PEG-PLGA NPs. NPs were resuspended in milliQ water at a concentration of 5 mg/mL and 5 μL of this solution was transferred onto a Formvar carbon-coated copper TEM grid (200 mesh size). The NP-containing grids were air dried for several hours and microscopy was performed. TEM images were obtained using a FEI Tecnai Biotwin (ThermoFisher Scientific) at 68 kV accelerating voltage.
TEM was also performed to qualitatively assess elastic matrix ultrastructure and density in the NP treatment culture studies. To image the deposited elastic matrix, EaRASMCs were seeded onto permanox chamber slides (A = 4.2 cm2; Thermo Fisher; 15,000 cells per well). The cell layers were subjected to the previously stated treatments and culture conditions, described in Table 2b. After 21 days of culture, the test and control cultures were washed with PBS (37 °C) and fixed (5 min, 37 °C, 4% w/v paraformaldehyde/ 2.5% w/v glutaraldehyde prepared in 0.1 M sodium cacodylate buffer). Following this, the cell layers were incubated in the fixative overnight at 4 °C. The samples were post-fixed in 1% w/v osmium tetroxide (1 h), dehydrated in a graded ethanol series (50–100% v/v), embedded in Epon 812 resin, sectioned, placed on copper grids, stained with uranyl acetate and lead citrate, and imaged at multiple magnifications. As a result of processing, NPs localized in the extracellular space can be washed away.
Statistical Analysis
Where appropriate, data was analyzed using the Student t-test or one-way ANOVA. In all comparisons, statistical significance was defined at the standard 5% level. Microsoft Excel 2013 (Microsoft) and SigmaPlot 13.0 (Systat Software, Inc) were used in data analysis.
Results
Effects of DOX dose on signaling proteins and MMPs/TIMP-1
In experiment 1, we sought to ascertain the effects of DOX at doses of 0.1, 1, 10, 20, and 50 μg/mL on the expression of the signaling proteins JNK, pJNK, TGF-β1, and on the elastolytic MMP-2 and -9, and TIMP-1. DOX doses at 20 and 50 μg/mL were found to significantly reduce cell proliferation and in the longer term, cause some cytotoxicity, and thus were not pursued further.
Western blot results for JNK (Fig. 1a) show no significant difference in JNK 1 expression in the treatment controls compared to the healthy cell controls. There was no significant difference in JNK 1 expression in the DOX-treated cultures compared to the treatment controls or healthy cell controls, and there was also no significant difference between DOX doses. JNK 2 expression was significantly higher in the treatment controls compared to the healthy cell controls (p < 0.001). JNK 2 expression was significantly lower in the DOX-treated cultures compared to the treatment controls (p < 0.001) and the healthy cell controls (p < 0.001 vs. 0.1 and 10 μg/mL DOX, p = 0.016 vs. 1 μg/mL DOX). Dose effects of DOX on JNK 2 expression were observed, with increased expression in 1 μg/mL DOX-treated cultures compared to 0.1 and 10 μg/mL DOX-treated cultures (p = 0.016 and p = 0.009, respectively). Total JNK expression (not shown) was significantly higher in the treatment controls compared to the healthy cell controls (p < 0.001). Total JNK expression was significantly lower in the DOX-treated cultures compared to the treatment controls (p < 0.001). There was no significant difference in total JNK expression between the DOX-treated cultures and the healthy cell controls or between cultures treated with different DOX doses.
Fig. 1.
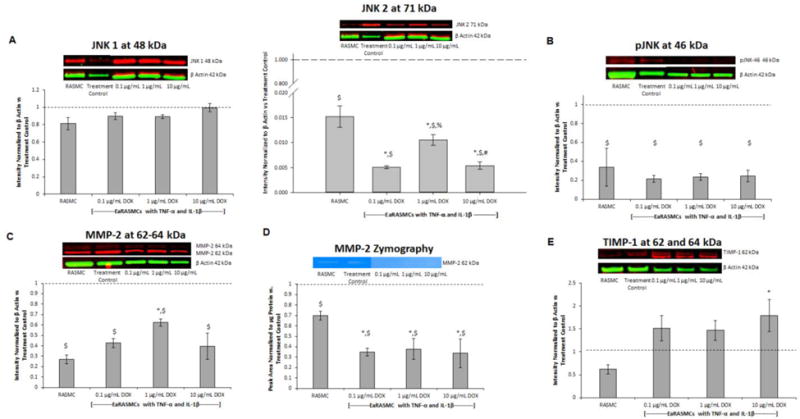
Effects of exogenous DOX dosing on expression of signaling proteins and MMPs/TIMP-1 on 7-day cultures of EaRASMCs subject to 30 minutes of cytokine injury. Panel A: Western blot for JNK isoforms, Panel B: Western blot for active (p) JNK isoforms, Panel C: Western blot MMP2, Panel D: Gel zymography analysis for MMP-2 enzymatic activity, Panel E: Western blot for TIMP-1. RASMC healthy cell controls and DOX-treated cytokine activated EaRASMCs are presented as normalized to DOX-free EaRASMCs (treatment controls) (n = 3 per group; mean ± st. error). * denotes p < 0.05 compared to RASMC healthy cell controls; $ denotes p < 0.05 compared to treatment control; % denotes p < 0.05 compared to 0.1 μg/mL DOX-treated cultures; # denotes p < 0.05 compared to 1 μg/mL DOX-treated cultures
Western blot results for pJNK (Fig. 1b) show significantly higher expression of pJNK-46 kDa in the treatment controls compared to the healthy cell controls (p < 0.001). pJNK-46 kDa expression was significantly lower in DOX-treated cultures compared to the treatment controls (p = 0.001 vs. 0.1 and 1 μg/mL DOX and p < 0.001 vs. 10 μg/mL DOX). There was no significant difference between the DOX-treated cultures and the healthy cell controls, or between the tested DOX doses. pJNK-54 kDa was not detected in the blot.
Western blot results for MMP-2 (Fig. 1c) show significantly higher expression of active MMP-2 (not shown) in the treatment controls compared to the healthy cell controls (p < 0.001). Active MMP-2 expression was significantly lower in the DOX-treated cultures compared to the treatment controls (p < 0.001). Active MMP-2 expression was significantly higher in 1 μg/mL DOX-treated cultures compared to 0.1 and 10 μg/mL DOX-treated cultures (p = 0.028 and p = 0.036, respectively) and was significantly higher in 1 μg/mL DOX-treated cultures compared to healthy cell controls (p = 0.013). Total MMP-2 expression (active and zymogen) was also significantly higher in the treatment controls compared the healthy cell controls (p < 0.001). Total MMP-2 expression was significantly lower in DOX-treated cultures compared to the treatment controls (p < 0.001 vs. 0.1 and 10 μg/mL DOX and p = 0.002 vs. 1 μg/mL DOX). There was no significant difference in total MMP-2 expression between the 0.1 and 10 μg/mL DOX-treated cultures and the healthy cell controls, but expression was significantly higher in the 1 μg/mL DOX-treated cultures compared to healthy cell controls (p = 0.014). MMP-9 protein was not detected in any of the cultures.
Gel zymography results (Fig. 1d) show significantly higher MMP-2 activity in the treatment controls compared to the healthy cell controls (p = 0.008). MMP-2 activity was significantly lower in the DOX-treated cultures compared to the treatment controls (p < 0.001) and the healthy cell controls (p = 0.008 vs. 0.1 μg/mL DOX, p = 0.005 vs. 1 μg/mL DOX, p = 0.011 vs. 10 μg/mL DOX). There was no significant difference between the DOX doses. MMP-9 activity was not detected in any cultures.
Western blot results for TIMP-1 (Fig. 1e) show no significant difference in TIMP-1 expression in the treatment controls compared to the healthy cell controls. TIMP-1 expression was significantly higher in the 10 μg/mL DOX-treated cultures compared to the healthy cell controls (p = 0.03). There was no significant differences in TIMP-1 expression between any of the other culture groups.
ELISA results (Fig. 2) show significantly lower TGF-β1 expression in the treatment controls compared to the healthy cell controls (p = 0.005). TGF-β1 expression was significantly higher in the 10 μg/mL DOX-treated cultures compared to the 0.1 μg/mL DOX-treated cultures and the treatment controls (p < 0.001 and p = 0.004, respectively), but there was no significant difference compared to the 1 μg/mL DOX-treated cultures and the healthy cell controls. TGF-β1 expression was significantly higher in the 1 μg/mL DOX-treated cultures compared to the 0.1 μg/mL DOX-treated cultures (p < 0.001), but there was no significant difference compared to the treatment controls and healthy cell controls. TGF-β1 expression was significantly lower in the 0.1 μg/mL DOX-treated cultures compared to the treatment controls and healthy cell controls (p = 0.005 and p < 0.001, respectively).
Fig. 2.
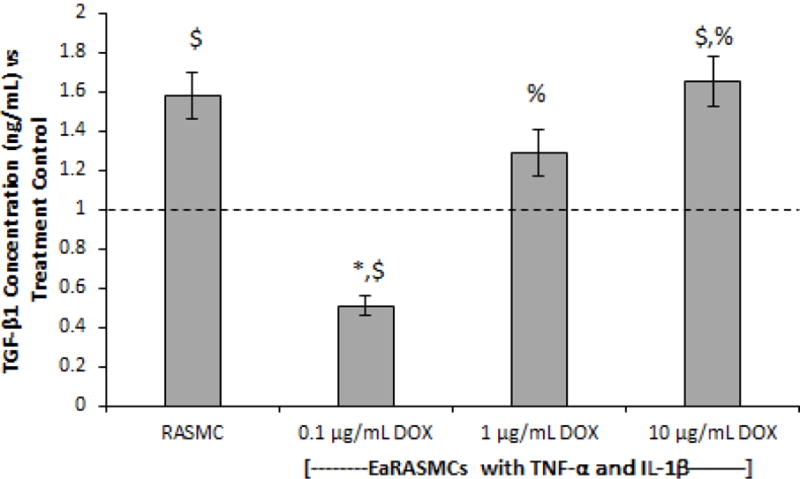
Effects of exogenous DOX on TGF-β1 expression on 7-day cultures of EaRASMCs subject to 30 minutes of cytokine injury. TGF-β1 levels were measured using ELISA. RASMC healthy cell controls and DOX-treated cytokine activated EaRASMCs are presented as normalized to the DOX-free, cytokine-activated EaRASMCs (treatment controls) (n = 3 per group; mean ± st. error). * denotes p < 0.05 compared to RASMC healthy cell controls; $ denotes p < 0.05 compared to treatment control; % denotes p < 0.05 compared to 0.1 μg/mL DOX-treated cultures
Effects of DOX dosing on cell proliferation and on elastic matrix deposition and crosslinking
DNA assay results (Fig. 3a) show significantly higher DNA content (cell proliferation) in the treatment controls compared to the healthy cell controls (p = 0.03). Cultures treated with 0.1 μg/mL DOX proliferated significantly more rapidly versus the 1 and 10 μg/mL DOX-treated cultures (p = 0.013 and p < 0.001, respectively) and also the treatment controls and the healthy cell controls (p < 0.001). DNA content in the 1 μg/mL DOX-treated cultures was significantly greater compared to the 10 μg/mL DOX-treated cultures and the healthy cell controls (p = 0.007 and p = 0.006, respectively), but there was no significant difference compared to the treatment controls. The 10 μg/mL DOX-treated cultures had significantly lower DNA content compared to the treatment controls (p = 0.005), but was not different from the healthy cell controls.
Fig. 3.
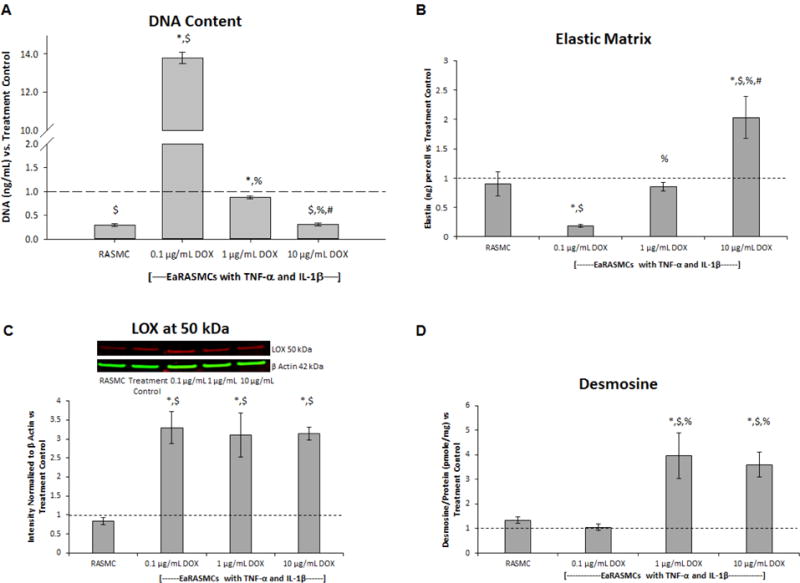
Effects of exogenous DOX on cell proliferation (A) elastic matrix deposition (B), expression of the elastin crosslinking enzyme lysyl oxidase (LOX) (C), and desmosine crosslinking of elastic matrix (D) in 21 day cultures of cytokine-activated EaRASMCs. Outcomes in the RASMC (healthy cell controls) and DOX-treated EaRASMC cultures are presented as normalized to the DOX-free cytokine-activated EaRASMCs (treatment controls) (n = 3 per group; mean ± st. error). * denotes p < 0.05 compared to RASMC healthy cell controls; $ denotes p < 0.05 compared to treatment control; % denotes p < 0.05 compared to 0.1 μg/mL DOX-treated cultures; # denotes p < 0.05 compared to 1 μg/mL DOX-treated cultures
Fastin assay results (Fig. 3b) show no significant difference in elastic matrix production in the treatment controls compared the healthy cell controls. Elastic matrix production was significantly higher in the 10 μg/mL DOX-treated cultures compared to the 0.1 and 1 μg/mL DOX-treated cultures (p < 0.001), and the treatment controls and the healthy cell controls (p < 0.001). Elastic matrix production was significantly increased in the 1 μg/mL DOX-treated cultures compared to the 0.1 μg/mL DOX-treated cultures (p < 0.001), but there was no significant difference compared to the treatment controls and the healthy cell controls. Elastic matrix production was significantly lower in the 0.1 μg/mL DOX-treated cultures compared to both the treatment controls and the healthy cell controls (p = 0.008 and p = 0.003, respectively).
Western blot results for LOX (Fig. 3c) show no significant difference in LOX expression in the treatment controls compared to the healthy cell controls. Significantly higher expression of LOX was noted in the DOX-treated cultures compared to the treatment controls (p = 0.005 vs. 0.1 μg/mL DOX, p = 0.002 vs. 1 μg/mL DOX, p = 0.004 vs. 10 μg/mL DOX) and the healthy cell controls (p = 0.004 vs. vs. 0.1 μg/mL DOX, p = 0.003 vs. 1 and 10 μg/mL DOX). There was no significant difference between the DOX doses.
Desmosine assay results (Fig. 3d) show no significant difference in desmosine crosslinker amounts in the treatment controls compared to the healthy cell controls. Desmosine amounts were significantly higher in the 10 μg/mL DOX-treated cultures compared to the 0.1 μg/mL DOX-treated cultures, the treatment controls, and the healthy cell controls (p = 0.009, p = 0.041, p = 0.006, respectively). Cultures treated with 1 μg/mL of DOX also contained significantly higher desmosine content compared to the 0.1 μg/mL DOX-treated cultures, the treatment controls, and the healthy cell controls (p = 0.006, p = 0.026, p = 0.005, respectively). There was no significant difference in desmosine production between the 1 and 10 μg/mL DOX-treated cultures. There was no significant difference in desmosine content between the 0.1 μg/mL DOX-treated cultures and either of the controls.
Effects of choice of surfactant on PEG-PLGA NP properties
A Rose Bengal assay was performed on NPs prepared with different cationic surfactants (0.25, 0.5, 1.0, and 1.5% and CTAB, DMAB, DTAB, and OTAB) to measure their hydrophobicity. Additionally, the hydrodynamic diameter and zeta potential was quantified for each NP preparation. Results (Fig. 4) suggest that DMAB imparted the highest hydrophobicity among the tested surfactants followed by DTAB, OTAB, and CTAB. NP size for the most part was unaffected by choice of surfactant while the zeta potential was negative for DTAB alone, and positive in all other cases, with imparted surface charge with the latter formulations increasing in the order CTAB < DMAB < OTAB.
Fig. 4.
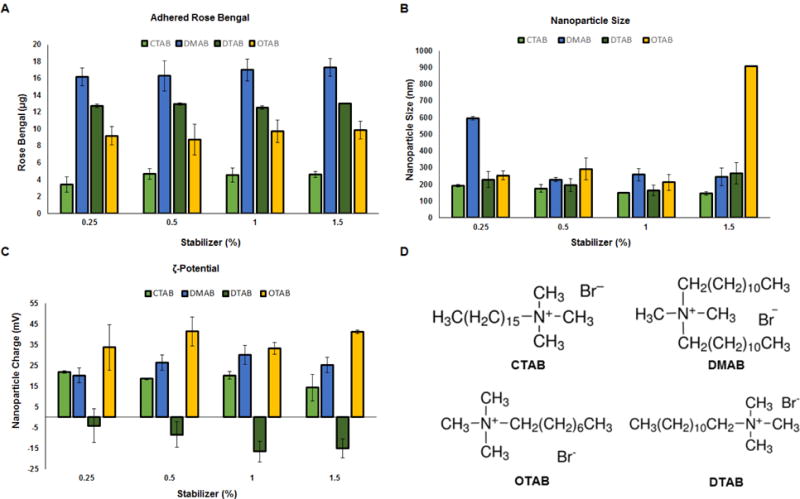
Effect of choice of cationic amphiphile surfactants and surfactant concentrations on hydrophobicity (A), hydrodynamic sizes (nm) (B), and surface zeta potential (mV) (C) of PEG-PLGA methyl ether NP formulations (n = 3 per group, mean ± st. dev). Panel D shows the chemical structures of the different cationic amphiphile surfactants tested
Formulation and characterization of DOX-loaded PEG-PLGA NPs
The blank PEG-PLGA NPs exhibited a mean hydrodynamic diameter (or hydrated particle size) of 254.5 ± 36.8 nm and a ζ-potential of +24.2 ± 2.4 mV. Encapsulation at 2, 5, 10% (w/w ratios to PEG-PLGA) did not significantly alter the size and surface charge of these PEG-PLGA NPs (Table 3). DOX encapsulation efficiencies ranged between 73–87%. TEM (Fig. 7B) showed that non-hydrated PEG-PLGA NPs maintained their spherical morphology post-lyophilization with or without the encapsulation of DOX.
Table 3.
Size and surface charge of PEG-PLGA NPs encapsulating DOX, formulated with DMAB as the emulsion stabilizer (n=3 replicate formulations; mean ± st. dev)
| 1% DMAB PEG-PLGA | Size (nm) | Charge (mV) | DOX Encapsulation (%) |
|---|---|---|---|
| 0% w/w DOX | 254.5 ± 36.8 | 24.2 ± 2.4 | N/A |
| 2% w/w DOX | 246.1 ± 4.4 | 21.8 ± 3.0 | 72.95 ± 4.5 |
| 5% w/w DOX | 285.9 ± 14.9 | 25.1 ± 2.0 | 82.11 ± 1.0 |
| 10% w/w DOX | 269.8 ± 31.7 | 23.5 ± 5.8 | 87.42 ± 2.3 |
Fig. 7.
Schematic showing design of DOX-releasing PEG-PLGA methyl ether NPs (A). TEM indicated similar morphology and size of 0% and 10% w/w DOX-loaded PEG-PLGA-methyl ether NPs. A LIVE/DEAD cytotoxicity assay indicated EaRASMCs exposed for 24 h to 0% and 10% w/w DOX-loaded PEG-PLGA-methyl ether NPs (0.2 mg of NPs/mL) to be viable, Scale bar = 100 μm
DOX release from PEG-PLGA NPs in vitro
The in vitro release profiles for DOX from PEG-PLGA NPs are shown at 0.5 mg/mL for DOX loadings at 2, 5, and 10% DOX w/w PEG-PLGA (60 days, Fig. 5) and at 0.2 mg/mL (30 days, (Fig. 6a). The DOX release curves obtained exhibit a biphasic release profile, which is characterized by an initial burst phase spanning the first couple days followed by a relative steady-state, near zero-order behavior from PEG-PLGA NPs. The cumulative release of loaded-DOX over 60 days was 79.4 ± 19.6%, 20.3 ± 3.8%, and 7.7 ± 3.2% for the 2, 5, and 10% DOX-loaded NPs at a concentration of 0.5 mg/mL. The cumulative release of DOX over 30 days was about 10% of the total DOX encapsulated for 10% DOX-loaded PEG-PLGA NPs at 0.2 mg/mL, the NP concentration at which they were delivered to cells in culture studies below.
Fig. 5.
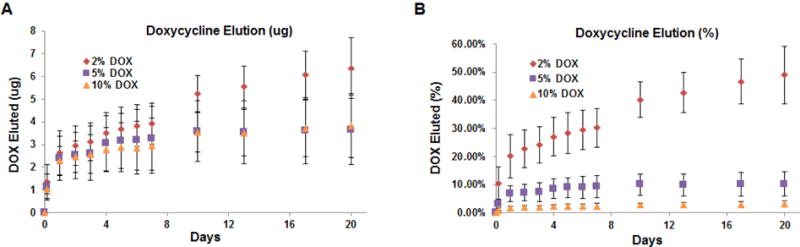
in vitro DOX release from PEG-PLGA methyl ether NPs loaded with 2, 5, and 10% w:w ratio of DOX to PEG-PLGA at a NP concentration of 0.5 mg/mL Release was measured over 60 days and is shown as cumulative amounts (μg) released (A) and cumulative % of loaded DOX released (B) (n = 3 per group; mean ± st. dev)
Fig. 6.
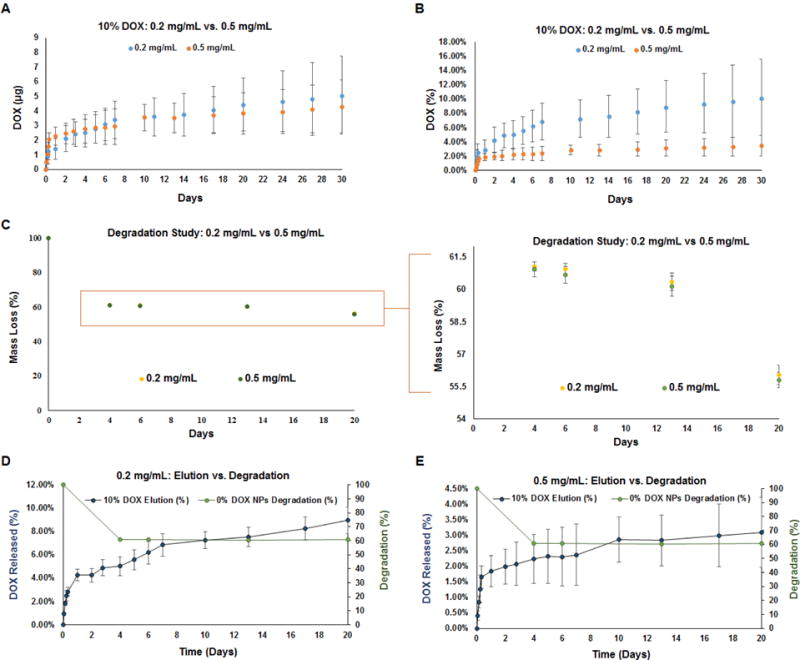
Plots showing time profile of in vitro DOX release from 10% w/w DOX-NPs at 0.2 mg/mL and 0.5 mg/mL concentrations, measured over 30 days. Plot in panel A indicates cumulative DOX amounts released (μg) and panel B indicates cumulative % of theoretically loaded DOX amounts. Panel C compares degradation profiles of 0% w/w DOX-NPs at concentrations of 0.2 and 0.5 mg of NPs/mL, measured over 20 days. Burst release of DOX from 10% w/w DOX-NPs coincided with rapid initial degradation of the polymer nanocarriers, both at 0.2 mg/of NPs/mL (Panel D) and 0.5 mg of NPs/mL (Panel E). Values shown indicate mean ± st. dev and were obtained by analysis of n=3 replicates per group
Degradation of PEG-PLGA NPs
The degradation of 0% w/w DOX PEG-PLGA blank NPs was performed over 20 days at 0.2 and 0.5 mg/mL. The data (Fig. 6c–e) shows a sharp decrease in mass of the NPs from day 0 to day 4 and a gradual decrease from day 4 to day 20. Over 20 days, 0% w/w DOX NPs at concentrations of both 0.2 mg/mL and 0.5 mg/mL exhibited ~44% loss in mass.
Assessing cytotoxicity of DOX-loaded PEG-PLGA NPs
The design of our final PEG-PLGA NP formulations prepared with DMAB (1 w/v %) is shown in Fig. 7a. At a concentration of 0.2 mg/mL, blank and 10% w/w DOX-loaded PEG-PLGA NPs did not affect the viability of EaRASMCs as assessed by a LIVE-DEAD® assay. The absence of any dead (red) cells in the fluorescence images for both the blank and 10% w/w DOX NPs demonstrate that the PEG-PLGA NPs were not cytotoxic (Fig. 7c). This assay was not performed at an NP dose of 0.5 mg/mL as it was found to cause cell death 2–3 days post addition to cell cultures.
Effects of DOX NPs on signaling protein and MMPs/TIMP-1 expression
Western blot results for JNK (Fig. 8a) show no significant difference in JNK 1 expression in the treatment controls compared to the healthy cell controls. There was no significant difference in JNK 1 expression in the DOX NP-treated cultures and Blank NP-treated cultures compared to the treatment controls or healthy cell controls, or between the NP-treated cultures. JNK 2 expression was significantly higher in the treatment controls compared to the healthy cell controls (p < 0.0001). JNK 2 expression was significantly lower in the DOX NP-treated cultures and Blank NP-treated cultures compared to the treatment controls (p = 0.002 and p = 0.0007, respectively), but significantly higher compared to the healthy cell controls (p = 0.031 and p = 0.012, respectively). There was no significant difference in JNK 2 expression between the NP-treated cultures. Total JNK expression (not shown) was significantly higher in the treatment controls compared to the healthy cell controls (p < 0.0001). Total JNK expression was significantly lower in DOX NP-treated cultures and Blank NP-treated cultures compared to the treatment controls (p = 0.0007 and p = 0.005, respectively), but significantly higher than the healthy cell controls (p < 0.0001 and p = 0.006, respectively). There was no significant difference in total JNK expression between the NP-treated cultures.
Fig. 8.
Effects of DOX-free (Blank) NPs and 10% w/w DOX-loaded NPs (0.2 mg/mL) on expression of signaling proteins and MMPs/TIMP-1 in 7 day EaRASMC cultures following 30 min of incubation in parallel with cytokine injury. Shown are results for western blot analysis for JNK isoforms (A), active (p) JNK isoforms (B), total MMP2 (C) and TIMP-1 (E). Panel D shows a gel zymogram for MMP2 enzyme activity. In all cases, outcomes in the healthy controls (NP free RASMCs) and NP-treated, cytokine activated EaRASMCs are normalized to cytokine-activated EaRASMCs (treatment controls) (n = 3 per group; mean ± st. error). * denotes p < 0.05 compared to RASMC healthy cell controls and treatment controls respectively
Western blot results for pJNK (Fig. 8b) show significantly higher pJNK-54 kDa expression in the treatment controls compared to the healthy cell controls (p = 0.011). pJNK-54 kDa expression was significantly higher in DOX NP-treated cultures and Blank NP-treated cultures compared to the healthy cell controls (p = 0.02, and p = 0.007, respectively). There was no significant difference in pJNK-54 kDa expression in DOX NP-treated cultures and Blank NP-treated cultures compared the treatment controls, or between the NP-treated cultures. pJNK-46 kDa expression was not detected in the cultures.
Western blot results for MMPs (Fig. 8c) show significantly higher expression of active MMP-2 (62 kDa, not shown) in the treatment controls compared to the healthy cell controls (p = 0.001). Active MMP-2 expression was significantly lower in the DOX NP-treated cultures and Blank NP-treated cultures compared to the treatment controls (p = 0.0026 and p = 0.006, respectively). There was no significant difference in active MMP-2 expression in the DOX NP-treated cultures and Blank NP-treated cultures compared to the healthy cell controls, or between the NP-treated cultures. Total MMP-2 (active and zymogen) expression was significantly higher in the treatment controls compared to the healthy cell controls (p = 0.002). Total MMP-2 expression was significantly lower in the DOX NP-treated cultures and Blank NP-treated cultures compared to the treatment control (p = 0.004 and p = 0.008, respectively) and was significantly higher compared to the healthy cell controls (p = 0.026 and p = 0.024, respectively). There was no significant difference in total MMP-2 expression between the NP-treated cultures. MMP-9 was not detected in any of the cultures.
Gel zymography results (Fig. 8d) show significantly higher MMP-2 activity in the treatment controls compared to the healthy cell controls (p = 0.0005). MMP-2 activity was significantly lower in the DOX NP-treated cultures and Blank NP-treated cultures compared to the treatment controls (p = 0.015 and p = 0.007, respectively) and to the healthy cell controls (p = 0.03). There was no difference in MMP-2 activity between the NP-treated cultures. MMP-9 activity was not detected in any of the cultures.
Western blot results for TIMP-1 (Fig. 8e) show significantly higher TIMP-1 expression in the treatment controls compared to the healthy cell controls (p = 0.033). There was no significant difference in TIMP-1 expression in the DOX NP-treated cultures and Blank NP-treated cultures compared to the treatment controls or the healthy cell controls. There was no significant difference in TIMP-1 expression between the NP-treated cultures.
ELISA results for TGF-β1 (Fig. 9) show significantly lower TGF-β1 expression in the treatment controls compared to the healthy cell controls (p = 0.02). TGF-β1 expression was significantly higher in the DOX NP-treated cultures compared to the Blank NP-treated cultures, the treatment controls, and the healthy cell controls, and (p = 0.02, p = 0.02, and p = 0.048, respectively). There was no significant difference in TGF-β1 expression in the Blank NP-treated cultures compared to the treatment controls or the healthy cell controls.
Fig. 9.
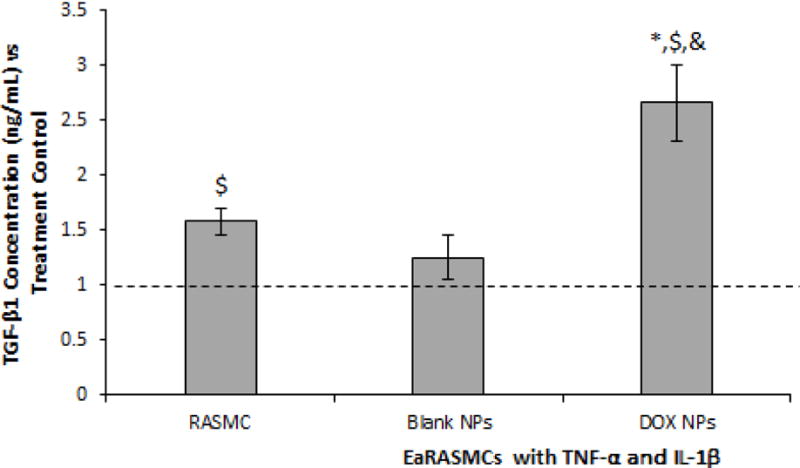
Effects of blank and 10% w/w DOX-NPs (0.2 mg/mL) on TGF-β1 in cytokine-activated EaRASMC cultures, as analyzed with ELISA. Untreated RASMC cultures were analyzed as healthy cell controls and NP untreated cytokine activated EaRASMCs as treatment controls. All values are shown normalized to the treatment controls (n = 3 per group; mean ± st. error). *, $, and & denote significance of differences deemed for p < 0.05 compared to healthy cell controls, treatment controls; and blank NP-treated cultures
Effects of DOX NPs on cell proliferation, elastic matrix deposition and crosslinking
DNA assay results (Fig. 10a) show significantly higher DNA content (cell proliferation) in the treatment controls compared to the healthy cell controls (p < 0.0001). Cell proliferation was significantly lower in the DOX NP-treated cultures and Blank NP-treated cultures compared to the treatment controls (p = 0.0004 and p = 0.003), but significantly higher compared to the healthy cell controls (p < 0.0001). There was no significant difference between the NP treated cultures.
Fig. 10.
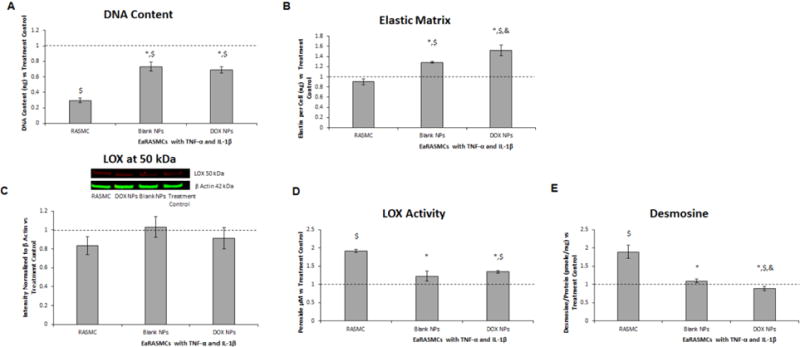
Effects of blank and 10% w/w DOX-NPs (0.2 mg/mL) on cell proliferation (A), elastic matrix deposition (B), LOX protein synthesis (C), LOX enzyme activity (D), and desmosine crosslink amounts within the elastic matrix (E) in 21 day cultures of cytokine activated EaRASMCs. Also shown are NP-untreated RASMCs (healthy controls). All values have been shown normalized to outcomes in cytokine-activated, but NP-untreated EaRASMC cultures (treatment controls) (n = 3 per group; mean ± st. error). *, $, and & denote significance of differences deemed for p < 0.05 compared to RASMC healthy cell controls, treatment control and blank NP-treated cultures respectively
Fastin assay results (Fig. 10b) show no significant difference in elastic matrix production in the treatment controls compared to the healthy cell controls. Elastic matrix production was significantly higher in the DOX NP-treated cultures compared to the Blank NP-treated cultures, the treatment controls, and the healthy cell controls (p = 0.04, p = 0.002, and p = 0.0004, respectively). Elastic matrix production was significantly higher in the Blank NP-treated cultures compared to the treatment controls and the healthy cell controls (p = 0.002 and p = 0.0006, respectively).
Western blot results for LOX (Fig. 10c) show no significant differences between any of the culture groups. As seen in (Fig. 10d), there was significantly lower LOX activity in the treatment controls compared to the healthy cell controls (p < 0.0001). LOX activity was significantly higher in the DOX NP-treated cultures compared to the treatment controls and the healthy cell controls (p = 0.005 and p < 0.0001). LOX activity was significantly lower in the Blank NP-treated cultures compared to the healthy cell controls (p = 0.02). There was no significant difference in LOX activity between the NP-treated cultures.
Desmosine assay results (Fig. 10e) show significantly lower desmosine crosslinker amounts in the treatment controls compared to the healthy cell controls (p = 0.0025). Desmosine amounts were significantly lower in the DOX NP-treated cultures compared to the Blank NP-treated cultures, the treatment controls, and the healthy cell controls (p = 0.013, p = 0.048, and p = 0.001 respectively). There was no significant difference in desmosine content in the Blank NP-treated cultures compared to the treatment controls, but desmosine content was significantly lower in the Blank NP-treated cultures compared to the healthy cell controls (p = 0.003).
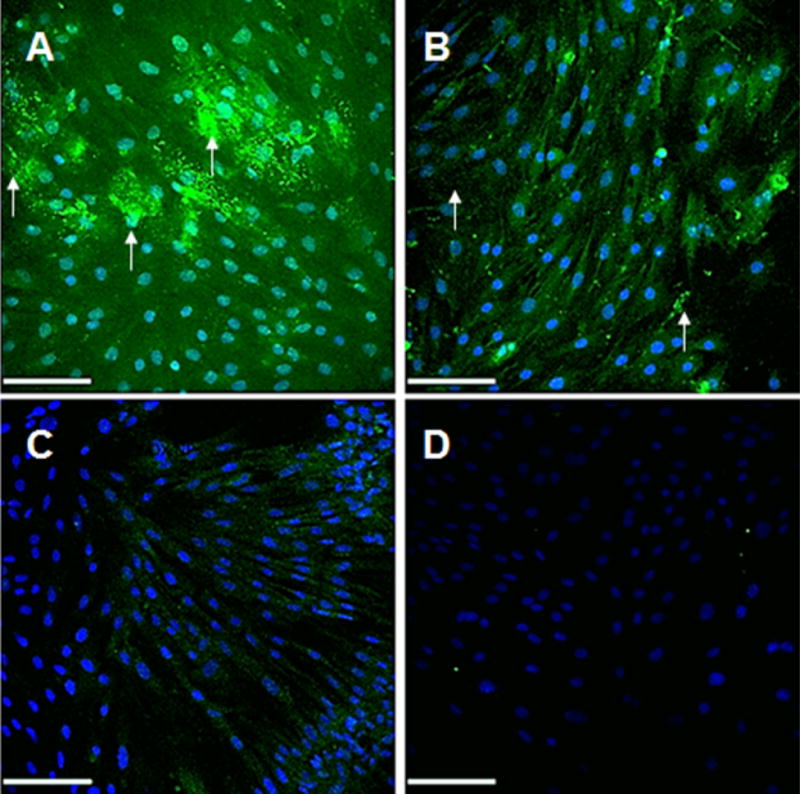
IF labeling for elastic matrix results (Fig. 11) show more elastic matrix (green) in the extracellular space, as denoted with white arrows, and tropoelastin within the cell, in the DOX NP-treated cultures compared to the Blank NP-treated cultures and the treatment controls and greater expression of tropoelastin within cells in the Blank NP-treated cultures compared to the treatment controls.
Fig. 11.

Immunofluorescence (IF) micrographs showing significantly increased elastic matrix (green) deposition in 10% w/w DOX-NP treated (A) and blank NP treated (B) EaRASMC cultures (21 days) versus treatment controls (C). Also shown are IF controls that received no primary antibodies and exhibited no background when treated with the AF 633-conjugated secondary antibody (pseudo-colored green). While in all cases tropoelastin was detected within the cells, extracellular elastic matrix deposits were also seen in the NP treated cultures (white arrows). Arrows indicate extracellular matrix in the NP treated cultures. Scale bars are 100 μm
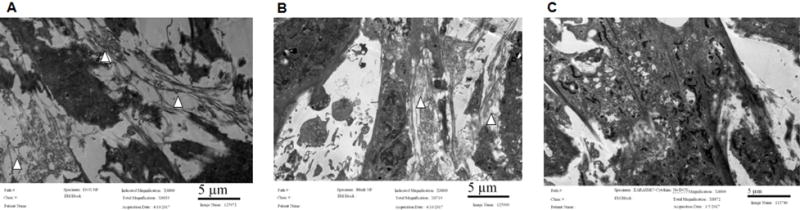
Transmission electron micrographs (Fig. 12) show significantly more elastic matrix and forming fibers in the DOX NP-treated and Blank NP-treated cultures versus the treatment controls.
Fig. 12.
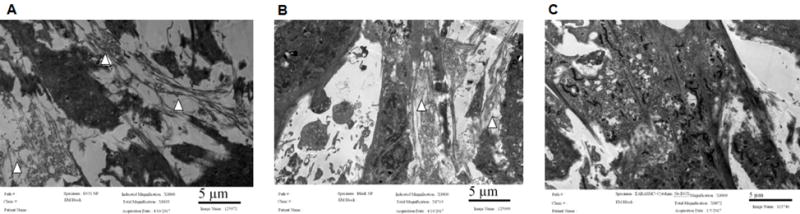
Transmission electron micrographs show significantly higher density of forming elastic fibers (white arrows) in DOX-NP and blank NP treated EaRASMC cultures compared to the treatment controls, which contained very few elastin deposits and no fibers. All cell layers were cultured for 21 days
Discussion
While AAAs are frequently detected early due to proactive imaging based screening of high risk individuals, there are no established drug based treatments for small (< 5.5 cm maximal diameter) AAAs. Current management is limited to periodic imaging based growth monitoring to a pre-rupture stage when endovascular or open surgery are warranted. Our long term goal is to make available a regenerative therapy that would seek to overcome two critical pathophysiologic drivers of small AAA growth, namely chronically upregulated proteolysis in the AAA wall by MMPs and naturally irreversible breakdown of elastic fiber structures in the elastic wall, an outcome of the poor elastogenic capacity of adult vascular cells [6,8,18]. While oral therapy with doxycycline (DOX; ~50 mg/kg/day equivalent to ~30 μg/cm3 in AAA wall) an MMP inhibitor, has been shown to inhibit these MMPs to slow AAA growth [9,19–21], at these high systemic doses DOX a) inhibits deposition of new, crosslinked elastic matrix by SMCs in the AAA wall preventing restoration of elastin homeostasis [22], and b) causes body-wide inhibition of MMPs which are also involved in healthy tissue turnover. In a prior study, we showed for the first time that at a much lower dose range (< 10 μg/ml), DOX still maintains its anti-MMP properties, but also stimulates elastic fiber assembly (elastogenesis) [7].
The dual effects of DOX at low doses mimics the outcomes that have been reported upon inhibiting c-jun-N-terminal kinase (JNK; a stress-activated protein kinase that is upregulated in AAA tissues) with the drug, SP600125 [23]. SP600125 inhibition of JNK has been shown to increase elastin mRNA, matrix crosslinking, & decrease MMP activity & apoptosis which have been linked to AAA regression in mice [10]. However, the drug has poor target specificity and poorly inhibits elastolytic MMP-2, which is central to AAA etiology [24]. This motivates us to investigate the use of DOX. While DOX is known to inactivate MMPs directly by engaging their active site [21], and also by possible fragmentation of the protein, in this study, we investigated DOX inhibition of the JNK pathway as an additional regulatory mechanism for the downstream MMP-mediated proteolysis and elastic matrix synthesis, crosslinking and fiber formation. We have tested these effects in cytokine (TNF-α, IL-1β)-activated cultures of aneurysmal rat aortic SMCs isolated from a rat elastase-injury model that closely replicates human AAAs [25–27]; in prior published work, we have extensively characterized these cells and shown them to maintain their diseased phenotype in culture and respond to elastogenic stimulation [6]. TNF-α and IL-1β are cytokines that are overexpressed within the AAA wall and play key roles in AAA pathophysiology [28]. While we initially tested DOX doses as high as 50 μg/ml (data not shown), we showed significant inhibition in cell proliferation at doses of 10 μg/ml and higher, with cytotoxicity observed at 20 and 50 μg/ml doses, which is consistent with findings by other groups [29,30]. Our study suggests strongly that at DOX doses, specifically between 1 and 10 μg/ml, it effectively attenuates total JNK protein expression to levels expressed by healthy control RASMCs. This was primarily due to inhibition of the JNK 2 isoform, also known as mitogen activated protein kinase 9 (MAPK9) which was reduced to levels even below that expressed by the RASMCs. Importantly, expression of the active JNK isoform (p-JNK; 46 kDa) was also decreased. We noted some DOX dose dependency with a local minima in JNK inhibition observed at the 1 μg/ml dose. This trend paralleled DOX-inhibition of MMP-2 protein, which were reduced by to levels expressed by the healthy RASMC controls, which suggests that in the studied dose range, DOX inhibition of MMPs is primarily mediated by its attenuation of JNK. MMP-2 enzyme activity was also significantly reduced by ~70% relative to the treatment controls and by ~50% versus the healthy RASMCs. Our inability to detect MMP-9, which also plays an important role in AAA pathophysiology was not unexpected since constitutional protein expression of MMP-9 by cultured SMCs is minimal as we have amply demonstrated in our prior studies [7,14]. DOX treatment also caused significant increases in TIMP-1, which is a highly beneficial outcome because their combined effects on MMP-2 implies significant decreases in MMP-2/TIMP-1 ratios evocative of an anti-proteolytic milieu. DOX inhibition of JNK was also found to increase transforming growth factor β1 (TGF-β1). This is consistent with literature showing that JNK antagonizes TGF-β1 [13,31]. In earlier work, we have also demonstrated that exogenous TGF-β1 stimulates elastogenesis [6]. Losy et al. [32] have also reported that transient paracrine secretion of TGF-β1 by endovascularly seeded SMCs in rat AAAs decreases proteolysis by reducing MMP expression, and by upregulating TIMP-1, 2, and 3 mRNA expression by various vascular cell types (SMCs, fibroblasts) in situ. Our findings mirror these earlier outcomes. In addition, Losy et al. showed TGF-β1 to enhance production of lysyl oxidase (LOX), the enzyme that catalyzes crosslinking of collagen and elastin and fiber formation [32]. Dai et al. also showed that TGF-β1 overexpression slows AAA growth in mice [33], which could be attributed to these collective effects of TGF-β1 increases. Our observations as to the significant upregulation of LOX protein synthesis in DOX-treated cultures to levels much higher than that in treatment and even healthy controls are consistent with these earlier findings and implies benefits in terms of increasing deposition of a crosslink-stabilized and fibrous elastic matrix. Indeed, elastic matrix production by EaRASMCs on a per cell basis was stimulated by DOX as a direct function of provided dose, a trend that mirrors induced increases in TGF-β1 expression. On the other hand, at the 0.1 μg/ml dose, DOX caused significant stimulation of EaRASMC proliferation above levels seen in RASMC cultures, which is not a desirable outcome despite obviously implied benefits to total elastic matrix deposition. This is because a substantial subset of AAAs tend to be associated with atherosclerosis, which involves plaque formation triggered by rapid proliferation and migration of medial and/or intimal SMCs towards the vessel lumen, a phenomenon that low DOX dosing could exacerbate. On the other hand, at the 10 μg/ml dose, a mild decrease in EaRASMC proliferation was observed relative to treatment, which is not a preferred outcome. Consistent with increases in LOX protein, we also measured significantly higher desmosine crosslinks within the cell layer, which implies an elastic matrix that is more resistant to proteolytic disruption. Collectively, the data generated in the exogenous DOX dosing study shows that DOX inhibition of JNK 2 to coincide with decreased proteolysis and increased LOX-mediated crosslinking activity, though none of these outcomes were dependent on DOX dose in the tested range. Differently, increases in TGF-β1 and elastic matrix production, which we expected to increase upon JNK inhibition, based on previous literature [23,34], occurred at the highest 10 μg/ml DOX dose alone; this suggests that there are likely other TGF-β1 countering, JNK-mediated cell signaling pathways that may be incited by DOX at doses < 10 μg/ml, and especially at the 0.1 μg/ml dose, which in turn could have influenced elastin synthesis. Also, elastic matrix assembly involves spatio-temporal coordination of numerous other regulatory proteins which could have certainly been influenced as a function of DOX dose, resulting in the net outcomes we observed. These collective outcomes, together with the observed hyper-proliferation of the EaRASMCs at the 0.1 μg/ml DOX dose and contrarily, reduced proliferation vs. untreated EaRASMCs at the 10 μg/ml led us to identify a dose range of 1–10 μg/ml as appropriate to achieve JNK mediated pro-elastogenic and anti-proteolytic effects, with minimal effects on cell proliferation. AAA-tissue localized, and sustained low level DOX release within this defined dose range using NP vehicles would be a useful modality to provide pro-elastogenic and anti-MMP benefit while avoiding systemic DOX biodistribution and effects.
In a previous study [7], we developed biodegradable polylactic-co-glycolic acid (PLGA) NPs designed to provide predictable, sustained & steady-state low level DOX release locally in AAA tissue following single-event intra-aortal infusion. The NPs were surface-functionalized with cationic amphiphiles (DMAB) to provide pro-elastogenic and anti-MMP stimuli, independent of the released DOX [7]. These were attributed to the a) cationic groups and b) di-chain hydrophobic acyl groups presented by the pendant cationic amphiphiles on the NP surface. While the cationic moieties electrostatically attract LOX, which is anionic at physiologic pH, to enhance its local crosslinking activity [35,36], they have also been shown to interact with anionic amino acids in the active site of the MMPs [37], resulting in altered configuration of this site to render it unrecognizable to the complementary peptide sequences present in matrix proteins (e.g. elastin and collagen). Differently, the hydrocarbon chains of the amphiphiles, through their binding to hydrophobic domains on elastin substrates has been suggested to change the molecular conformation of the latter to expose lysine residues for more ready crosslinking by LOX [36]. As we have previously published [7], it is also possible that the long dodecyl chains of the DMAB sterically hinder the active site of the MMP leading to its inactivation. Due to these beneficial features, we have retained these design aspects in our current NP design presented in Fig. 7. Different however, from our previous NP design we now use a PEG-PLGA copolymer instead of PLGA. PEG is known to provide stealth properties to NPs [38,39], enhancing their circulation time and also limiting surface adsorption of plasma proteins that could trigger their opsonization by macrophages in the AAA wall preventing their targeted effects on the aneurysmal SMCs. Since PEG is hydrophilic, we expected use of the copolymer to decrease surface charge and hydrophobicity of our NP formulations relative to that we previously achieved with DMAB modified PLGA NPs and for this reason also tested other NP formulations prepared with DMAB homologues. While this was indeed the case, our NPs continued formulation using DMAB as a surfactant continued to maintain a) a significant positive charge (~20 mV), necessary to facilitate their uptake into the AAA wall [40], electrostatically interact with SMCs which exhibit a net negative charge (resting membrane potential of −55 mV) [41], and provide anti-proteolytic and pro-elastin crosslinking effects, and b) a hydrophobic surface that would allow the NPs to bind to the exposed elastin core of elastic fibers in need of repair within the AAA wall for localized reparative activity. Kagan et al. also showed that hydrophobic binding of such amphiphiles to elastin changes its molecular conformation, leading to exposure of its lysine residues for crosslinking by LOX, outcomes that we will discuss separately [36]. NP size was not significantly altered by our choice of surfactant, with most NPs in the 200–300 nm size range we previously showed to exclude them to the extracellular space where matrix assembly occurs [7]. Therefore, our selection of DMAB as the surfactant of choice was based on a) DMAB generating NPs exhibiting the greatest hydrophobicity, a likely effect of their presenting two, not one hydrocarbon chains, and b) elimination of OTAB, which generates surface charges (~+45 mV) high enough to potentially compromise viability of our cells [7], and DTAB, since it consistently generated NPs exhibiting a negative rather than positive surface charge, an outcome likely influenced by the use of a diblock PEG-PLGA copolymer since we have previously generated PLGA NPs with a positive surface charge with the use of a DTAB surfactant [7]. We hypothesize that the PEG chains mask the presence of the cationic moiety presented by the DTAB on the NP surface, preventing their detection.
The DOX release profile from our NP formulations was consistent with what we reported previously with PLGA-based DOX-NPs [7] and also by others [42,43]. The burst release of DOX from PLGA based polymers during the first few hours, which coincides with and is due to rapid initial bulk erosion of the encapsulating polymer NP (see Fig. 6) can be concerning in the context of inciting cytotoxic effects, and can also diminish prospects for sustained release of the drug from the NP over extended periods. Indeed, the DOX burst phase of our 2% w/w DOX-NP formulations resulted in release of ~20% of encapsulated DOX, though the generated DOX concentration itself was within our desired dose range, and the duration of the burst release was short. However, with NPs containing higher DOX loadings, the burst release of DOX is not a concern. In our release curves in Fig. 5, we also see that DOX release from the 5 and 10% w/w DOX-NPs is lower than that observed for 2% w/w DOX-loaded NPs. This could be attributed to more dense packing of the DOX within the polymer matrix at the higher loadings resulting in impeded infiltration of water, and subsequent out-diffusion of solubilized DOX [7,44] For this reason, unlike DOX release from the 2% w/w DOX-NPs, release from the 5% and 10% w/w DOX-NPs appears to be at steady state beyond the burst phase. In addition, with the latter formulations, less than 10% of the loaded DOX was cumulatively released at the 50 day time point, suggesting prospects to significantly extend DOX release beyond this period. Based on their ability to release DOX at near steady state within our desired dose range, we selected the 10% w/w DOX-NPs to pursue further for our culture experiments to gauge their effects on matrix production by EaRASMCs. An NP dose of 0.2 mg/mL (equivalent to a dose of 2.5 μg/mL DOX) which maintained complete viability of EaRASMC cultures at the stated cell densities was adopted for these culture studies.
As did exogenous DOX, our DOX NPs also significantly inhibited JNK 2 and MMP-2 (Fig. 8), although no decreases in pJNK were noted and TIMP-1 increases were not significant. While as expected based on our prior published findings [7], the blank NPs also significantly inhibited MMP-2 protein synthesis and enzyme activity, their significant inhibition of JNK 2 is noteworthy, and is likely due to JNK suppression by quaternary ammonium groups (presented by the DMAB) a finding first reported by Mendis et al. [45]. Another observation was that the outcomes with the DOX NPs were deemed not statistically different from outcomes with the blank NPs. This could be attributed to our generated steady state DOX concentrations being at the lower end (2.5 μg/mL DOX dose) of our useful DOX dose range (1–10 μg/mL). However, TGF-β1 expression by the EaRASMCs was impressively increased in the presence of DOX NPs but not blank NPs, and to levels significantly higher than even in healthy cell controls, suggesting substantial augmentation of elastic matrix neoassembly in these cultures. Indeed elastic matrix production was significantly higher in these cultures and blank NP-treated cultures than in treatment- and healthy cell controls as indicated by biochemical analysis (Fig. 10b) and IF and TEM imaging (Figs. 11, 12). However, our results also indicate little or no effect of the blank NPs and separately, the DOX, on LOX protein synthesis, enzyme activity and desmosine crosslinking, which is contrary to expectations. While the lack of augmentation by blank NPs may be due to the effect of PEG chains in masking or steric hindering of functional groups presented by the DMAB on the NP surface, the mild effect of DOX could again be attributed to the low steady state doses generated with the 10% w/w DOX NP formulations. The results suggest a need to increase steady state DOX dosing from our NPs within our useful dose range, which can be accomplished by use of a co-polymer based on a lower molecular weight PLGA. Future studies must also investigate if use of PEG of lower molecular weight might mitigate the hypothesized steric hindrance or masking of DMAB on the NP surface. We believe these measures would serve to augment the pro-matrix regenerative effects attributed to our polymer nanocarriers and separately, the released DOX.
Conclusion
In this work, we have shown that the dual, pro-elastogenic and anti-MMP effects of DOX are at least in part mediated by its inhibition of JNK 2, which triggers increases in TGF-β1 to result in downstream attenuation of elastolytic MMP-2 and increases in elastic matrix deposition and lysyl oxidase-mediated crosslinking in aneurysmal SMC cultures (Fig.13). We have identified a useful DOX dose range wherein these effects are more pronounced. Our results suggest that JNK inhibition is a useful metric to assess pro-elastic matrix regenerative effects of DOX. We have also confirmed that we can achieve sustained and near steady-state DOX release within our useful dose range, from DMAB-functionalized PEG-PLGA NPs, and elicit pro-matrix regenerative effects mostly consistent with the effects of exogenous DOX. While our results provide evidence supporting the combinatorial regenerative benefits provided by DOX and cationic-functionalized NPs, the NP formulations must be further optimized (PEG and PLGA molecular weights) to mitigate possible masking of DMAB moieties on the NP surface and also to enhance steady state release levels of DOX within our identified dose range.
Fig. 13.
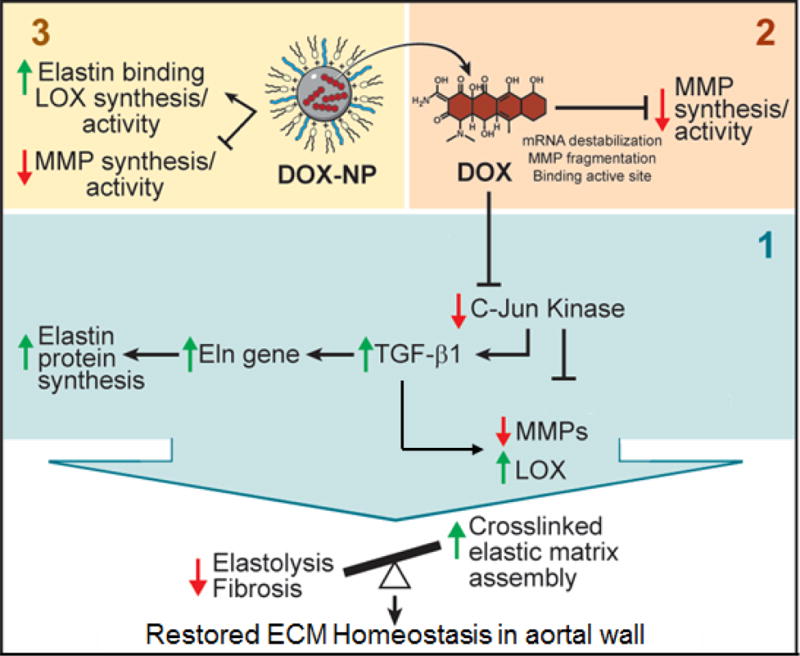
Schematic detailing the mechanistic pathways exhibited by long-term, systemic release of DOX from biodegradable polymeric nanoparticles in regenerating the elastic matrix. The upregulation of TGF β-1 upon DOX inhibition of the JNK pathway enables a pro-regenerative metric for modulating the extracellular matrix.
Acknowledgments
The authors acknowledge funding support for this work from the National Science Foundation (1508642), American Heart Association (16IRG27250113), and the National Institutes of Health (HL132856), awarded to A.R. The authors would also like to acknowledge Ms. Mei Yin at the Biomedical Imaging Core at the Lerner Research Institute of the Cleveland Clinic for her assistance with the TEM imaging performed in this study.
Footnotes
Conflict of Interest
The authors declare that they have no conflicts of interest.
References
- 1.Aziz F, Kuivaniemi H. Role of Matrix Metalloproteinase Inhibitors in Preventing Abdominal Aortic Aneurysm. Ann Vasc Surg. 2007;21:392–401. doi: 10.1016/j.avsg.2006.11.001. [DOI] [PMC free article] [PubMed] [Google Scholar]
- 2.Lu H, Rateri DL, Bruemmer D, Cassis LA, Daugherty A. Novel Mechanisms of Abdominal Aortic Aneurysms. Curr Atheroscler Rep. 2012;14:402–12. doi: 10.1007/s11883-012-0271-y. [DOI] [PMC free article] [PubMed] [Google Scholar]
- 3.Hobeika MJ, Thompson RW, Muhs BE, Brooks PC, Gagne PJ. Matrix metalloproteinases in peripheral vascular disease. J Vasc Surg. 2007;45:849–57. doi: 10.1016/j.jvs.2006.09.066. [DOI] [PubMed] [Google Scholar]
- 4.Aggarwal S, Qamar A, Sharma V, Sharma A. Abdominal aortic aneurysm: A comprehensive review. Exp Clin Cardiol. 2011;16:11. [PMC free article] [PubMed] [Google Scholar]
- 5.Solomon CG, Kent KC. Abdominal Aortic Aneurysms. N Engl J Med. 2014;371:2101–8. doi: 10.1056/NEJMcp1401430. [DOI] [PubMed] [Google Scholar]
- 6.Gacchina CE, Deb P, Barth JL, Ramamurthi A. Elastogenic Inductability of Smooth Muscle Cells from a Rat Model of Late Stage Abdominal Aortic Aneurysms. Tissue Eng Part A. 2011;17:1699–711. doi: 10.1089/ten.tea.2010.0526. [DOI] [PMC free article] [PubMed] [Google Scholar]
- 7.Sivaraman B, Ramamurthi A. Multifunctional nanoparticles for doxycycline delivery towards localized elastic matrix stabilization and regenerative repair. Acta Biomater. 2013;9:6511–25. doi: 10.1016/j.actbio.2013.01.023. [DOI] [PMC free article] [PubMed] [Google Scholar]
- 8.Johnson DJ, Robson P, Hew Y, Keeley FW. Decreased Elastin Synthesis in Normal Development and in Long-term Aortic Organ and Cell Cultures Is Related to Rapid and Selective Destabilization of mRNA for Elastin. Circ Res. 1995;77:1107–13. doi: 10.1161/01.res.77.6.1107. [DOI] [PubMed] [Google Scholar]
- 9.Prall AK, Longo GM, Mayhan WG, Waltke EA, Fleckten B, Thompson RW, et al. Doxycycline in patients with abdominal aortic aneurysms and in mice: Comparison of serum levels and effect on aneurysm growth in mice. J Vasc Surg. 2002;35:923–9. doi: 10.1067/mva.2002.123757. [DOI] [PubMed] [Google Scholar]
- 10.Yoshimura K, Aoki H, Ikeda Y, Furutani A, Hamano K, Matsuzaki M. Regression of Abdominal Aortic Aneurysm by Inhibition of c-Jun N-Terminal Kinase in Mice. Ann N Y Acad Sci. 2006;1085:74–81. doi: 10.1196/annals.1383.031. [DOI] [PubMed] [Google Scholar]
- 11.Wu S, Kasisomayajula K, Peng J, Bancalari E. Inhibition of JNK enhances TGF-β1-activated Smad2 signaling in mouse embryonic lung. Pediatr Res. 2009;65:381–386. doi: 10.1203/PDR.0b013e3181991c67. [DOI] [PubMed] [Google Scholar]
- 12.Kothapalli CR, Ramamurthi A. Lysyl oxidase enhances elastin synthesis and matrix formation by vascular smooth muscle cells. J Tissue Eng Regen Med. 2009;3:655–61. doi: 10.1002/term.214. [DOI] [PMC free article] [PubMed] [Google Scholar]
- 13.Ventura J-J, Kennedy NJ, Flavell RA, Davis RJ. JNK Regulates Autocrine Expression of TGF-β1. Mol Cell. 2004;15:269–78. doi: 10.1016/j.molcel.2004.06.007. [DOI] [PubMed] [Google Scholar]
- 14.Jennewine B, Fox J, Ramamurthi A. Cathepsin K-targeted sub-micron particles for regenerative repair of vascular elastic matrix. Acta Biomater. 2017;52:60–73. doi: 10.1016/j.actbio.2017.01.032. [DOI] [PMC free article] [PubMed] [Google Scholar]
- 15.Labarca C, Paigen K. A simple, rapid, and sensitive DNA assay procedure. Anal Biochem. 1980;102:344–352. doi: 10.1016/0003-2697(80)90165-7. [DOI] [PubMed] [Google Scholar]
- 16.Igoucheva O, Alexeev V, Halabi CM, Adams SM, Stoilov I, Sasaki T, et al. Fibulin-4 E57K Knock-in Mice Recapitulate Cutaneous, Vascular and Skeletal Defects of Recessive Cutis Laxa 1B with both Elastic Fiber and Collagen Fibril Abnormalities. J Biol Chem. 2015;290:21443–59. doi: 10.1074/jbc.M115.640425. [DOI] [PMC free article] [PubMed] [Google Scholar]
- 17.Starcher B. A Ninhydrin-Based Assay to Quantitate the Total Protein Content of Tissue Samples. Anal Biochem. 2001;292:125–9. doi: 10.1006/abio.2001.5050. [DOI] [PubMed] [Google Scholar]
- 18.McMahon MP, Faris B, Wolfe BL, Brown KE, Pratt CA, Toselli P, et al. Aging effects on the elastin composition in the extracellular matrix of cultured rat aortic smooth muscle cells. Vitro Cell Dev Biol -Plant. 1985;21:674–680. doi: 10.1007/BF02620921. [DOI] [PubMed] [Google Scholar]
- 19.Sho E, Chu J, Sho M, Fernandes B, Judd D, Ganesan P, et al. Continuous periaortic infusion improves doxycycline efficacy in experimental aortic aneurysms. J Vasc Surg. 2004;39:1312–21. doi: 10.1016/j.jvs.2004.01.036. [DOI] [PubMed] [Google Scholar]
- 20.Curci JA, Mao D, Bohner DG, Allen BT, Rubin BG, Reilly JM, et al. Preoperative treatment with doxycycline reduces aortic wall expression and activation of matrix metalloproteinases in patients with abdominal aortic aneurysms. J Vasc Surg. 2000;31:325–342. doi: 10.1016/s0741-5214(00)90163-0. [DOI] [PubMed] [Google Scholar]
- 21.Ding R, McGuinness CL, Burnand KG, Sullivan E, Smith A. Matrix metalloproteinases in the aneurysm wall of patients treated with low-dose doxycycline. Vascular. 2005;13:290–297. doi: 10.1258/rsmvasc.13.5.290. [DOI] [PubMed] [Google Scholar]
- 22.Bendeck MP, Conte M, Zhang M, Nili N, Strauss BH, Farwell SM. Doxycycline modulates smooth muscle cell growth, migration, and matrix remodeling after arterial injury. Am J Pathol. 2002;160:1089–1095. doi: 10.1016/S0002-9440(10)64929-2. [DOI] [PMC free article] [PubMed] [Google Scholar]
- 23.Yoshimura K, Aoki H, Ikeda Y, Fujii K, Akiyama N, Furutani A, et al. Regression of abdominal aortic aneurysm by inhibition of c-Jun N-terminal kinase. Nat Med. 2005;11:1330–8. doi: 10.1038/nm1335. [DOI] [PubMed] [Google Scholar]
- 24.Dodd BR, Spence RA. Doxycycline inhibition of abdominal aortic aneurysm growth: a systematic review of the literature. Curr Vasc Pharmacol. 2011;9:471–8. doi: 10.2174/157016111796197288. [DOI] [PubMed] [Google Scholar]
- 25.Daugherty A, Cassis LA. Mouse Models of Abdominal Aortic Aneurysms. Arterioscler. Thromb Vasc Biol. 2004;24:429–34. doi: 10.1161/01.ATV.0000118013.72016.ea. [DOI] [PubMed] [Google Scholar]
- 26.AAssar OS, Fujiwara NH, Marx WF, Matsumoto AH, Kallmes DF. Aneurysm growth, elastinolysis, and attempted doxycycline inhibition of elastase-induced aneurysms in rabbits. J Vasc Interv Radiol JVIR. 2003;14:1427–32. doi: 10.1097/01.rvi.0000096772.74047.13. [DOI] [PubMed] [Google Scholar]
- 27.Halpern VJ, Nackman GB, Gandhi RH, Irizarry E, Scholes JV, Ramey WG, et al. The elastase infusion model of experimental aortic aneurysms: synchrony of induction of endogenous proteinases with matrix destruction and inflammatory cell response. J Vasc Surg. 1994;20:51–60. doi: 10.1016/0741-5214(94)90175-9. [DOI] [PubMed] [Google Scholar]
- 28.Newman KM, Jean-Claude J, Li H, Ramey WG, Tilson MD. Cytokines that activate proteolysis are increased in abdominal aortic aneurysms. Circulation. 1994;90:II224–227. [PubMed] [Google Scholar]
- 29.Franco C, Ho B, Mulholland D, Hou G, Islam M, Donaldson K, et al. Doxycycline Alters Vascular Smooth Muscle Cell Adhesion, Migration, and Reorganization of Fibrillar Collagen Matrices. Am J Pathol. 2006;168:1697–709. doi: 10.2353/ajpath.2006.050613. [DOI] [PMC free article] [PubMed] [Google Scholar]
- 30.Ahler E, Sullivan WJ, Cass A, Braas D, York AG, Bensinger SJ, et al. Doxycycline Alters Metabolism and Proliferation of Human Cell Lines. In: Samant R, editor. PLoS ONE. Vol. 8. 2013. p. e64561. [DOI] [PMC free article] [PubMed] [Google Scholar]
- 31.Leask A, Holmes A, Black CM, Abraham DJ. Connective Tissue Growth Factor Gene Regulation: REQUIREMENTS FOR ITS INDUCTION BY TRANSFORMING GROWTH FACTOR-2 IN FIBROBLASTS. J Biol Chem. 2003;278:13008–15. doi: 10.1074/jbc.M210366200. [DOI] [PubMed] [Google Scholar]
- 32.Losy F, Dai J, Pages C, Ginat M, Muscatelli-Groux B, Guinault A-M, et al. Paracrine secretion of transforming growth factor-β1 in aneurysm healing and stabilization with endovascular smooth muscle cell therapy1 1Competition of interest: none. J Vasc Surg. 2003;37:1301–9. doi: 10.1016/s0741-5214(02)75336-6. [DOI] [PubMed] [Google Scholar]
- 33.Dai J. Overexpression of Transforming Growth Factor-1 Stabilizes Already-Formed Aortic Aneurysms: A First Approach to Induction of Functional Healing by Endovascular Gene Therapy. Circulation. 2005;112:1008–15. doi: 10.1161/CIRCULATIONAHA.104.523357. [DOI] [PubMed] [Google Scholar]
- 34.DiMusto PD, Lu G, Ghosh A, Roelofs KJ, Sadiq O, McEvoy B, et al. Increased JNK in Males Compared with Females in a Rodent Model of Abdominal Aortic Aneurysm. J Surg Res. 2012;176:687–95. doi: 10.1016/j.jss.2011.11.1024. [DOI] [PMC free article] [PubMed] [Google Scholar]
- 35.Kagan HM, Tseng L, Simpson DE. Control of elastin metabolism by elastin ligands. Reciprocal effects on lysyl oxidase activity. J Biol Chem. 1981;256:5417–21. [PubMed] [Google Scholar]
- 36.Kagan HM, Sullivan KA, Olsson TA, Cronlund AL. Purification and properties of four species of lysyl oxidase from bovine aorta. Biochem J. 1979;177:203–214. doi: 10.1042/bj1770203. [DOI] [PMC free article] [PubMed] [Google Scholar]
- 37.Tezvergil-Mutluay A, Agee KA, Uchiyama T, Imazato S, Mutluay MM, Cadenaro M, et al. The Inhibitory Effects of Quaternary Ammonium Methacrylates on Soluble and Matrix-bound MMPs. J Dent Res. 2011;90:535–40. doi: 10.1177/0022034510389472. [DOI] [PMC free article] [PubMed] [Google Scholar]
- 38.Sah H, Desu, Sah, Wood, Thoma Concepts and practices used to develop functional PLGA-based nanoparticulate systems. Int J Nanomedicine. 2013:747. doi: 10.2147/IJN.S40579. [DOI] [PMC free article] [PubMed] [Google Scholar]
- 39.Vonarbourg A, Passirani C, Saulnier P, Benoit J-P. Parameters influencing the stealthiness of colloidal drug delivery systems. Biomaterials. 2006;27:4356–73. doi: 10.1016/j.biomaterials.2006.03.039. [DOI] [PubMed] [Google Scholar]
- 40.Labhasetwar V, Song C, Humphrey W, Shebuski R, Levy RJ. Arterial uptake of biodegradable nanoparticles: effect of surface modifications. J Pharm Sci. 1998;87:1229–1234. doi: 10.1021/js980021f. [DOI] [PubMed] [Google Scholar]
- 41.Sperelakis N. Cell Physiology Source Book: Essentials of Membrane Biophysics. 4th. Academic Press; 2011. [Google Scholar]
- 42.Thote AJ, Chappell JT, Gupta RB, Kumar R. Reduction in the initial-burst release by surface crosslinking of PLGA microparticles containing hydrophilic or hydrophobic drugs. Drug Dev Ind Pharm. 2005;31:43–57. doi: 10.1081/ddc-43985. [DOI] [PubMed] [Google Scholar]
- 43.Yeo Y, Park K. Control of encapsulation efficiency and initial burst in polymeric microparticle systems. Arch Pharm Res. 2004;27:1–12. doi: 10.1007/BF02980037. [DOI] [PubMed] [Google Scholar]
- 44.Tamada JA, Langer R. Erosion kinetics of hydrolytically degradable polymers. Proc Natl Acad Sci. 1993;90:552–556. doi: 10.1073/pnas.90.2.552. [DOI] [PMC free article] [PubMed] [Google Scholar]
- 45.Mendis E, Kim M-M, Rajapakse N, Kim S-K. The inhibitory mechanism of a novel cationic glucosamine derivative against MMP-2 and MMP-9 expressions. Bioorg Med Chem Lett. 2009;19:2755–9. doi: 10.1016/j.bmcl.2009.03.126. [DOI] [PubMed] [Google Scholar]