Abstract
Lysine-specific demethylase 1 (LSD1) is a chromatin-remodeling enzyme that plays an important role in cancer. Over-expression of LSD1 decreases methylation at histone 3 lysine 4, and aberrantly silences tumor suppressor genes. Inhibitors of LSD1 have been designed as chemical probes and potential antitumor agents. We recently reported the cyclic peptide 9, which potently and reversibly inhibits LSD1 (IC50 2.1 µM; Ki 385 nM). Systematic alanine mutagenesis of 9 revealed residues that are critical for LSD1 inhibition, and these mutated peptides were evaluated as LSD1 inhibitors. Alanine substitution at positions 2, 3, 4, 6 and 11–17 preserved inhibition, while substitution of alanine at positions 8 and 9 resulted in complete loss of activity. Cyclic mutant peptides 11 and 16 produced the greatest LSD1 inhibition, and 11, 16, 27 and 28 increased global H3K4me2 in K562 cells. In addition, 16, 27 and 28 promoted significant increases in H3K4me2 levels at the promoter sites of the genes IGFBP2 and FEZ1. Data from these LSD1 inhibitors will aid in the design of peptidomimetics with improved stability and pharmacokinetics.
Keywords: Alanine scanning, Chromatin remodeling, lysine-specific demethylase 1, Cyclic peptide, Epigenetic modulator, Histone demethylation
Graphical Abstract
1. Introduction
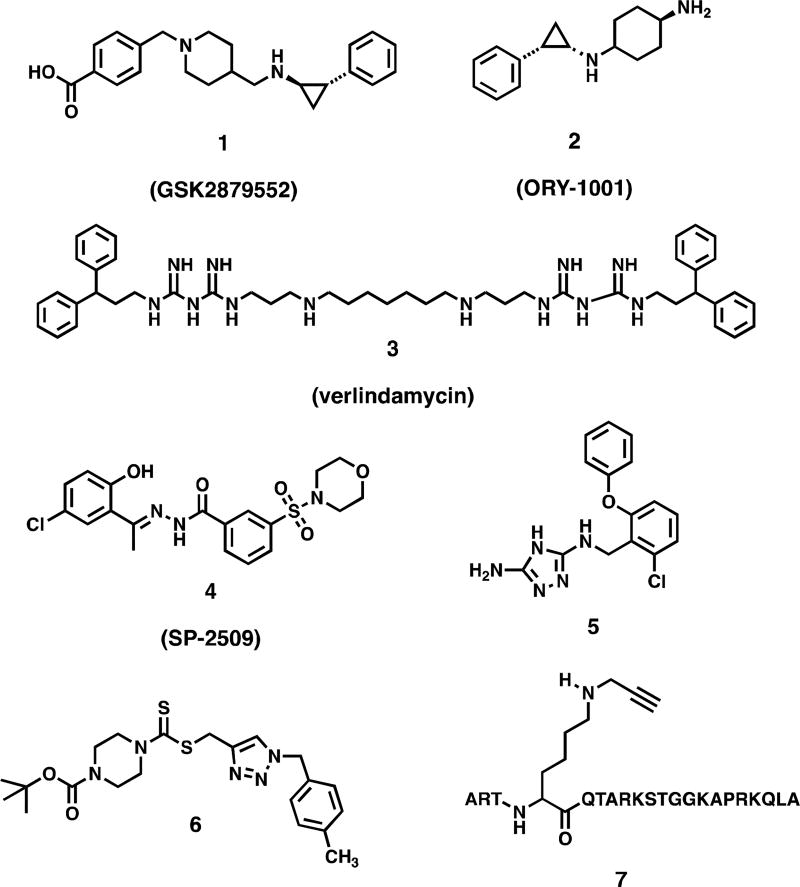
Lysine and arginine residues on nucleosomal histone protein tails undergo reversible mono-, di- and trimethylation that serves to regulate gene expression. Unlike histone acetylation, which activates gene transcription, histone methylation can either activate or silence gene expression, depending on the specific chromatin mark involved. The primary function of the flavin-dependent amine oxidase lysine-specific demethylase 1, (LSD1, also known KDM1A) is to remove methyl groups from the activating chromatin marks monomethyl histone 3 lysine 4 (H3K4me2) and dimethyl histone 3 lysine 4 (H3K4me2). LSD1 is also known to demethylate histone 3 lysine 9 (H3K9) when co-localized with the androgen receptor in prostate tumors,[3] and demethylates non-histone protein substrates such as p53 and deoxynucleic acid methyltransferase 1 (Dnmt1).[5] Over-expression of LSD1 has been observed in a variety of tumor cell lines, and promotes the aberrant silencing of tumor suppressor genes. Thus LSD1 is regarded as an attractive target for therapeutic intervention. Effective LSD1 inhibitors have been described (Figure 1), including tranylcypromine-based irreversible inhibitors such as GSK2879552 (1)[6] and ORY-1001 (2),[7–9] oligoamines such as verlindamycin 3[10–13] and related isosteric ureas and thioureas,[13, 14] reversible benzohydrazide inhibitors such as SP-2509 (4),[9] reversible 1,2,4-triazoles such as 5,[15] dithiocarbamate-urea hybrid LSD1 inactivators related to 6[16] and peptide based LSD1 inhibitors such as 7.[17–20] Compounds 1, 2 and 4 are currently the subjects of human clinical trials.
Figure 1.
Chemotypes of known reversible and irreversible LSD1 inhibitors.
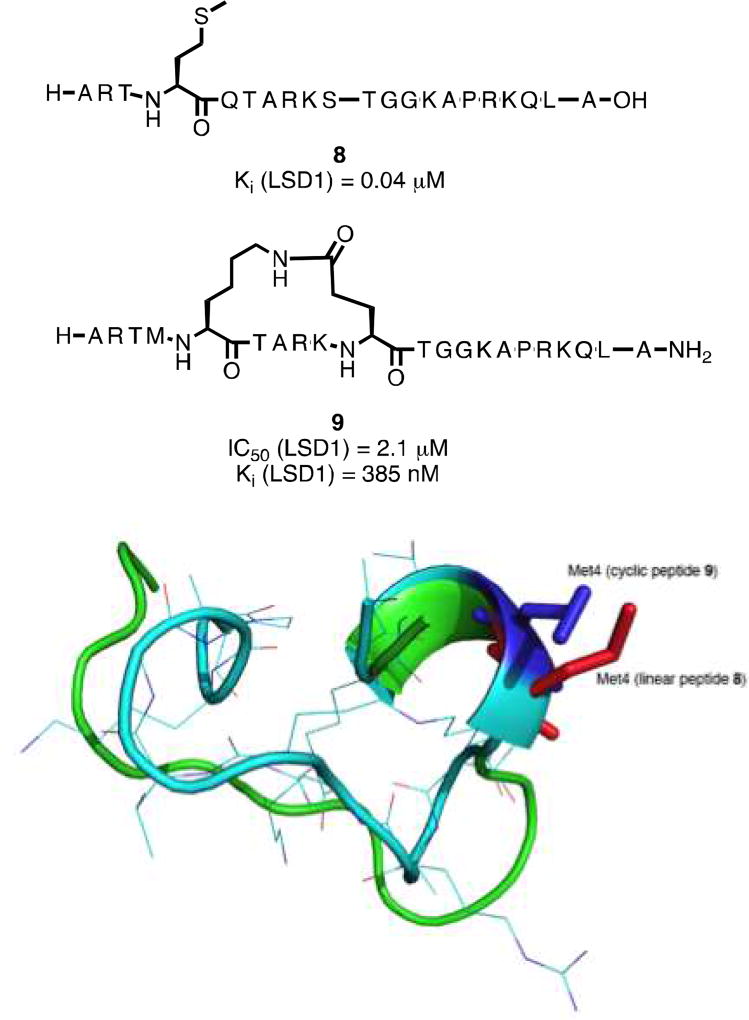
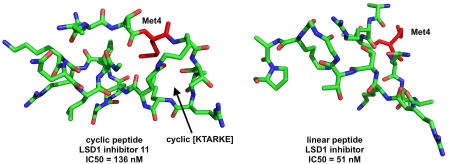
Forneris et al. described a 21-mer peptide analogous to the histone 3 lysine 4 substrate region of LSD1, wherein Lys4 was replaced by a methionine (compound 8, Figure 2).[4] This linear peptide was a potent inhibitor of recombinant LSD1 with a Ki value of 0.04 µM, and inhibited LSD1 bound to CoREST with a Ki value of 0.05 µM.[4] The X-ray conformation of 8 bound to LSD1/CoREST (PDB ID: 2V1D) reveals that the side chains of some amino acid residues in 8 (Arg2 and Gln5; Arg2 and Ser10; Arg2 and Gly12; Arg2 and Lys14; Gln5 and Ser10) are in close proximity to each other in three-dimensional space when it is bound to the catalytic pocket. In order to mimic the bound conformation of 8, we replaced these amino acids with Lys and Glu residues and made a series of cyclic peptides containing a lactam bridge.[1] The most active LSD1 inhibitor in this series, compound 9 (Figure 2A), exhibited an IC50 value of 2.1 µM and a Ki of 385 nM against purified recombinant LSD1/CoREST. The global least energy conformation of 9 obtained using the MacroModel Monte Carlo Multiple Minimum (MCMM) search algorithm[21, 22] features a right-handed alpha helical section and a beta sheet section, and assumes very similar backbone and local side chain conformations to 8 (Figure 2B). This similarity in the least energy conformations of 8 and 9 could explain their similar ability to inhibit recombinant LSD1.
Figure 2.
Panel A. Structures of the linear peptide LSD1 inhibitor 8 and the cyclic peptide LSD1 inhibitor 9. Panel B. Overlay of the least-energy conformations of 8 and 9.
Alanine scanning mutagenesis is a powerful tool used to identify key amino acid residues in a peptide that are important for the biological activity. We thus completed systematic alanine mutagenesis involving residues 2–4, 6, 8–9, 11–14 and 16 of the cyclic peptide LSD1 inhibitor 9 to identify those residues in the ligand important for LSD1 inhibition.
2. Materials and Methods
2.1. Synthesis
All reagents and dry solvents were purchased from Aldrich Chemical Co. (Milwaukee, WI), Sigma Chemical Co. (St. Louis, MO), VWR (Radnor, PA) or Fisher Scientific (Chicago, IL) and were used without further purification except as noted below. Dry methanol, ethyl acetate, tetrahydrofuran, dimethyl formamide and hexane were prepared using a Glass Contour Solvent Purification System (Pure Process Technology, LLC, Nashua, NH). Routine chromatographic purification on reversed phase silica gel and preparative scale chromatographic procedures were carried out using a Teledyne Isco CombiFlash Rf200 chromatography system (Teledyne-Isco, Lincoln, NE) fitted with silica gel 60 cartridges (230–440 mesh). Thin layer chromatography was conducted on Merck precoated silica gel 60 F-254.
Alanine substituted cyclic peptides were synthesized using a standard Fmoc/tert-butyl protection strategy[1] on rink amide MBHA polystyrene resin with low substitution (0.36 mmol/g) (for complete details see the Supporting Information section). Except for Lys5 and Glu10, amino acid side chains were protected with acid labile protective groups such as tert-butyl, N-Boc, trityl or 2,2,4,6,7-pentamethyldihydrobenzofuran-5-sulfonyl (Pbf). Amino acids, Lys5 and Glu10 were protected with the orthogonal protective groups alloc and allyl, respectively. Prior to cyclization, the desired linear peptide sequence was obtained by a cycle of peptide coupling and deprotection of the added residue, with synthesis proceeding from the C terminus to the N terminus. After all side chain-protected linear peptides were attached to the resin, the orthogonal protection on Lys5 and Glu10 were removed using an allyl scavenger (DMBA) and Pd(PPh3)4 under an inert atmosphere. The resulting peptides were then cyclized by forming a lactam bridge using coupling agents (Cl-HOBt and HATU) and a hindered base (DIPEA). Complete cyclization of the peptide was confirmed by comparing the retention time of the cyclized and uncyclized peptide with analytical UPLC. In order to rule out formation of guanidylated side products during cyclization reactions, a small amount of resin-bound elongated Fmoc protected peptide was cleaved from the resin and tested for analytical purity and for the desired molecular weight by LC-MS before and after cyclization. The desired cyclic peptides were then removed from the resin using TFA and an appropriate scavenger. In each case, crude purity was determined to be >95%, and these peptides were evaluated as LSD1 inhibitors without further chromatographic purification. Peptide purity was analyzed by LC-MS and UPLC chromatography, and mass detection was conducted on LC-MS equipped with a quadrupole system, and in some cases by MALDI high-resolution mass spectra (Table S1).
High resolution mass spectrometric data was measured in the positive ion mode using a Bruker AUTOFLEX III MALDI-TOF instrument. UPLC data was obtained on a Waters Acquity H-series ultrahigh-performance liquid chromatography system fitted with a C18 reversed-phase column (Acquity UPLC BEH C18 1.7 M, 2.1 × 50 mm). LC-MS data was obtained in the positive ion mode using Waters LC-MS instrument (Waters 2545 quaternary gradient module, Waters 2767 sample manager, Waters SFO fluidic organizer, Waters 3100 mass detector containing single quadrapole, and Waters PDA detector 2998) on Waters Xterra C18 column (3.0 × 100 mm, 5 µM). Prior to biological testing procedures, all compounds were determined to be >95% pure by UPLC chromatography (gradient: 10 – 90 % acetonitrile in H2O over 8 min at a flow rate of 0.5 mL/min with 1% trifluoroacetic acid as an ion pairing agent), and by LC-MS chromatography (gradient: 10 – 90 % acetonitrile in H2O over 20 min at a flow rate of 1.0 mL/min). Experimental details and analytical data for compound 9 appear in a previous publication.[1] Cyclic peptides 10–28 were synthesized on solid phase using a Rainin/Protein Technologies PS3 automated peptide synthesizer. Nα-Fmoc amino acids were purchased from Advanced Chemtech (Louisville, KY) or AAPPTec (Louisville, KY). Rink amide MBHA resin LL was purchased from the Novabiochem (Gibbstown, NJ), and reagent grade piperidine was purchased from the Sigma Aldrich. Full details for the synthesis of the title peptides can be found in the Supplemental Information section. Complete characterization data for compounds 10–28 can be found in Table S1.
H-AATM-c[K5TARKE10]TGG-KAPRKQLA-OH (10). UPLC retention time: 0.263 min; HRMS for C93H167N33O26S: Calc. 2195.59, found 2197.075 (M+2H)+.
H-ARAM-c[K5TARKE10]TGG-KAPRKQLA-OH (11). UPLC retention time: 5.16 min; HRMS for C95H172N36O25S: Calc. 2250.67, found 2251.357 (M+1H)+.
H-ARTA-c[K5TARKE10]TGG-KAPRKQLA-OH (12). UPLC retention time: 0.2621 min; HRMS for C94H170N36O26: Calc. 2220.58, found 2222.358 (M+2H)+.
H-ARTM-c[K5AARKE10]TGG-KAPRKQLA-OH (13). UPLC retention time: 0.261 min; HRMS for C95H172N36O25S: Calc. 2250.67, found 2251.111 (M+1)+.
H-ARTM-c[K5TAAKE10]TGG-KAPRKQLA-OH (14). UPLC retention time: 0.261 min; HRMS for C93H167N33O26S: Calc. 2195.59, found 2197.470 (M+2H)+.
H-ARTM-c[K5TARAE10]TGG-KAPRKQLA-OH (15). UPLC retention time: 0.259 min; HRMS for C93H167N35O26S: Calc. 2223.60, found 2225.200 (M+1H)+.
H-ARTM-c[K5TARKE10]AGG-KAPRKQLA-OH (16). UPLC retention time: 0.262 min; HRMS for C95H172N36O25S: Calc. 2250.67, found 2253.137 (M+3H)+.
H-ARTM-c[K5TARKE10]TAG-KAPRKQLA-OH (17). UPLC retention time: 0.260 min; HRMS for C97H176N36O26S: Calc. 2294.73, found 2295.784 (M+1H)+.
H-ARTM-c[K5TARKE10]TGA-KAPRKQLA-OH (18). UPLC retention time: 0.261 min; HRMS for C93H167N35O26S: Calc. 2223.60, found 2225.909 (M+2H)+.
H-ARTM-c[K5TARKE10]TGG-AAPRKQLA-OH (19). UPLC retention time: 0.260 min; HRMS for C94H172N36O26S: Calc. 2254.66, found 2277.132 (M+Na)+.
H-ARTM-c[K5TARKE10]TGG-KAARKQLA-OH (20). UPLC retention time: 0.260 min; HRMS for C97H176N36O26S: Calc. 2294.73, found 2334.400 (M+K)+.
H-ARAM c[K5TARK9E10]TGG-K14APRK-NH2 (21). UPLC retention time: 0.263 min; HRMS for C81H148N32O21S: Calc. 1937.12, found 1938.994 (M+1H)+.
H-ARAM c[K5TARK9E10]TGG-K14A-NH2 (22). UPLC retention time: 0.255 min; HRMS for C64H117N25O18S: Calc. 1556.84, found 1558.192 (M+2H)+.
H-ARAM c[K5TARK9E10]TG-NH2 (23). UPLC retention time: 0.266 min; HRMS for C53H97N21O15S: Calc. 1300.53, found 1302.200 (M+2H)+.
H-ARAM c[K5TARK9E10] -NH2 (24). UPLC retention time: 0.264 min; HRMS for C47H87N19O12S: Calc. 1142.38, found 1142.992 (M+1H)+.
H-ARTM-c[K5TARKE10]TGG-KAPRKQLAK(N-CH3-(CH2)16CO)-NH2 (25). UPLC retention time: 0.253 min; MS for C120H221N37O30S: Calc. 2692.66, found 893.1 (M+3H)+3.
H-ARAM-c[K5TARKE10]TGG-KAPRKQLAK(N-CH3-(CH2)16CO)-NH2 (26). UPLC retention time: 0.252 min; MS for C119H219N37O29S: Calc. 2662.65, found 845.6 (M+3H)+3.
H-ARTM-c[K5TARKE10]TGG-KAPRKQLAK(N-CH3-(CH2)6CO)-NH2 (27). UPLC retention time: 0.269 min; MS for C112H205N37O30S: Calc. 2580.54, found 855.5 (M+3H)+3.
H-ARAM-c[K5TARKE10]TGG-KAPRKQLAK(N-CH3-(CH2)6CO)-NH2 (28). UPLC retention time: 0.273 min; MS for C111H203N37O29S: Calc. 2550.53, found 845.6 (M+3H)+3.
2.2. Cell Culture and Reagents
Calu-6 cells (human lung adenocarcinoma ATCC-HTB-56), MCF7 (human ER+ breast adenocarcinoma) and K562 (human myelogenous leukemia) cells were purchased from ATCC. Calu-6 and MCF-7 cells were cultured in EMEM growth medium containing 10% (v/v) fetal bovine serum and 5% penicillin and streptomycin. K562 cells were cultured in Iscove's Modified Dulbecco's Medium containing 10% (v/v) fetal bovine serum and 5% penicillin and streptomycin. All cultures were grown at 37°C in a humidified environment containing 5% CO2.
2.3. MTS Cell Viability Assay
For the (3-(4,5-dimethylthiazol-2-yl)-5-(3-carboxy-methoxyphenyl)-2-(4-sulfophenyl)-2H-tetrazolium) (MTS) reduction assay, 2,000 cells per well were seeded in 50 µl of complete medium in a 96-well plate and the cells were allowed to attach at 37°C in 5% CO2 for one day. The medium was aspirated and cells were treated with 100 µl of fresh medium containing appropriate concentrations of each test compound. The cells were incubated for 72 hours at 37°C in 5% CO2, after which 20 µL of the MTS reagent solution (Promega CellTiter 96 Aqueous One Solution Cell Proliferation Assay) was added to the medium. The cells were incubated for another 2 hours at 37°C under 5% CO2 environment. Absorbance was measured at 490 nm on a SpectraMax M5 instrument (Molecular Devices) equipped with SOFTmax PRO 4.0 software to determine the cell viability. Reference wavelength 690 nM was used to subtract the background. Percent cell death was calculated by the following equation: % Cell Death = (Abs Control − Abs sample)/Abs Control ×100%. A dose response curve was constructed for each inhibitor, and Each data point was the average of 3 determinations obtained during a single experiment + S.E.M. IC50 values were calculated using the GraphPad Prism 5 software package (GraphPad, San Diego, California).
2.4. In vitro LSD1 demethylation assay
Inhibition assays were performed using a LSD1 Inhibitor Screening Assay Kit (BPS Biosciences #50106). The substrate and all compounds were incubated in assay buffer from 30 min up to 4 hours at 37°C as described in the commercial protocol. Stock solutions of cyclic and linear peptides were prepared in sterile water; solutions of compound 3 and acylated peptides 25–28 were prepared in DMSO. All the succeeding dilutions for the test inhibitors were made using the LSD1 assay buffer. The enzymatic reaction was initiated by adding methylated peptide substrate to the LSD1 assay mixture The final volume of each reaction well was 50 µl, containing 5 µl of a 200 µM solution of substrate peptide and 20 µl of a 15 ng/µl enzyme solution. All compounds were diluted in 1% DMSO with assay buffer to a final volume of 50 µL. Fluorescence was measured at the recommended wavelengths of λex=530 nm (excitation) and λem=590 nm (emission). The substrate control contained all the above components except methylated peptide substrate and test inhibitor. The blank contained all the above components except test inhibitor. Assay components were incubated at room temperature for 25 min before measuring fluorescence using a SpectraMax M5 plate reader (Molecular Devices). The blank fluorescent reading was subtracted from all fluorescent measurements, and % enzymatic activity remaining was calculated by the following equation: [(Test inhibitor fluorescent reading)/(positive control fluorescence reading) × 100%]. Percent LSD1 inhibition was calculated by the following equation. [% LSD1 inhibition = 100 − % LSD1 enzymatic activity remaining]. Each data point was the average of 3 determinations obtained during a single experiment + S.E.M. IC50 determinations for 11 and 16 were performed at the following concentrations: 10.0, 1.0, 0.1, 0.01 and 0.001 µM. Compounds were pre-incubated for 5 min at room temperature prior to initiation of the reaction by addition of the methylated peptide substrate. IC50 was calculated based nonlinear regression analysis of percent LSD1 inhibition data collected in triplicate using the GraphPad Prism 5 software package (GraphPad, San Diego, California).
2.5. Western Blot Analysis
Western blot analysis was performed according to BioRad technical bulletin 6376. K562 and Calu6 cells were plated 350,000 cells per well of a 6 well plate. Total cell volume per well was 2.0 mL. Cells were incubated at 37° C in a humidified environment containing 5% CO2 for one day. Then, 10 µL of the test inhibitor solutions of 3, 11, 16, 27 or 28 were added. All peptide stock solutions except 27 and 28 were prepared by directly dissolving them in a EMEM buffer media (no FBS or PENSTRP), and their succeeding solutions were made using EMEM buffer media. Stock solutions (200 µM) of 27 and 28 were prepared in DMSO, and their succeeding solutions were made using EMEM buffer media. The final concentration of DMSO in culture media was 0.005%. Control wells were excluded with any test inhibitors. The cells were then incubated for 48 h at 37 °C. All wells were washed with cold PBS twice and lysed with 200 uL of cold Pierce RIPA buffer (Thermo Fisher Scientific) containing 1% of Halt Protease & Phosphatase inhibitor (Thermo Fischer Scientific) for 30 min on ice. Individual cell solutions were centrifuged at 16,000 × g for 20 min in a 4° C pre-cooled centrifuge. The supernatant solutions were collected, measured for protein using standard Pierce BCA Protein Assay kit (Thermo Fischer Scientific) and 20 µg of proteins were incubated with 6× SDS–PAGE loading buffer at 95 °C for 5 min before loading to a 12% Mini-PROTEAN TGX stain free gels (BioRad) for SDS gel electrophoresis. Immunoblot analyses were done with anti-H3K4me2 and anti-GAPDH monoclonal primary antibodies and the HRP conjugated secondary antibody purchased from Abcam. The H3K4me2 and GAPDH bands were detected by a chemiluminescence detection methodology with the use of a LI-COR Odyssey® Fc Imaging System (LI-COR Biosciences). The band size and intensity for each signal were quantified using Image Studio Lite ver5.2 (LI-COR Biosciences) and normalized to its loading control GAPDH. The relative density value of control lysate was set as 1. To observe dose-dependent H3K4 dimethylation, K562 cells were plated at 350,000 cells per well in a 6 well plate. Total cell volume per well was 2 mL. Cells were incubated at 37° C in a humidified environment containing 5% CO2 for one day. Then, 10 µL of varying final concentrations of test inhibitor, 28 (0.1 µM and 1.0 µM) were added to each well. All stock solutions and succeeding solutions of 28 were prepared as mentioned above. The control well was excluded with any test inhibitors. SDS gel electrophoresis and immunoblot analysis were performed using the methodology described above.
2.6. Determination of ligand conformation
Conformational analysis was performed on an AMD quad core computer system equipped with the MacroModel V.9 and Maestro V.9 graphical interface. Extended structures of cyclic peptides were drawn using the Maestro graphical interface. The standard bond lengths and angles, stereochemical configuration of side chains and formal charges of functional groups at a physiological pH of 7.2 were taken into account. The structures were initially energy minimized using the OPLS-AA force field[23] and the Polak-Ribier conjugate gradient (PRCG). The process of energy minimization was repeated until optimization converged to a gradient root mean square deviation (RMSD) of <0.005 kJ/Å mol, or a limit of 50000 iterations was reached. The continuum dielectric water solvent model (GB/SA)[24] with extended cutoff distances (8 Å for van der Waals, 20 Å for electrostatics, and 4 Å for H-bonds) was used to simulate aqueous conditions. The MCMM routine of MacroModel V.9 was used for conformational analysis. A total of 1000 search steps were set up and conformations with energy differences of 21 kJ/mol or less from the global minimum were saved. Standard Maestro and Discovery Studio graphical interfaces were used to measure interatomic distances and dihedral angles, and to generate Ramachandran plots for the target peptides. Ramachandran plots and dihedral angle analysis for substrate peptide (8) were determined using the X-ray crystal structure of 8 bound to LSD1 (PDB ID: 2V1D).
2.7. Monoamine oxidase A and B activity assay
MAO/A/B activity was measured with the luminescent MAO-Glo assay kit (Promega, #V1452) according to the manufacturer’s instructions. In brief, total MAO activity was assayed by incubation of compounds with MAO/A or MAO/B enzyme solution containing MAO substrate according to the supplier’s directions. Reconstituted luciferin detection reagent was added, and the luminescent signal was detected with 0.5 integration time after 20 mins. Each data point was the average of 3 determinations obtained during a single experiment + S.E.M.
2.8. Chromatin Immunoprecipitation- Quantitative Polymerase Chain Reaction (ChIP-qPCR)
NCI-H526 cells, GSK-LSD1, SimpleChIP® Plus Enzymatic Chromatin IP kit (magnetic beads), Taqman DNA copy assay primers and ChIP grade H3K4me2 antibody were purchased from ATCC, Sigma Aldrich, Cell Signaling Technology, ThermoFisher Scientific, and Abcam respectively. The ChIP-qPCR study was conducted according to Cell Signaling technical bulletin #9005. NCI-H526 cells were incubated with the indicated inhibitors and a control (no inhibitor), and proteins and DNA in the cells were cross-linked with formaldehyde (see Supporting Information for more details of the procedure). Cell membranes were lysed and nuclei were isolated. The nuclei were lysed by sonication and the released chromatin was isolated. The chromatin was enzymatically digested and IP was performed using specific antibodies (H3K4me2 antibody and negative control Normal Rabbit IgG) and Protein G magnetic beads (see Supporting Information for more details of the procedure). Chromatin was separated from magnetic beads and was reverse-cross linked between DNA and protein and purified using DNA purification columns. qPCR was performed to quantitate the genomic DNA copy number using TaqMan DNA copy assay primer probes and TaqMan Fast Advanced Master Mix (See Supporting Information for complete details concerning this procedure).
3. Results
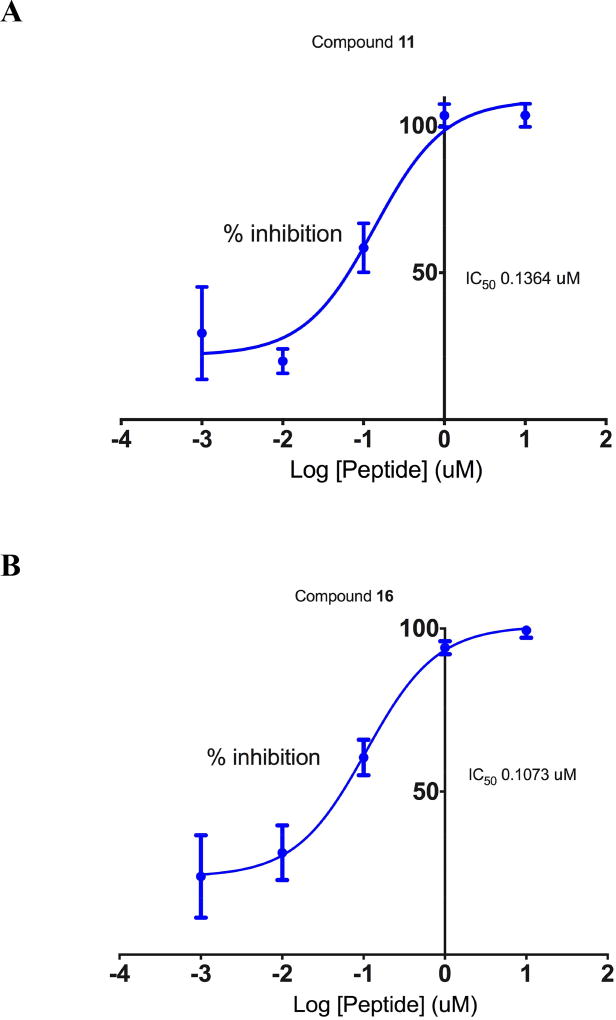
The ability of alanine-substituted peptides 9–20 to inhibit LSD1/CoREST was determined using our previously described assay[1] in the presence of a fixed concentration of the 21-mer dimethylated substrate peptide ART-(N,N-dimethyl-K)-QTARKSTGGKAPRKQLA.[15] Inhibition was initially determined for all compounds at an inhibitor concentration of 500 nM to measure relative activity. The results of these studies are outlined in Table 1 and Figure S1. The previously described cyclic peptide ligand 9 was used as a positive control in all assays involved in evaluation of LSD1 inhibition. Peptides 9–13 and 16–20 produced inhibition between 2.0 and 98.0% at 500 nM in the relative rank order of 18 < 10 < 20 < 19 < 13 < 17 < 12 < 16 < 11. Substitution of Ala at position 8 (compound 14) or position 9 (compound 15) resulted in a complete loss of inhibitory activity, suggesting that Arg8 and Lys9 residues in 9 are critical for binding of the peptide to the LSD1 active site. By contrast, substitution of Ala at position 3 (compound 11) or position 11 (compound 16) caused a significant increase in inhibitory potency. These data indicate that that the hydrogen bonding capabilities of Thr3 and Thr11 are not required for the LSD1 inhibition. For compounds that produced inhibition ≥ 90% at 500 nM (compounds 11 and 16) IC50 values were determined over a concentration range of 1 nM to 10 µM. As shown in Figure 3, IC50 values for compounds 11 and 16 were calculated to be 136 and 107 nM, respectively.
Table 1.
Inhibition of recombinant LSDI/CoREST by alanine mutants of compound 9.
| Cmpd | Sequence | Alanine Position | % inhibition of LSD1 at 500 nM |
|---|---|---|---|
| 8 | H-ARTMK5TARKS10TGGKAPRKQLA-OH | -- | IC50 51 nM[2] Ki 40 nM[4] |
| 9 | H-ARTM-c[K5TARK9E10]TGGK14APRKQLA-NH2 | -- | 2.3 ± 1.3 IC50 2.1 µM; Ki 385 nM[1] |
| 10 | H-A
 TM-c[K5TARKEI0]TGGKAPRKQLA- NH2 TM-c[K5TARKEI0]TGGKAPRKQLA- NH2
|
2 | 25 ± 8 |
| 11 | H-AR
 M-c[K5TARK9E10]TGGK14APRKQLA- NH2 M-c[K5TARK9E10]TGGK14APRKQLA- NH2
|
3 | 98 ± 1 IC50 136 nM |
| 12 | H-ART
 -c[K5TARKE10]TGGKAPRKQLA- NH2 -c[K5TARKE10]TGGKAPRKQLA- NH2
|
4 | 81 ± 2 |
| 13 | H-ARTM-c[K5
 ARKEI0]TGGKAPRKQLA- NH2 ARKEI0]TGGKAPRKQLA- NH2
|
6 | 63 ± 1.8 |
| 14 | H-ARTM-c[K5TA
 KEI0]TGGKAPRKQLA- NH2 KEI0]TGGKAPRKQLA- NH2
|
8 | 0 |
| 15 | H-ARTM-c[K5TAR
 E10]TGGKAPRKQLA- NH2 E10]TGGKAPRKQLA- NH2
|
9 | 0 |
| 16 | H-ARTM-c[K5TARKE10]
 GGKAPRKQLA- NH2 GGKAPRKQLA- NH2
|
11 | 93 ± 3; IC50 107 nM |
| 17 | H-ARTM-c[K5TARKE10]T
 GKAPRKQLA- NH2 GKAPRKQLA- NH2
|
12 | 72 ± 5 |
| 18 | H-ARTM-c[K5TARKE10]TG
 KAPRKQLA- NH2 KAPRKQLA- NH2
|
13 | 9 ± 0.7 |
| 19 | H-ARTM-c[K5TARKE10]TGG
 APRKQLA- NH2 APRKQLA- NH2
|
14 | 52 ± 10 |
| 20 | H-ARTM-c[K5TARKE10]TGGKA
 RKQLA- NH2 RKQLA- NH2
|
16 | 28 ± 12 |
Percent inhibition values reported are the average of 3 determinations obtained during a single experiment + S.E.M. The Ala residues represented in red are those replacing the original residue; positions 1, 7, 15 and 21 are Ala residues already present in the base structure. Positions 5 and 10 were not replaced, since they are involved in the cyclic lactam structure. SEM values and 95% confidence intervals for these IC50 values are reported in Table S3 in the supporting information.
Figure 3.
IC50 determination for compounds 11 (Panel A) and 16 (Panel B). Each data point is the average of 3 determinations obtained during a single experiment + S.E.M. SEM values and 95% confidence intervals for these IC50 values are reported in Table S4 in the supporting information.
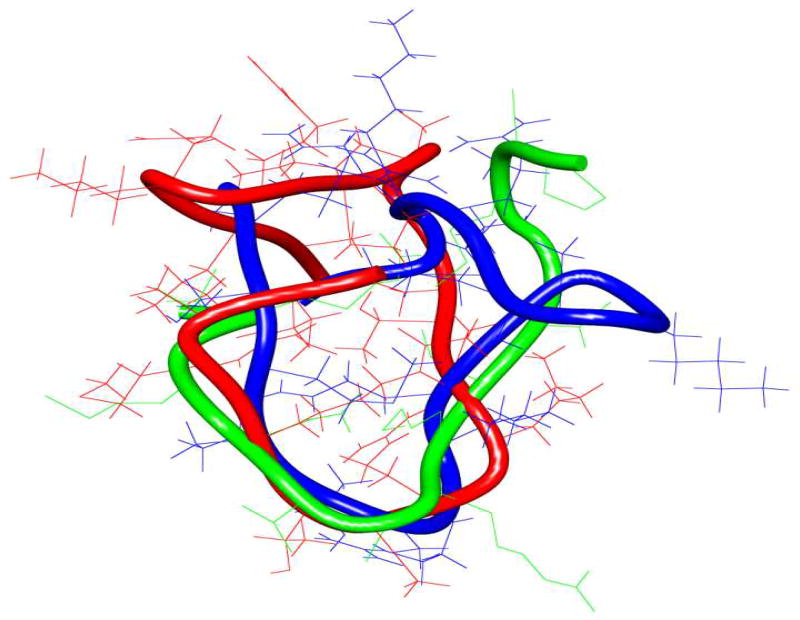
In order to understand the potent LSD1 inhibitory activity of 11 and 16, we determined the global minimum conformations of these ligands using the Monte Carlo search algorithm (MacroModel V.9) and compared them with the X-ray crystallographic conformation of 8 bound to LSD1/CoREST (PDB ID: 2V1D).[4] Structural superimposition of 8, 11, and 16, shown in Figure 4 revealed that the novel ligands 11 and 16 assume backbone and side chain conformations similar to 8 (see also Table S2 and Figure S2–S5 in the Supporting Information section). Because overlap of these 3 backbones was greater between residues 5 and 10 compared to the other residues, it could be suggested that N-terminal or C terminal truncated cyclic peptides may also inhibit LSD1. In addition, inhibitors 11 and 16 feature a right-handed α-helical segment and a β-sheet component that are analogous to those found in 8 (see also the corresponding Ramachandran plots in Figure S2–S5 in the Supporting Information section).
Figure 4.
Superimposition of the least energy conformers of peptides 8, 11, and 16. The backbone structure of 8, 11 and 16 are depicted in green, red and blue, respectively.
In order to rule out off-target effects caused by inhibition of monoamine oxidase (MAO), peptide 11 was compared to the known LSD1 inhibitor tranylcypromine (TCP) for the ability to inhibit recombinant MAO-A and B (Figure S6). TCP exhibited IC50 values of 7.5 and 2.8 µM against MAO-A (Figure S6 Panel A) and MAO-B (Figure S6, Panel B), respectively. By contrast, 11 exhibited IC50 values >100 µM against both MAO-A and B.
Inhibitors 11, 12, 13, 16, 17, 19 and 20, which each produced > 25% LSD1 inhibition in the primary assay, were evaluated for their anticancer effects in the MCF-7 breast cancer line, the Calu-6 lung cancer cell line and the K562 myelogenous leukemia cell line using a standard MTS cell viability assay.[1] The results of these studies are depicted in Figure S7 (Supporting Information section) and listed in Table 2. Inhibition of MCF-7, Calu-6 and K562 cell proliferation was determined at concentrations between 0.005 µM and 5 µM for peptides 11, 12, 13, 16, 17, 19 and 20, and between 0.005 and 5.0 µM for inhibitor 3 (positive control, see Figure 1) over a period of 72 hours. These compounds possessed calculated IC50 values between 154 and 1,238 µM in MCF7 cells, between 93 and 956 µM in Calu-6 cells and between 8.2 and 363.7 µM in K562 cells, compared to IC50 values of 5.1, 6.3 and 4.3 µM for the standard compound 3 in MCF-7, Calu-6 and K562 cells, respectively. Interestingly, compound 13 proved to be the most effective growth inhibitor in all 3 cell lines, and all inhibitors displayed more potent anticancer effects in K562 cells compared to the other two cell lines (Table 2). This observation is in agreement with previous findings that LSD1 inhibitors display superior in vitro antitumor effects in leukemia lines.[25, 26] In the case of 11, 12, 13, 16, 17, 19 and 20, the overall poor IC50 values observed in MTS assay are likely due to poor penetration of the cell membrane by these peptides.
Table 2.
IC50 values for compounds 3, 11, 12, 13, 16, 17, 19 and 20 in cultured MCF-7, Calu-6 and K562 cells following 72-hour treatment.
| Compound | IC50 (MCF7) µM* |
IC50 (Calu-6) µM* |
IC50 (K562) µM* |
|---|---|---|---|
| 3 | 5.1 | 6.3 | 4.3 |
| 9 | 152.6[1] | 157.6[1] | ND |
| 11 | 566 | 586 | 363.7 |
| 12 | 1238 | 956 | 138.8 |
| 13 | 154 | 93 | 8.2 |
| 16 | 168 | 93 | 359 |
| 17 | 1011 | 766 | 42 |
| 19 | 156 | 159 | 198 |
| 20 | 385 | 409 | 35.6 |
IC50 values were derived from dose-response curves wherein each data point is the average of 3 determinations obtained during a single experiment + S.E.M., as shown in Figure S7. SEM values. and 95% confidence intervals for these IC50 values are reported in Tables S5–S7 in the supporting information.
ND = not determined
As outlined above, the overlap of the most active compounds 8, 9,[1] 11 and 16 was greater between residues 5 and 10 compared to the other residues (Figures 2B and 4). In order to determine the minimum number of C terminal residues required for LSD1 inhibition, C terminal residues of the most potent LSD1 inhibitor 11 were systematically truncated. The results of these studies are summarized in Table 3 and Figure S8. Synthesis of the peptide with 3 residues (QLA) deleted at the C-terminus afforded compound 21 (18 residues). As shown in Table 3, 21 retained the full activity of the parent peptide 11. However, the corresponding peptide 22, where 6 residues were removed (PRKQLA), produced a 73.4% inhibition. Further deletions, as in 23 and 24, produced peptides that inhibited LSD1 at 67.3 and 59.8%, respectively. These data suggest that a portion of the random coil “tail” structure in 11 is necessary for optimal binding to the LSD1 active site.
Table 3.
Inhibition of LSD1/CoREST by 11 and truncated cyclicpeptides 21–23.
| Cmpd | Sequence | # of residues |
% inhibition of LSD1 at 500 nM |
|---|---|---|---|
| 11 | H-AR
 M-c[K5TARKE10]TGG-KAPRKQLA-OH M-c[K5TARKE10]TGG-KAPRKQLA-OH |
21 | 99.20 ± 0.8 IC50 136 nM |
| 21 | H-AR
 M c[K5TARK9E10]TGG-K14APRK-NH2 M c[K5TARK9E10]TGG-K14APRK-NH2
|
18 | 98.05 + 0.57 |
| 22 | H-AR
 M c[K5TARK9E10]TGG-K14A-NH2 M c[K5TARK9E10]TGG-K14A-NH2
|
15 | 73.43 ± 3.75 |
| 23 | H-AR
 M c[K5TARK9E10]TG-NH2 M c[K5TARK9E10]TG-NH2
|
12 | 67.31 ± 5.81 |
| 24 | H-AR
 M c[K5TARK9E10] -NH2 M c[K5TARK9E10] -NH2
|
10 | 59.78 ± 5.71 |
Percent inhibition values reported are the average of 3 determinations obtained during a single experiment + S.E.M.. The Ala residues represented in red are those replacing the original residue; positions 1, 7, and 15 are Ala residues already present in 11. SEM values and 95% confidence intervals for these % inhibition values are reported in Table S10 in the supporting information.
Truncated cyclic peptides 21–24 were next evaluated for in vitro antitumor effects in the Calu6 and K562 cell lines. Inhibition of cell proliferation was determined at 50.0 µM, 100.0 µM, and 1.0 µM concentrations using 3 as a positive control. The results of these studies are shown in Table 4. Truncated peptide inhibitors 21–24 displayed no cytotoxicity in Calu6 cells at concentrations up to 1.0 µM. By contrast, peptides 21–23 produced between 9.5 and 18% cell death at 100 µM, and between 53 and 90% cell death at 1.0 µM in K562 cells. Compound 23 proved to be the most effective in both cell lines (Table 4). As before, the overall poor IC50 values observed are likely due to poor penetration of the cell membrane by these peptides.
Table 4.
Percent cell death produced by compounds 3 and 21–24 in cultured in cultured Calu-6 and K562 cells following 72-hour treatment
| Cmpd | Sequence | # of residues |
% cell death Calu 6 |
% cell death K562 |
|---|---|---|---|---|
| 3 | verlindamycin | -- | 83 ± 2.7 (50 µM) | 88 ± 4.4 (50 µM) |
| 21 | H-AR
 M c[K5TARK9E10]-TGG-K14APRK-NH2 M c[K5TARK9E10]-TGG-K14APRK-NH2
|
18 | inactive | 9.5 ± 6.7 (100 µM) 59 ± 8.1 (1.0 µM) |
| 22 | H-AR
 M c[K5TARK9E10]-TGG-K14A-NH2 M c[K5TARK9E10]-TGG-K14A-NH2
|
15 | inactive | 11 ± 3.2 (100 µM) 53 ± 11.3 (1.0 µM) |
| 23 | H-AR
 M c[K5TARK9E10]-TG-NH2 M c[K5TARK9E10]-TG-NH2
|
12 | inactive | 18 ± 3.7 (100 µM) 90 ± 9.4 (1.0 µM) |
| 24 | H-ARAM c[K5TARK9E10] - NH2 | 10 | inactive | ND |
Percent inhibition values reported are the average of 3 determinations obtained during a single experiment + S.E.M.. The Ala residues represented in red are those replacing the original residue. Inactive indicates no growth inhibition at a concentration of 100 µM.
In order to increase the cellular penetration of the cyclic peptide inhibitors above, we synthesized C10 and C18 acylated versions of 9 and 11 in which a C-terminal lysine residue was functionalized with either decanoic acid or octadecanoic acid prior to addition to the peptide chain. The structures of 25–28 are shown in Table 5. Compounds 25 and 27 were based on the parent peptide molecule 9, while 26 and 28 were based on the most active peptide in the series, 11. Compounds 25 and 26 were poorly soluble in the recombinant LSD1 assay mixture, and thus the percent inhibition produced by these compounds at 500 nM could not be determined. Compounds 27 and 28 were more freely soluble, and inhibited LSD1 by 86% and 71%, respectively, at 500 nM. Subsequently, the IC50 values for 25–28 against cultured Calu 6, MCF7 and K562 tumor cells in vitro was determined for each analogue (Figure S9 and Table 6). Compound 25 proved to be the most cytotoxic agent, exhibiting IC50 values of 4.4 and 7.9 µM in the MCF7 and Calu6 cell lines, respectively. These values compare favorably with the reference compound 3, which exhibited IC50 values of 2.5 and 1.6 µM in the MCF7 and Calu6 cell lines, respectively.
Table 5.
Inhibition of LSD1/CoREST by 25–28 at a concentration of 500 nM.
| Cmpd | Sequence | % inhibition of LSD1 at 500 nM |
|---|---|---|
| 25 |
|
N.D. (solubility) |
| 26 |
|
N.D. (solubility) |
| 27 |
|
86 ± 3.1 |
| 28 |
|
71 ± 3.4 |
Each data point is the average of 3 determinations obtained during a single experiment + S.E.M..
N.D. = not determined.
Table 6.
IC50 values for compounds 3 and 25–28 in cultured in cultured MCF-7, Calu-6 and K562 cells following 72-hour treatment.
| Cmpd | IC50 (MCF7) µM* |
IC50 (Calu-6) µM* |
IC50 (K562) µM* |
|---|---|---|---|
| 3 | 2.5 | 1.6 | 4.3 |
| 25 | 4.4 | 7.9 | ND |
| 26 | 4.6 | 10.1 | ND |
| 27 | 36.1 | 92.4 | ND |
| 28 | 28.1 | 40.2 | 95.1 |
IC50 values were derived from dose-response curves shown in Figure S9. SEM values and 95% confidence intervals for these IC50 values are reported in Tables S8 and S9 in the supporting information.
ND = not determined.
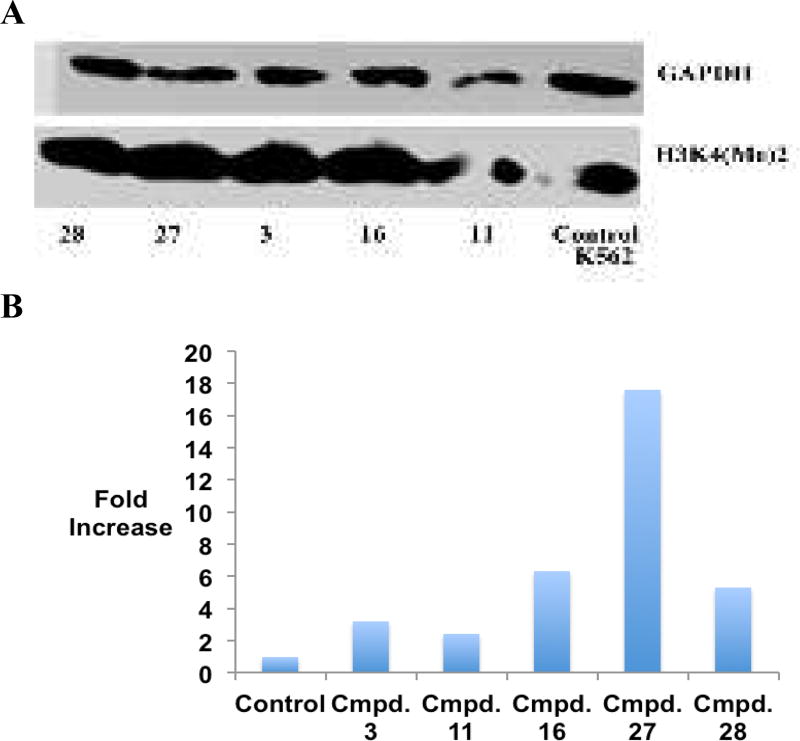
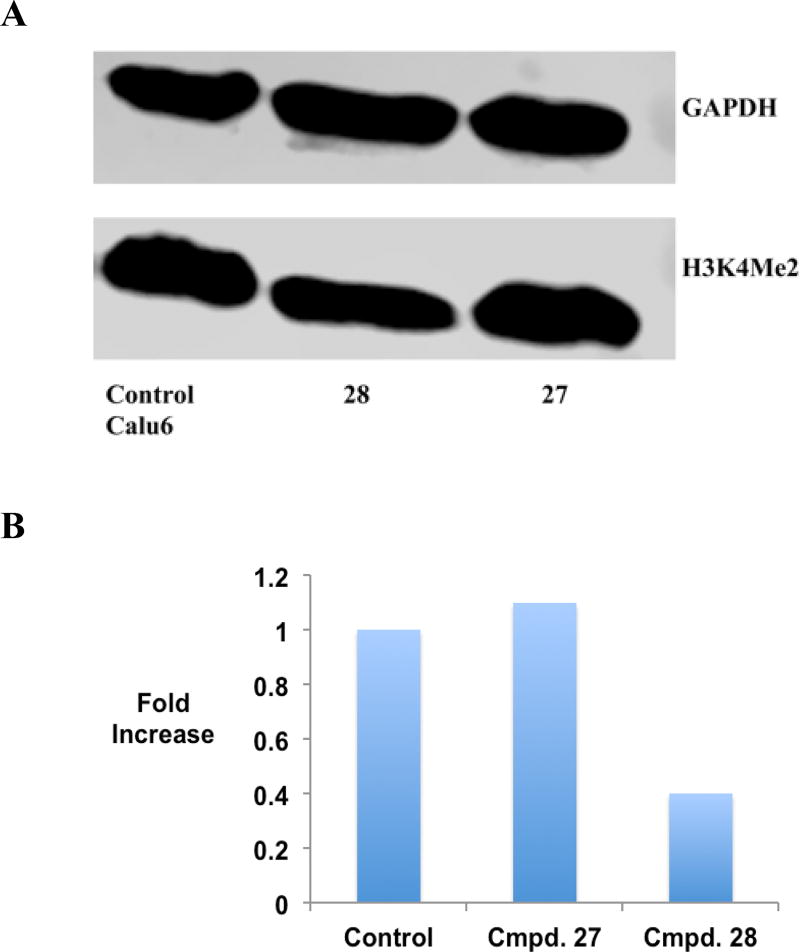
It is well established that excessive demethylation of the activating chromatin marks H3K4me2 and H3K4me1 leads to aberrant silencing of tumor suppressor genes. To determine whether LSD1 inhibition by the cyclic peptides described above is accompanied by an increase in global H3K4me2 content, the effects of 3, 11, 16, 27 and 28 were measured by western blotting in the K562 leukemia and Calu6 lung adenocarcinoma cell lines. The results of these studies are outlined in Figures 5 and 6, and Figure S10. All inhibitors increase H3K4 methylation when compared to the control in the K562 cell line (Figure 5A and B and Figure S10). The acylated cyclic peptide 27 produced the greatest increase in global H3K4me2 (17.6-fold), while the non-acylated cyclic peptide 11 produced the least effect (2.4-fold). By contrast, 27 and 28 did not induce any changes in global H3K4 methylation in Calu6 cells compared to control (Figures 6A and B and Figure S10). These data, and the values in Table 2, indicate that the K562 leukemia cell line is more sensitive to LSD1 inhibition by cyclic peptide inhibitors than the Calu6 lung adenocarcinoma line, possibly due to more dramatic changes in H3K4 methylation that lead to re-expression of tumor suppressor proteins.
Figure 5.
Panel A. H3K4me2 expression levels in K562 leukemia cells following 48-hour exposure to 10 µM concentrations of 3, 11, 16, 27 and 28, as measured by western blot analysis. Panel B. Graphical representation of H3K4me2 expression levels in K562 leukemia cells following 48-hour exposure to 10 µM concentrations of 3, 11, 16, 27 and 28. (See supporting material for raw data extracted from western blots).
Figure 6.
Panel A. H3K4me2 expression levels in Calu6 lung adenocarcinoma cells following a 48-hour exposure to 10 µM 27 or 28, as measured by western blot analysis. Panel B. Graphical representation of H3K4me2 expression levels in Calu6 lung adenocarcinoma cells following 48-hour exposure to 10 µM concentration of 27 or 28. (See supporting material for raw data extracted from western blots).
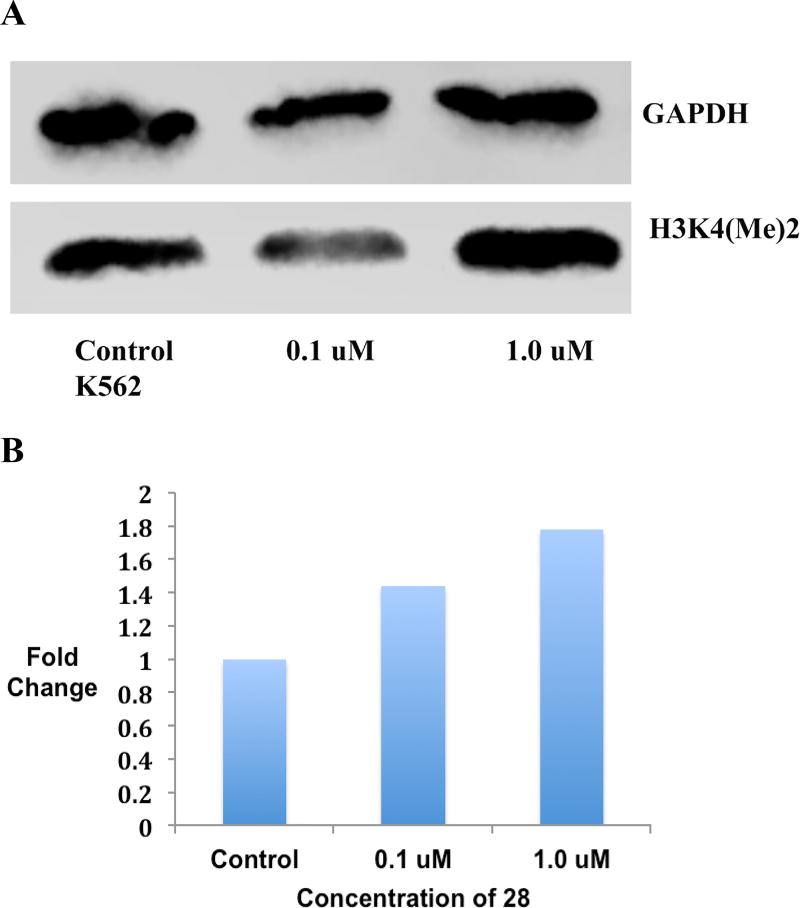
To monitor concentration dependence of LSD1 inhibition produced by cyclic peptides, a western blot experiment was run using two different concentrations of 28 (0.1 µM and 1.0 µM) in the K562 leukemia cell line. The results of this preliminary study revealed a modest dose dependent increase in H3K4 methylation following treatment with 28 (Figures 7A and B, and Figure S11).
Figure 7.
Panel A. Global H3K4me2 expression levels in Calu6 lung adenocarcinoma cells following a 48-hour exposure to 0.1 and 1.0 µM concentrations of 28, as measured by Western blotting. Panel B. Graphical representation of H3K4me2 expression levels in Calu6 lung adenocarcinoma cells following a 48-hour exposure to 0.1 and 1.0 µM concentrations of 28. (See supporting material for raw data extracted from Western blots).
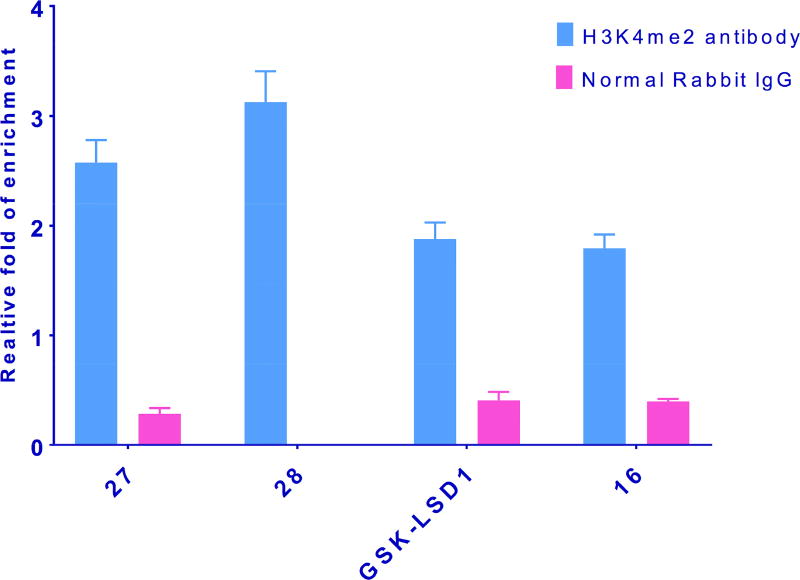
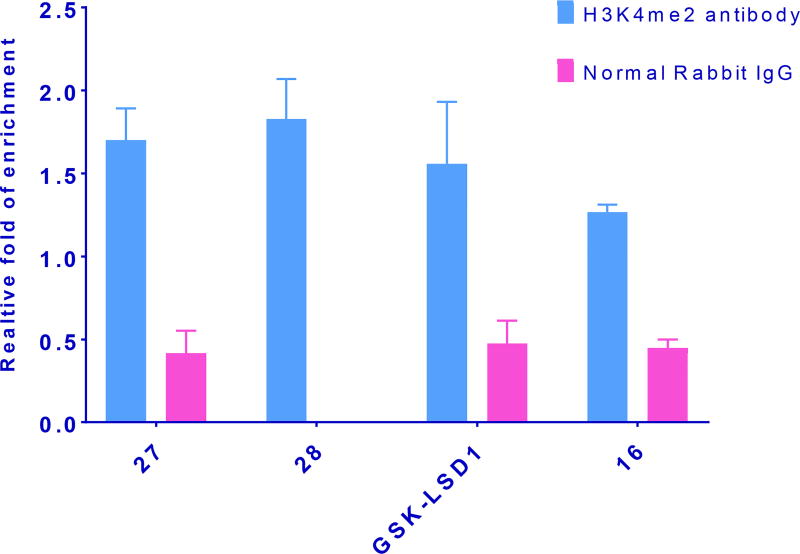
Measurement of global H3K4me2 levels in LSD1 inhibitor-treated cells is useful, but because it is a composite of changes at all promoter sites, the results do not give a clear picture of methylation increases at specific gene promoters. Recent ChIP-qPCR studies have revealed that LSD1 and H3K4me2 are enriched at specific promoter sites, and also at sites distal to the promoters of certain genes, and inhibiting LSD1 enzyme increases H3K4me2 levels at these sites. In particular, LSD1 and the activating chromatin marks H3K4me and H3K4me2 are enriched at sites ±2000 base pairs surrounding the transcription start site of 2 genes, insulin like growth factor binding protein (IGFBP2) and fasciculation and elongation protein zeta (FEZ1), in the NCI-H526 small cell lung carcinoma line.[27] To evaluate whether the cyclic peptides described above enhanced localized H3K4me2 content at these promoter sites, the effects of 16, 27 and 28 were evaluated by ChIP-qPCR, using the known tranylcypromine-based LSD1 inhibitor GSK-LSD1 as positive control. The ChIP immunoprecipitation step was performed using H3K4me2 antibody and a negative control antibody (normal rabbit IgG). The relative degree of expression of H3K4me2 levels compared to control were quantitated using qPCR in combination with the comparative CT- Livak method of analysis (see supporting material for complete ChIP-qPCR procedure). Taqman DNA copy number assay primers were selected because of their high target specificity. At both promoters, compound 28 promoted the greatest increase in H3K4me2 levels, whereas 16 produced the smallest change. Importantly, the cyclic peptide analogues 27 and 28 were more efficient at promoting H3K4 methylation at IGFBP2 and FEZ1 when compared to GSK-LSD1 (see Figures 8 and 9). ChIP-qPCR done using a negative control (normal rabbit IgG antibody) produced overall low fold expression, and represents nonspecific binding during immunoprecipitation.
Figure 8.
Inhibition of LSD1 by 16, 27, 28 and GSK-LSD1 increases H3K4me2 marks at the promoters of the IGFBP2 gene. NCI-H526 cells were treated with 100 µM of the indicated inhibitors for 48 h. The quantitated results represented from SD from means derived from data of three wells of qPCR.
Figure 9.
Inhibition of LSD1 by 16, 27, 28 and GSK-LSD1 increases H3K4me2 marks at the promoters of the FEZ1 gene. NCI-H526 cells were treated with 100 µM of the indicated inhibitors for 48 h. The quantitated results represented from SD from means derived from data of three wells of qPCR.
4. Discussion
In our previous publication, we reported a series of cyclic peptides related to 8, a 21-mer peptide inhibitor of LSD1 that is a mimic of the lysine 4 substrate area of histone 3, an activating chromatin mark.[1] The most active cyclic peptide in the series, 9, retained the inhibitory activity of 8, and was significantly more stable to hydrolysis in plasma. In the present study, we designed a series of 11 alanine mutants of 9 (compounds 10–20) for use as probes to determine critical residues in the substrate. As outlined above, substitution of Ala for Arg8 or for Lys9 produced inactive peptide inhibitors, and substitution of Ala for Arg2, Met4, Thr6, Gly12, Gly13, Lys14 and Pro16 produced significant reductions in inhibitory activity. By contrast, substitution of Ala for Thr9 and Thr11 resulted in a significant increase in potency. These data suggest that the charged side chains at Arg8 and Lys9, both of which lie in the center of the cyclized sequence, contribute greatly to the ability of the peptide to bind to the LSD1 active site. It also indicates that H-bonding with Thr9 and Thr11 does not contribute significantly to binding of the peptide to LSD1. Removal of the charged side chain at Lys14 reduces activity by 50%, probably by disrupting a required ionic interaction. Removal of Pro16 likely changes the orientation of the N-terminal random coil, and thus reduces activity by 72%. Importantly, substitution of Ala for Met4, a residue that is critical to binding of the linear peptide inhibitor 8 to the active site,[4] reduces activity by less than 20%. This observation can be attributed to the fact that Met4 in the cyclic peptide inhibitor 9 is in a different orientation in 8, such that it is not critical for active site affinity.
Removal of 3 residues at the C terminal produced an 18-mer peptide that retained the inhibitory activity of 11. However, removal of 3 additional residues produced an inactive 15-mer peptide. This would indicate that a minimum of 16–18 amino acids are required for optimal binding of a cyclic peptide derived from 11. The effects of truncation at the amino terminus will be determined in a future study.
Although cyclic peptides 9, 11, 12, 13, 16, 17, 19 and 20 act as potent inhibitors of recombinant LSD1/CoREST, their effects on tumor cell growth are negligible, except for 13 in the case of K562 leukemia cells (Table 2). This lack of cellular activity is most likely due to poor penetration of the cell membrane. We thus synthesized acylated versions of the potent cyclic peptide inhibitors 9 and 11 by appending a lipid-bearing Lys residue at the C-terminus. Compounds 25 and 26, which featured an 18-carbon fatty acid substituent on the terminal Lys, were poorly soluble in the LSD1 assay buffer, and as such we were unable to determine a % inhibition at 500 nM. However, compounds 27 and 28, which possessed an 8-carbon fatty acid substituent, retained most of the inhibitory activity of 9 and 11 in the purified recombinant LSD1/CoREST assay. All 4 acylated peptides were sufficiently soluble in the MCF7, Calu-6 and K562 cell culture preparations, and produced significant growth inhibition at 72 hours (Table 6) in both MCF7 and Calu-6 cell lines. The most effective of these compounds, 25 and 26, exhibited IC50 values less than 5 µM in the MCF7 line, and less than 11 µM in the Calu6 cell line. These values are comparable to the IC50 value of the standard compound 3 in both MCF7 (5.1 µM) and Calu-6 (6.3 µM) cell lines.
As described above, the C-terminal truncated analogue 21 possessed no antiproliferative activity in Calu6 lung adenocarcinoma cells, despite acting as a potent inhibitor of the recombinant enzyme. The shorter peptides 22, 23 and 24, which were not inhibitors of recombinant LSD1/CoREST, were also inactive in Calu6, as expected. Interestingly, all 4 C-truncated cyclic peptides 21–24 had antiproliferative activity in the K562 leukemia line, but this modest effect was significant only at high concentration (1.0 µM). By contrast, the acylated LSD1 inhibitors 25 and 26 had activity against MCF7 and Calu6 cells in vitro that was comparable to the known anti-proliferative LSD1 inhibitor 3, as determined in MTS cell viability assays (Table 6).
Overall, K562 leukemia cells were more sensitive to the antiproliferative effects of cyclic peptide LSD1 inhibitors, when compared to Calu6 and a few of them tested in western blot analysis indicate that they more sensitive to increase in global H3K4Me2 levels in K562 cells compared to Calu6 cells. It can be suggested that these LSD1 inhibitors which are high sensitive to K562 cells due to the fact that they enhances high H3K4Me methylation content leading to increase tumor suppressor genes important for potent antitumor effects.
Compound 27 promoted the greatest increase in global H3K4 methylation effect among the inhibitors tested, even though it displays a lower degree of LSD1 inhibition compared to 11 and 16. This indicates that fatty acid modification supports internalization of 27 into cells, helping it reach its target, and producing a greater level of LSD1 inhibition inside the cell, thereby enhancing global H3K4 methylation.
Because LSD1 inhibitors increase H3K4me and H3K4me2 levels at gene promoter sites for IGFBP2 and FEZ1, and thus regulate gene transcription,[27, 28] increases in H3K4me1 and H3K4me2 at these sites correlates with LSD1 inhibition in vitro. This prompted us to employ ChIP to investigate whether our linear and cyclic peptide LSD1 inhibitors displayed similar effects. Several inhibitors (16, 27,28 and GSK-LSD1) were compared to control for the ability to alter methylation levels at the promoter sites of IGFBP2, FEZ1 and ribosomal protein L30 (RPL30) in SCLC cells. RPL30 was measured as an endogenous control in this study. ChIP-qPCR results revealed that 28 displayed the highest H3K4 dimethylation, whereas 16 showed the lowest methylation at both promoter sites. These data suggest that the low methylation levels of linear peptide LSD1 inhibitor, 16 could be due to its poor cell permeability. GSK-LSD1 was found to be somewhat less effective at increasing H3K4me2 levels at both promoter sites when compared to cyclic peptides 27 and 28 at 100 µM concentration (see Figures 8 and 9). Based on these results we postulate that the fatty acid derivatization of peptides 27 and 28 promotes cell permeability, thus allowing them to interact with the target enzyme at a higher concentration.
5. Conclusions
In summary, alanine scanning mutagenesis was used to identify residues in our previously studied cyclic peptide LSD1 inhibitors that are critical for active site binding, and in so doing revealed analogues that are 2.8 to 3.6-fold more potent against recombinant LSD1/CoREST. In silico studies suggest that the cyclic portion of the structures of these inhibitors are largely superimposable. Immunohistochemical experiments reveal that compounds 3, 11, 16, 27 and 28 at 10 µM produce global increases in H3K4me2 levels between 2- and 17-fold in K562 leukemia cells, but that these effects are modest in the less sensitive Calu-6 lung adenocarcinoma tumor cell line. The effect of 28 was shown to be dose-dependent when assayed at 0.1 and 1.0 µM. These results indicate that the acylated cyclic peptide derivatives 27 and 28 have improved pharmacokinetic properties that allow some degree of cell penetration, suggesting that lipidation of these cyclic peptides is a viable delivery strategy in vitro. Finally, ChIP/qPCR studies demonstrate that increases in H3K4 methylation are observed at the promoters for the IGFBP2 and FEZ1 genes, which are regarded as reliable biomarkers for LSD1 inhibition, following treatment with 16, 27 and 28. In the case of 27 and 28, these increases are significantly greater than those observed with the tranylcypromine-based LSD1 inhibitor GSK-LSD1. Future studies will focus on the synthesis of peptidomimetics that exhibit enhanced potency, greater stability and more favorable pharmacokinetic parameters. The synthesis of LSD1 inhibitors of this type is an ongoing concern in our laboratories.
Supplementary Material
Highlights.
Short cyclic peptide inhibits lysine-specific demethylase 1 with an IC50 of 385 nM
Alanine scanning reveals critical binding residues and yields improved inhibitors
Cyclic peptides superimpose on X-ray structure of enzyme-bound inhibitor
Peptides truncated at the C-terminal lose activity at 15 residues or below
Lipidated peptide inhibitors retain activity and exhibit enhanced cell penetration
ChIP immunoprecipitation indicates epigenetic changes at two gene biomarkers
Acknowledgments
These studies were supported by National Institutes of Health grants R01 CA149095 (P.M.W.) and RO1 CA204345 (P.M.W.). The authors wish to thank Dr. Robert A. Casero, Jr. of the Johns Hopkins University Sidney Kimmel Cancer Center for helpful discussions, and for providing substrate for LSD1 assay procedures.
Footnotes
Publisher's Disclaimer: This is a PDF file of an unedited manuscript that has been accepted for publication. As a service to our customers we are providing this early version of the manuscript. The manuscript will undergo copyediting, typesetting, and review of the resulting proof before it is published in its final citable form. Please note that during the production process errors may be discovered which could affect the content, and all legal disclaimers that apply to the journal pertain.
Supplementary material (detailed synthetic and biological assay procedures, compound spectra, Ramachandran plot data, etc.) is available for this manuscript online (EJMC 2018 Supporting Information.docx)
References and notes
- 1.Kumarasinghe IR, Woster PM. Synthesis and Evaluation of Novel Cyclic Peptide Inhibitors of Lysine-Specific Demethylase 1. ACS Med. Chem. Lett. 2014;5:29–33. doi: 10.1021/ml4002997. dx.doi.org/dx.doi.org/10.1021/ml4002997. [DOI] [PMC free article] [PubMed] [Google Scholar]
- 2.Plant M, Dineen T, Cheng A, Long AM, Chen H, Morgenstern KA. Screening for lysine-specific demethylase-1 inhibitors using a label-free high-throughput mass spectrometry assay. Anal. Biochem. 2011;419:217–227. doi: 10.1016/j.ab.2011.07.002. dx.doi.org/10.1016/j.ab.2011.07.002. [DOI] [PubMed] [Google Scholar]
- 3.Wang M, Liu X, Guo J, Weng X, Jiang G, Wang Z, He L. Inhibition of LSD1 by Pargyline inhibited process of EMT and delayed progression of prostate cancer in vivo. Biochem. Biophys. Res. Comm. 2015;467:310–315. doi: 10.1016/j.bbrc.2015.09.164. dx.doi.org/10.1016/j.bbrc.2015.09.164. [DOI] [PubMed] [Google Scholar]
- 4.Forneris F, Binda C, Adamo A, Battaglioli E, Mattevi A. Structural basis of LSD1-CoREST selectivity in histone H3 recognition. J. Biol. Chem. 2007;282:20070–20074. doi: 10.1074/jbc.C700100200. [DOI] [PubMed] [Google Scholar]
- 5.Nicholson TB, Chen T. LSD1 demethylates histone and non-histone proteins. Epigenetics. 2009;4:129–132. doi: 10.4161/epi.4.3.8443. [DOI] [PubMed] [Google Scholar]
- 6.Zheng YC, Yu B, Jiang GZ, Feng XJ, He PX, Chu XY, Zhao W, Liu HM. Irreversible LSD1 inhibitors: Application of tranylcypromine and its derivatives in cancer treatment. Curr. Top. Med. Chem. 2016 doi: 10.2174/1568026616666160216154042. [DOI] [PubMed] [Google Scholar]
- 7.Guibourt N, Ortega-Munoz A, Castro-Palomino Laria J. In: US Patent Application 20120004262: Phenylcyclopropylamine derivatives and their medical use. USPTO, editor. Oryzon Genomics, S.A.: 2012. p. 162. [Google Scholar]
- 8.Ortega-Munoz A, Castro-Palomino Laria J, Fyfe MCT. Lysine-specific demethylase 1 inhibitors and their use. 2011 [Google Scholar]
- 9.Maes T, Carceller E, Salas J, Ortega A, Buesa C. Advances in the development of histone lysine demethylase inhibitors. Curr. Opin. Pharmacol. 2015;23:52–60. doi: 10.1016/j.coph.2015.05.009. dx.doi.org/10.1016/j.coph.2015.05.009. [DOI] [PubMed] [Google Scholar]
- 10.Huang Y, Greene E, Stewart TM, Goodwin AC, Baylin SB, Woster PM, Casero RA. Inhibition of lysine-specific demethylase 1 by polyamine analogues results in reexpression of aberrantly silenced genes. Proc. Nat'l. Acad. Sci. U.S.A. 2007;104:8023–8028. doi: 10.1073/pnas.0700720104. [DOI] [PMC free article] [PubMed] [Google Scholar]
- 11.Huang Y, Stewart TM, Wu Y, Baylin SB, Marton LJ, Perkins B, Jones RJ, Woster PM, Casero RA., Jr Novel oligoamine analogues inhibit lysine-specific demethylase 1 and induce reexpression of epigenetically silenced genes. Clin. Cancer Res. 2009;15:7217–7228. doi: 10.1158/1078-0432.CCR-09-1293. dx.doi.org/1078-0432.CCR-09-1293 [pii] [DOI] [PMC free article] [PubMed] [Google Scholar]
- 12.Nowotarski SL, Pachaiyappan B, Holshouser SL, Kutz CJ, Li Y, Huang Y, Sharma SK, Casero RA J, Woster PM. Structure-activity study for (bis)ureidopropyl- and (bis)thioureidopropyldiamine LSD1 inhibitors with 3-5-3 and 3-6-3 carbon backbone architectures. Bioorg. Med. Chem. 2015;23:1601–1612. doi: 10.1016/j.bmc.2015.01.049. [DOI] [PMC free article] [PubMed] [Google Scholar]
- 13.Sharma S, Wu Y, Steinbergs N, Crowley M, Hanson A, Casero RAJ, Woster P. (Bis)urea and (bis)thiourea inhibitors of lysine-specific demethylase 1 as epigenetic modulators. J. Med. Chem. 2010;53:5197–5212. doi: 10.1021/jm100217a. [DOI] [PMC free article] [PubMed] [Google Scholar]
- 14.Sharma SK, Hazeldine S, Crowley ML, Hanson A, Beattie R, Varghese S, Sennanayake TMD, Hirata A, Hirata F, Huang Y, Wu Y, Steinbergs N, Murray-Stewart T, Bytheway I, Casero RA J, Woster PM. Polyamine-based small molecule epigenetic modulators. MedChemComm. 2012;3:14–21. doi: 10.1039/C1MD00220A. [DOI] [PMC free article] [PubMed] [Google Scholar]
- 15.Kutz CJ, Holshouser SL, Marrow EA, Woster PM. 3,5-Diamino-1,2,4-triazoles as a novel scaffold for potent, reversible LSD1 (KDM1A) inhibitors. MedChemComm. 2014;5:1863–1870. doi: 10.1039/C4MD00283K. dx.doi.org/10.1039/C4MD00283K. [DOI] [PMC free article] [PubMed] [Google Scholar]
- 16.Zheng YC, Duan YC, Ma JL, Xu RM, Zi X, Lv WL, Wang MM, Ye XW, Zhu S, Mobley D, Zhu YY, Wang JW, Li JF, Wang ZR, Zhao W, Liu HM. Triazole-Dithiocarbamate Based Selective Lysine Specific Demethylase 1 (LSD1) Inactivators Inhibit Gastric Cancer Cell Growth, Invasion, and Migration. J. Med. Chem. 2013;56:8543–8560. doi: 10.1021/jm401002r. dx.doi.org/10.1021/jm401002r. [DOI] [PMC free article] [PubMed] [Google Scholar]
- 17.Culhane JC, Szewczuk LM, Liu X, Da G, Marmorstein R, Cole PA. A mechanism-based inactivator for histone demethylase LSD1. J. Am. Chem. Soc. 2006;128:4536–4537. doi: 10.1021/ja0602748. dx.doi.org/10.1021/ja0602748. [DOI] [PubMed] [Google Scholar]
- 18.Culhane JC, Wang D, Yen PM, Cole PA. Comparative analysis of small molecules and histone substrate analogues as LSD1 lysine demethylase inhibitors. J. Am. Chem. Soc. 2010;132:3164–3176. doi: 10.1021/ja909996p. dx.doi.org/10.1021/ja909996p. [DOI] [PMC free article] [PubMed] [Google Scholar]
- 19.Szewczuk LM, Culhane JC, Yang M, Majumdar A, Yu H, Cole PA. Mechanistic analysis of a suicide inactivator of histone demethylase LSD1. Biochemistry. 2007;46:6892–6902. doi: 10.1021/bi700414b. dx.doi.org/10.1021/bi700414b. [DOI] [PMC free article] [PubMed] [Google Scholar]
- 20.Yang M, Culhane JC, Szewczuk LM, Gocke CB, Brautigam CA, Tomchick DR, Machius M, Cole PA, Yu H. Structural basis of histone demethylation by LSD1 revealed by suicide inactivation. Nat. Struct. Mol. Biol. 2007;14:535–539. doi: 10.1038/nsmb1255. [DOI] [PubMed] [Google Scholar]
- 21.Chang G, Guida WC, Still WC. An internal-coordinate Monte Carlo method for searching conformational space. J. Am. Chem. Soc. 1989;111:4379–4386. [Google Scholar]
- 22.Saunders M, Houk KN, Wu Y-D, Still WC. Conformations of Cycloheptadecane: A Comparison of Methods for Conformational Searching. J. Am. Chem. Soc. 1990;112:1419–1427. [Google Scholar]
- 23.Jorgensen WL, Maxwell DS, Tirado-Rives JT. Development and Testing of the OPLS All-Atom Force Field on Conformational Energetics and Properties of Organic Liquids. J. Am. Chem. Soc. 1996;118:11225–11236. dx.doi.org/10.1021/ja9621760. [Google Scholar]
- 24.Still WC, Tempczyk A, Hawley RC, Hendrickson T. Semianalytical treatment of solvation for molecular mechanics and dynamics. J. Am. Chem. Soc. 1990;112:6127–6129. dx.doi.org/10.1021/ja00172a038. [Google Scholar]
- 25.Feng Z, Yao Y, Zhou C, Chen F, Wu F, Wei L, Liu W, Dong S, Redell M, Mo Q, Song Y. Pharmacological inhibition of LSD1 for the treatment of MLL-rearranged leukemia. J. Hematol. Oncol. 2016;9:24. doi: 10.1186/s13045-016-0252-7. dx.doi.org/10.1186/s13045-016-0252-7. [DOI] [PMC free article] [PubMed] [Google Scholar]
- 26.Mohammad HP, Kruger RG. Antitumor activity of LSD1 inhibitors in lung cancer. Molec. Cell. Biol. 2016;3:e1117700. doi: 10.1080/23723556.2015.1117700. dx.doi.org/e1117700. [DOI] [PMC free article] [PubMed] [Google Scholar]
- 27.Mohammad HP, Smitheman KN, Kamat CD, Soong D, Federowicz KE, Van Aller GS, Schneck JL, Carson JD, Liu Y, Butticello M, Bonnette WG, Gorman SA, Degenhardt Y, Bai Y, McCabe MT, Pappalardi MB, Kasparec J, Tian X, McNulty KC, Rouse M, McDevitt P, Ho T, Crouthamel M, Hart TK, Concha NO, McHugh CF, Miller WH, Dhanak D, Tummino PJ, Carpenter CL, Johnson NW, Hann CL, Kruger RG. A DNA Hypomethylation Signature Predicts Antitumor Activity of LSD1 Inhibitors in SCLC. Cancer Cell. 2015;28:57–69. doi: 10.1016/j.ccell.2015.06.002. dx.doi.org/10.1016/j.ccell.2015.06.002. [DOI] [PubMed] [Google Scholar]
- 28.Huang Y, Greene E, Murray Stewart T, Goodwin AC, Baylin SB, Woster PM, Casero RA. Inhibition of lysine-specific demethylase 1 by polyamine analogues results in reexpression of aberrantly silenced genes. Proc. Natl. Acad. Sci. U. S. A. 2007;104:8023–8028. doi: 10.1073/pnas.0700720104. dx.doi.org/0700720104 [pii] [DOI] [PMC free article] [PubMed] [Google Scholar]
Associated Data
This section collects any data citations, data availability statements, or supplementary materials included in this article.


